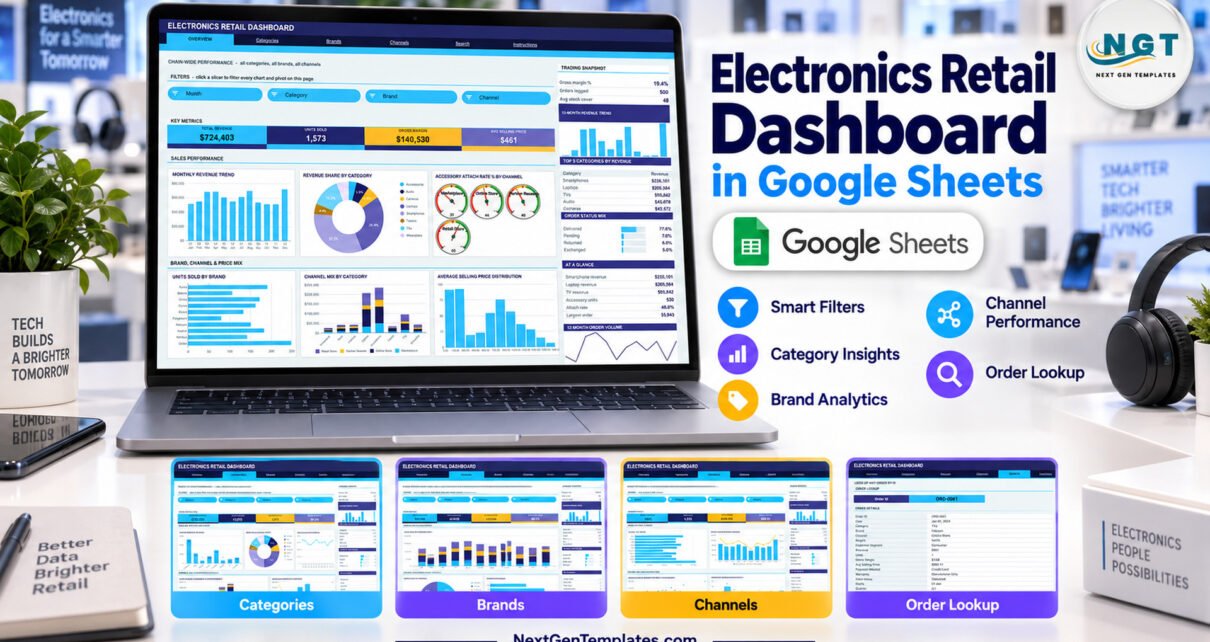
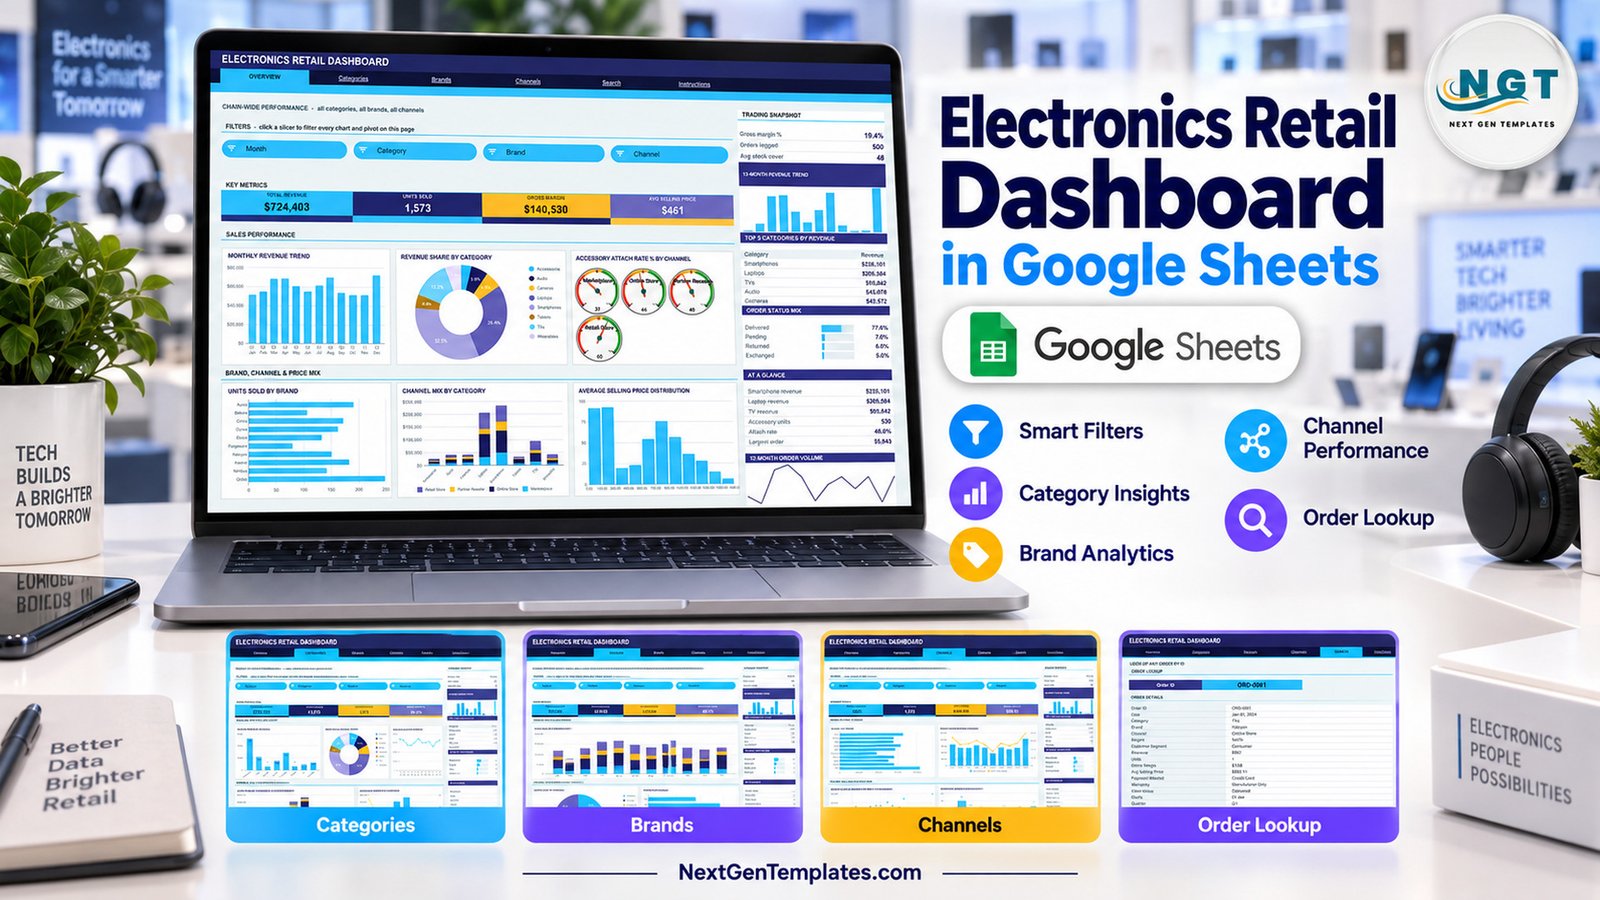
The Electronics Retail Dashboard in Google Sheets reports on 500 sample orders across 8 product categories, 10 brands, 4 sales channels and 6 regions, laid out over six linked tabs. Sixteen KPI cards, fifteen slicers and eighteen charts are already wired to native pivot tables, and the whole build auto-expands to 1,000 order rows without a single range edit.
Most electronics shops already have the data. It sits in a billing export or a point-of-sale CSV, one row per order, and nobody has the afternoon to turn it into a category-by-brand-by-channel read. This template is that afternoon, done in advance: paste your export over the Data tab and six pages of trading analysis appear behind it.
Key Features of the Electronics Retail Dashboard in Google Sheets
- Native pivot-and-slicer architecture. Every chart is bound to a pivot table parked to the right of its page, past a wide spacer column. There are no helper formula blocks chained behind the visuals, which is why the workbook stays responsive as the order log grows.
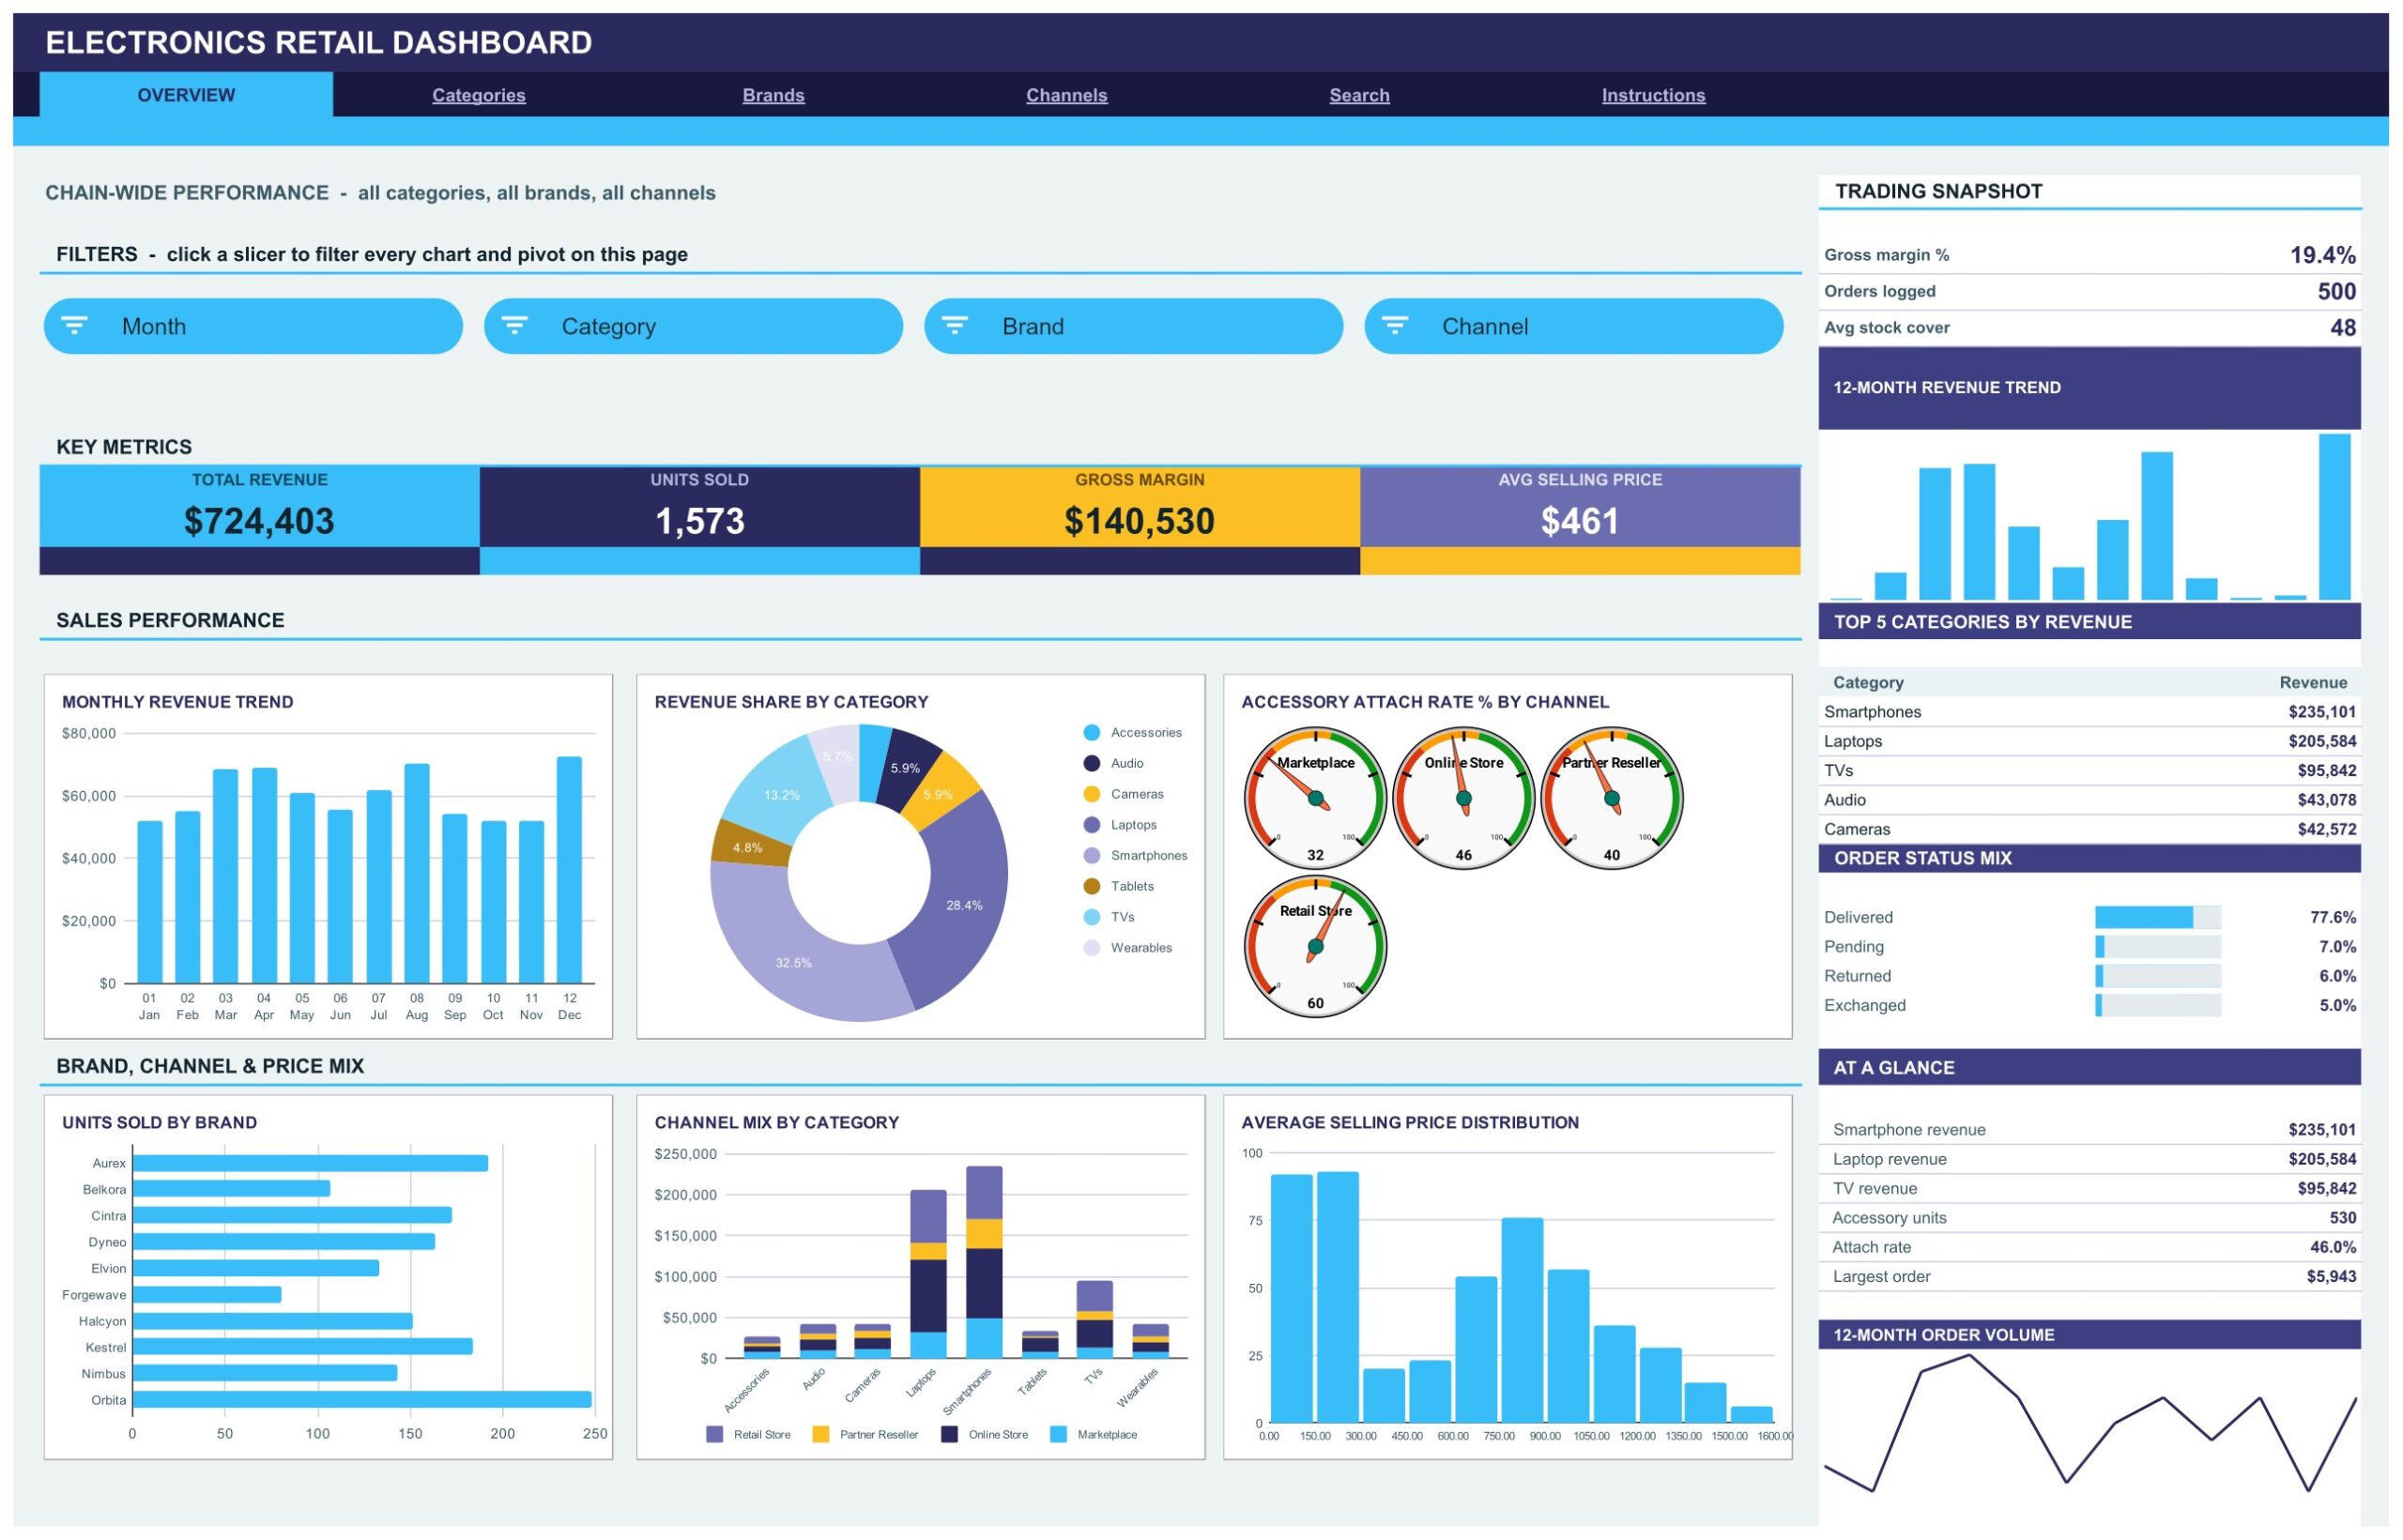
- Sixteen KPI cards. Four per analysis page. On the sample data the Overview tab reports Total Revenue of $724,403, Units Sold of 1,573, Gross Margin of $140,530 and an Average Selling Price of $461.
- Fifteen slicers. Month, Category, Brand, Channel, Customer Segment, Warranty, Region and Payment Method, grouped into a filter strip at the top of each analysis page. Click one and every chart, pivot and Top 5 panel on that page re-filters together.
- A sidebar on every analysis page. Each carries a snapshot block, a 12-month revenue trend, a Top 5 ranking table, a share-bar panel and an At A Glance list.
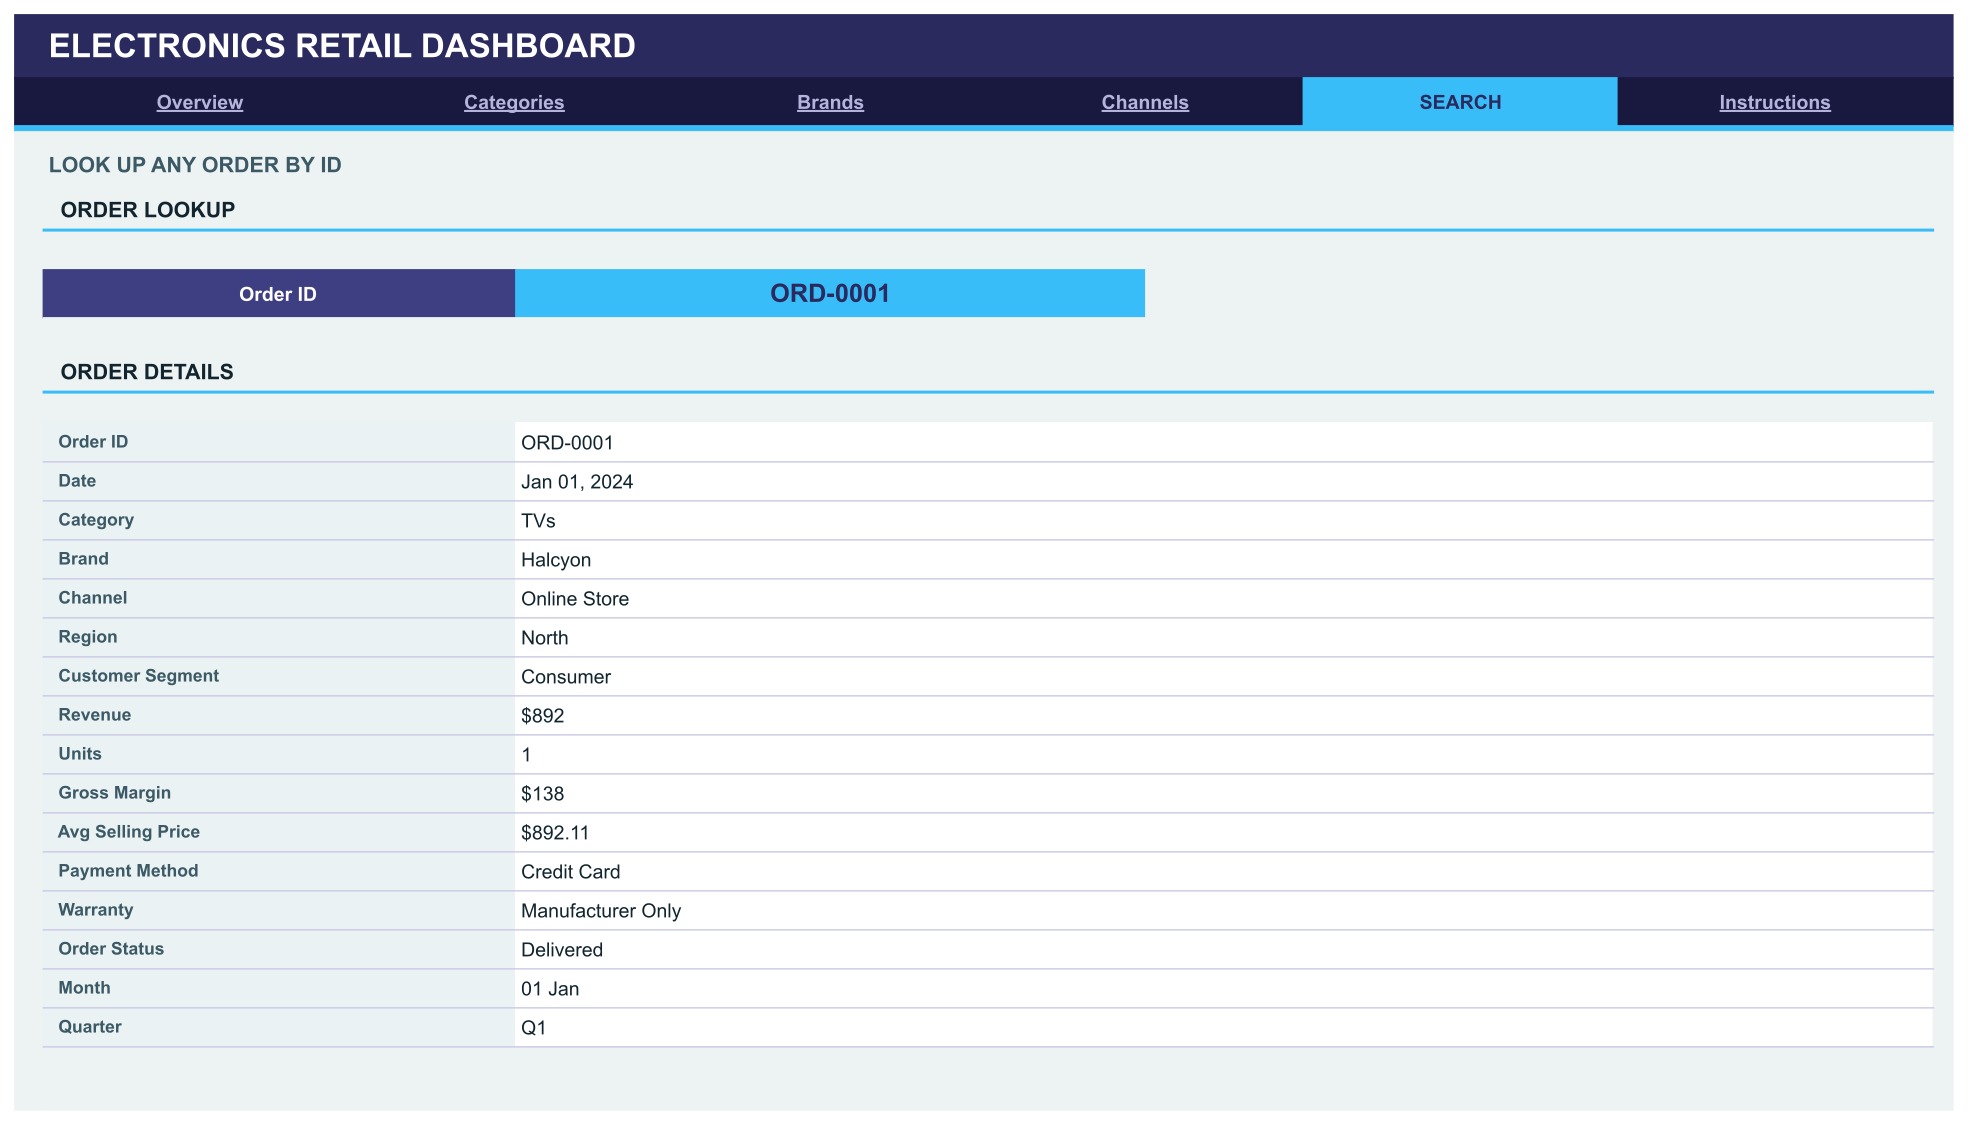
- An Order Lookup tab. Pick any Order ID from a dropdown and the page returns sixteen fields for that order, from date and brand through to warranty type, order status and quarter.
- 1,000-row auto-expand. Pivots, slicers and formulas already cover 1,000 rows on the Data tab. Paste anywhere up to row 1001 and everything downstream follows.
- An editable Indigo / Sky theme. Three colour constants at the top of the bundled Apps Script file — ink #2A2A5E, accent #38BDF8 and amber #FBBF24 — drive the whole workbook.
Dashboard Pages Explanation
The Electronics Retail Dashboard in Google Sheets ships six visible tabs plus the Data tab that feeds them. Each analysis page answers a different trading question, and each keeps its own slicer state so you can leave four different filters set at once.
Page 1: Overview — Chain-Wide Performance
The landing tab reports all categories, all brands and all channels together. Four KPI cards show Total Revenue, Units Sold, Gross Margin and Avg Selling Price. The charts are Monthly Revenue Trend, Revenue Share by Category, Accessory Attach Rate % by Channel, Units Sold by Brand, Channel Mix by Category and Average Selling Price Distribution. The sidebar adds a Trading Snapshot reading 19.4% gross margin, 500 orders logged and an average stock cover of 48, a Top 5 Categories by Revenue table, and an Order Status Mix of Delivered 77.6%, Pending 7.0%, Returned 6.0% and Exchanged 5.0%.
Page 2: Categories — Product Mix, Margin and Price Point
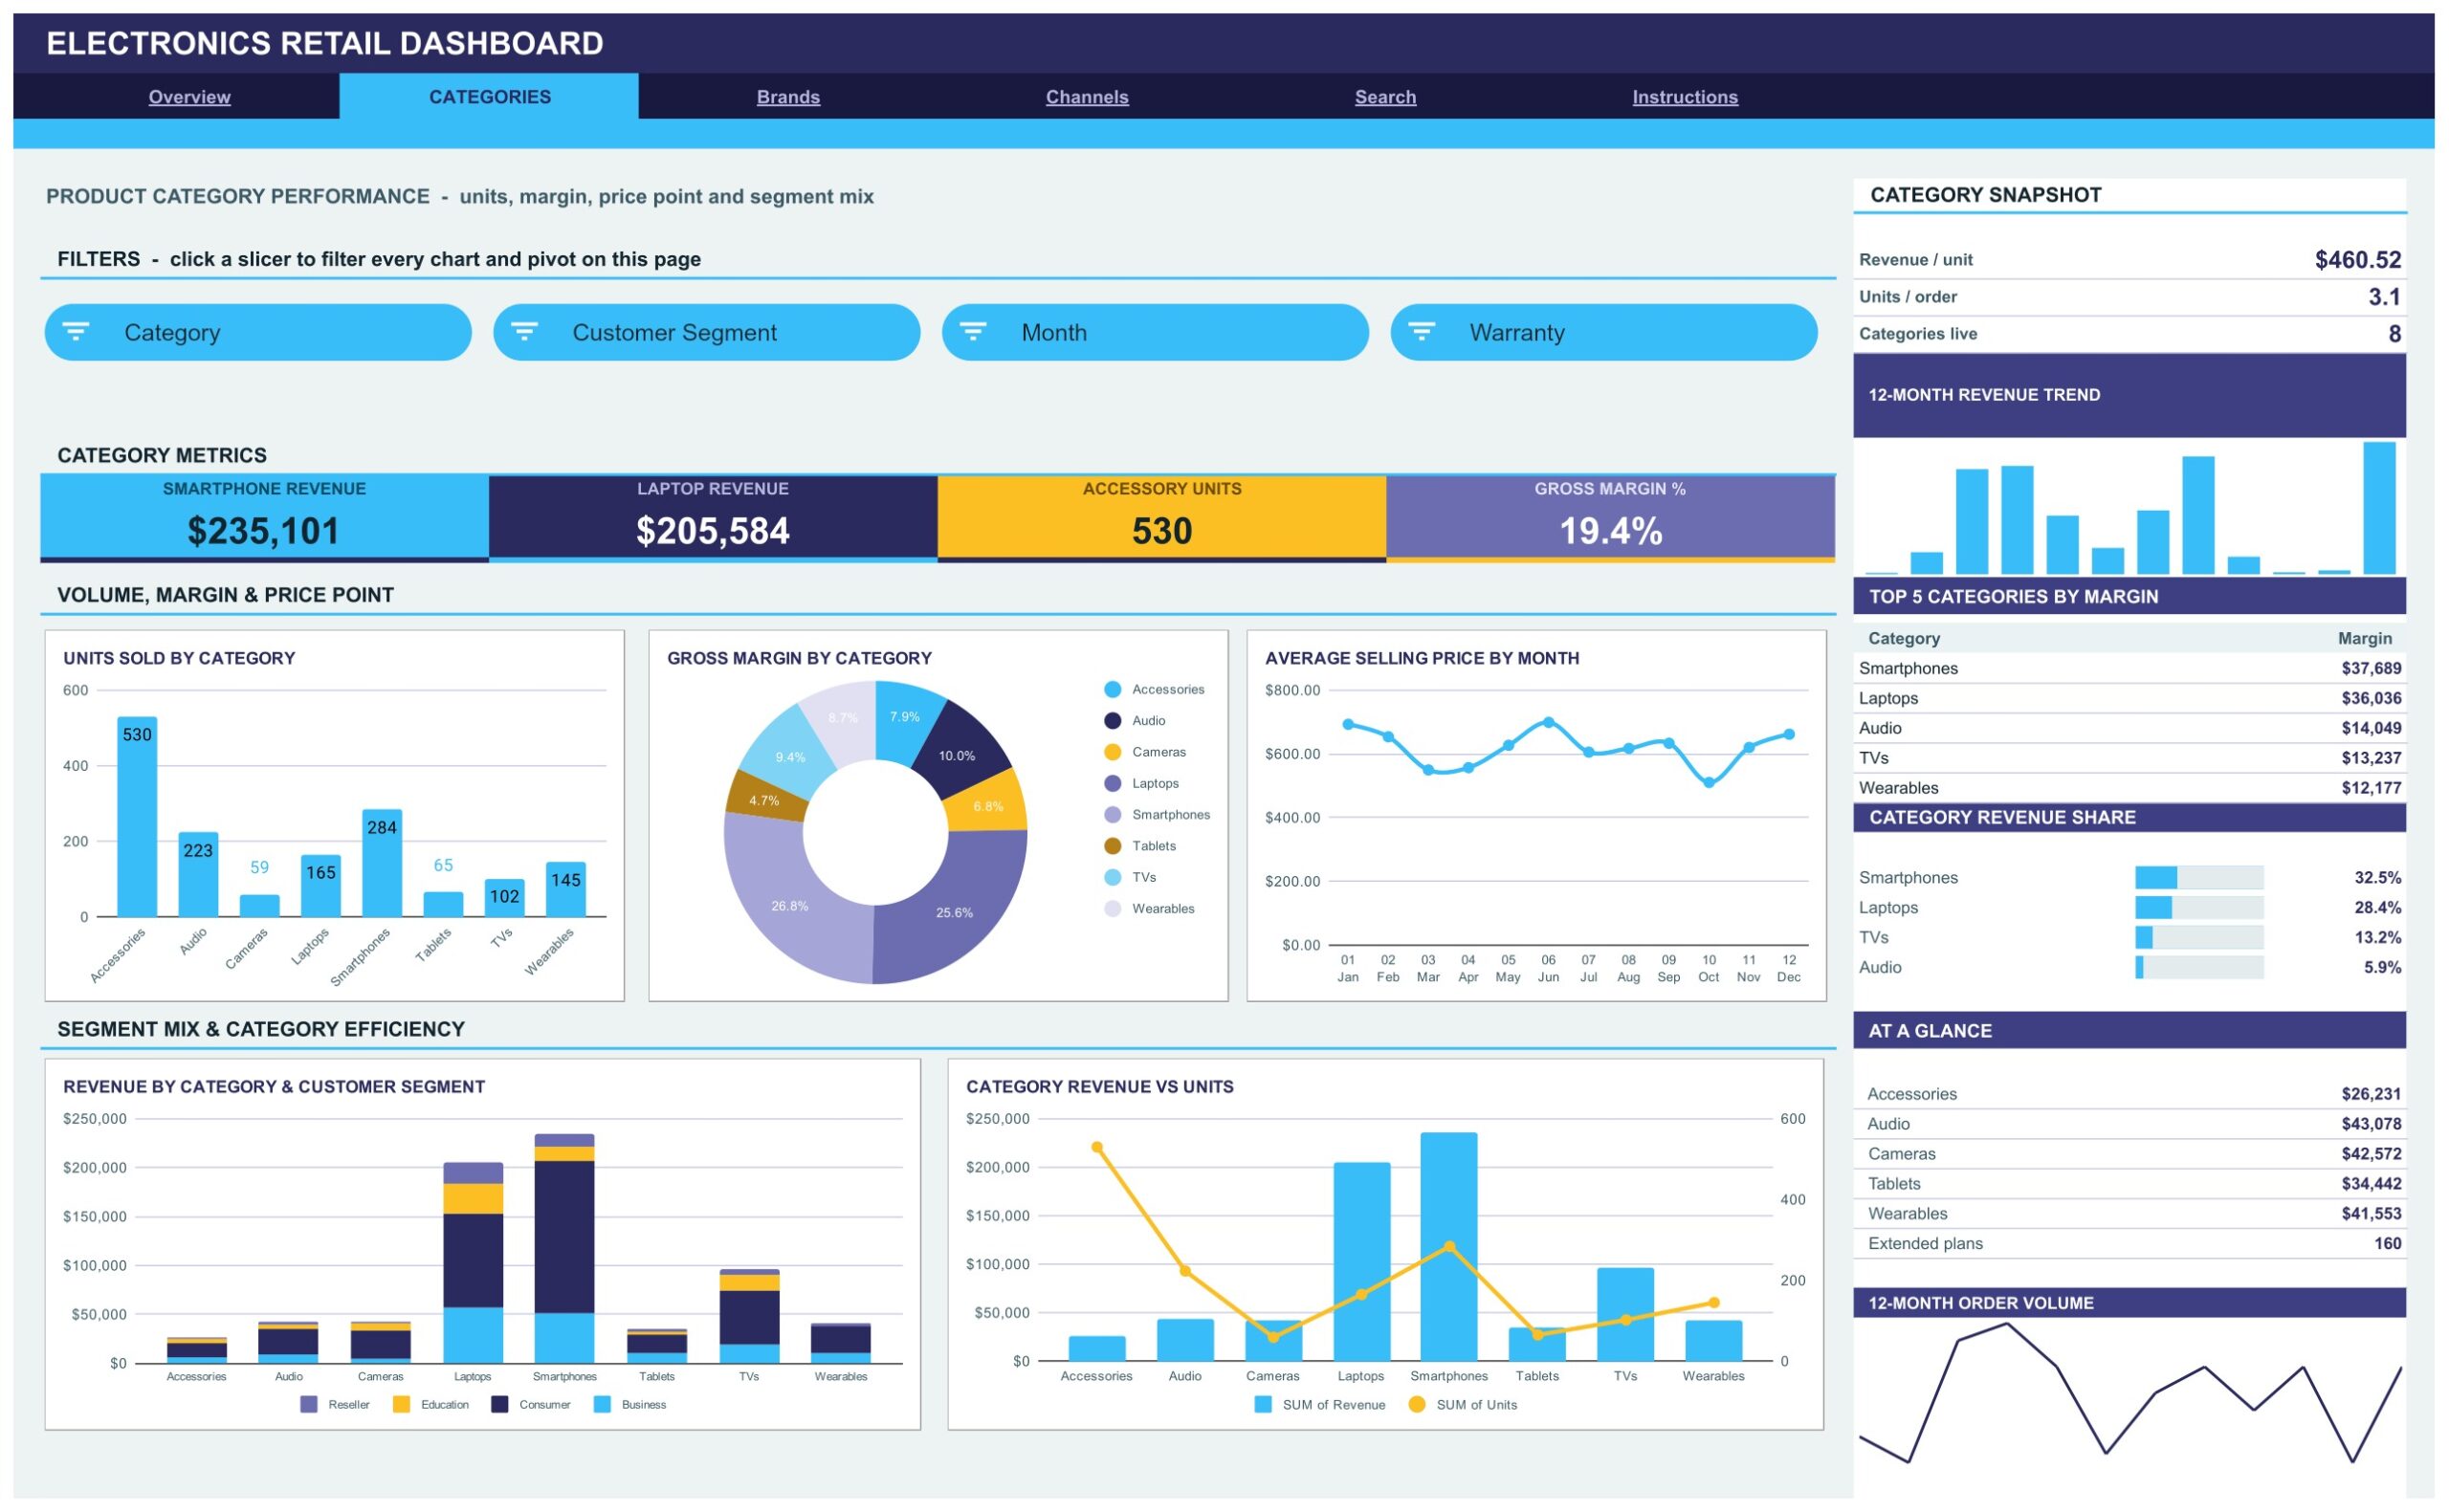
This tab breaks trading down by the eight categories the template ships with: Accessories, Audio, Cameras, Laptops, Smartphones, Tablets, TVs and Wearables. Cards report Smartphone Revenue $235,101, Laptop Revenue $205,584, Accessory Units 530 and Gross Margin % 19.4%. Charts are Units Sold by Category, Gross Margin by Category, Average Selling Price by Month, Revenue by Category & Customer Segment and Category Revenue vs Units. The sidebar shows revenue per unit of $460.52, 3.1 units per order, eight categories live, a Top 5 Categories by Margin table and the category revenue share — Smartphones 32.5%, Laptops 28.4%, TVs 13.2% and Audio 5.9%.
Page 3: Brands — Revenue, Margin Quality and Momentum
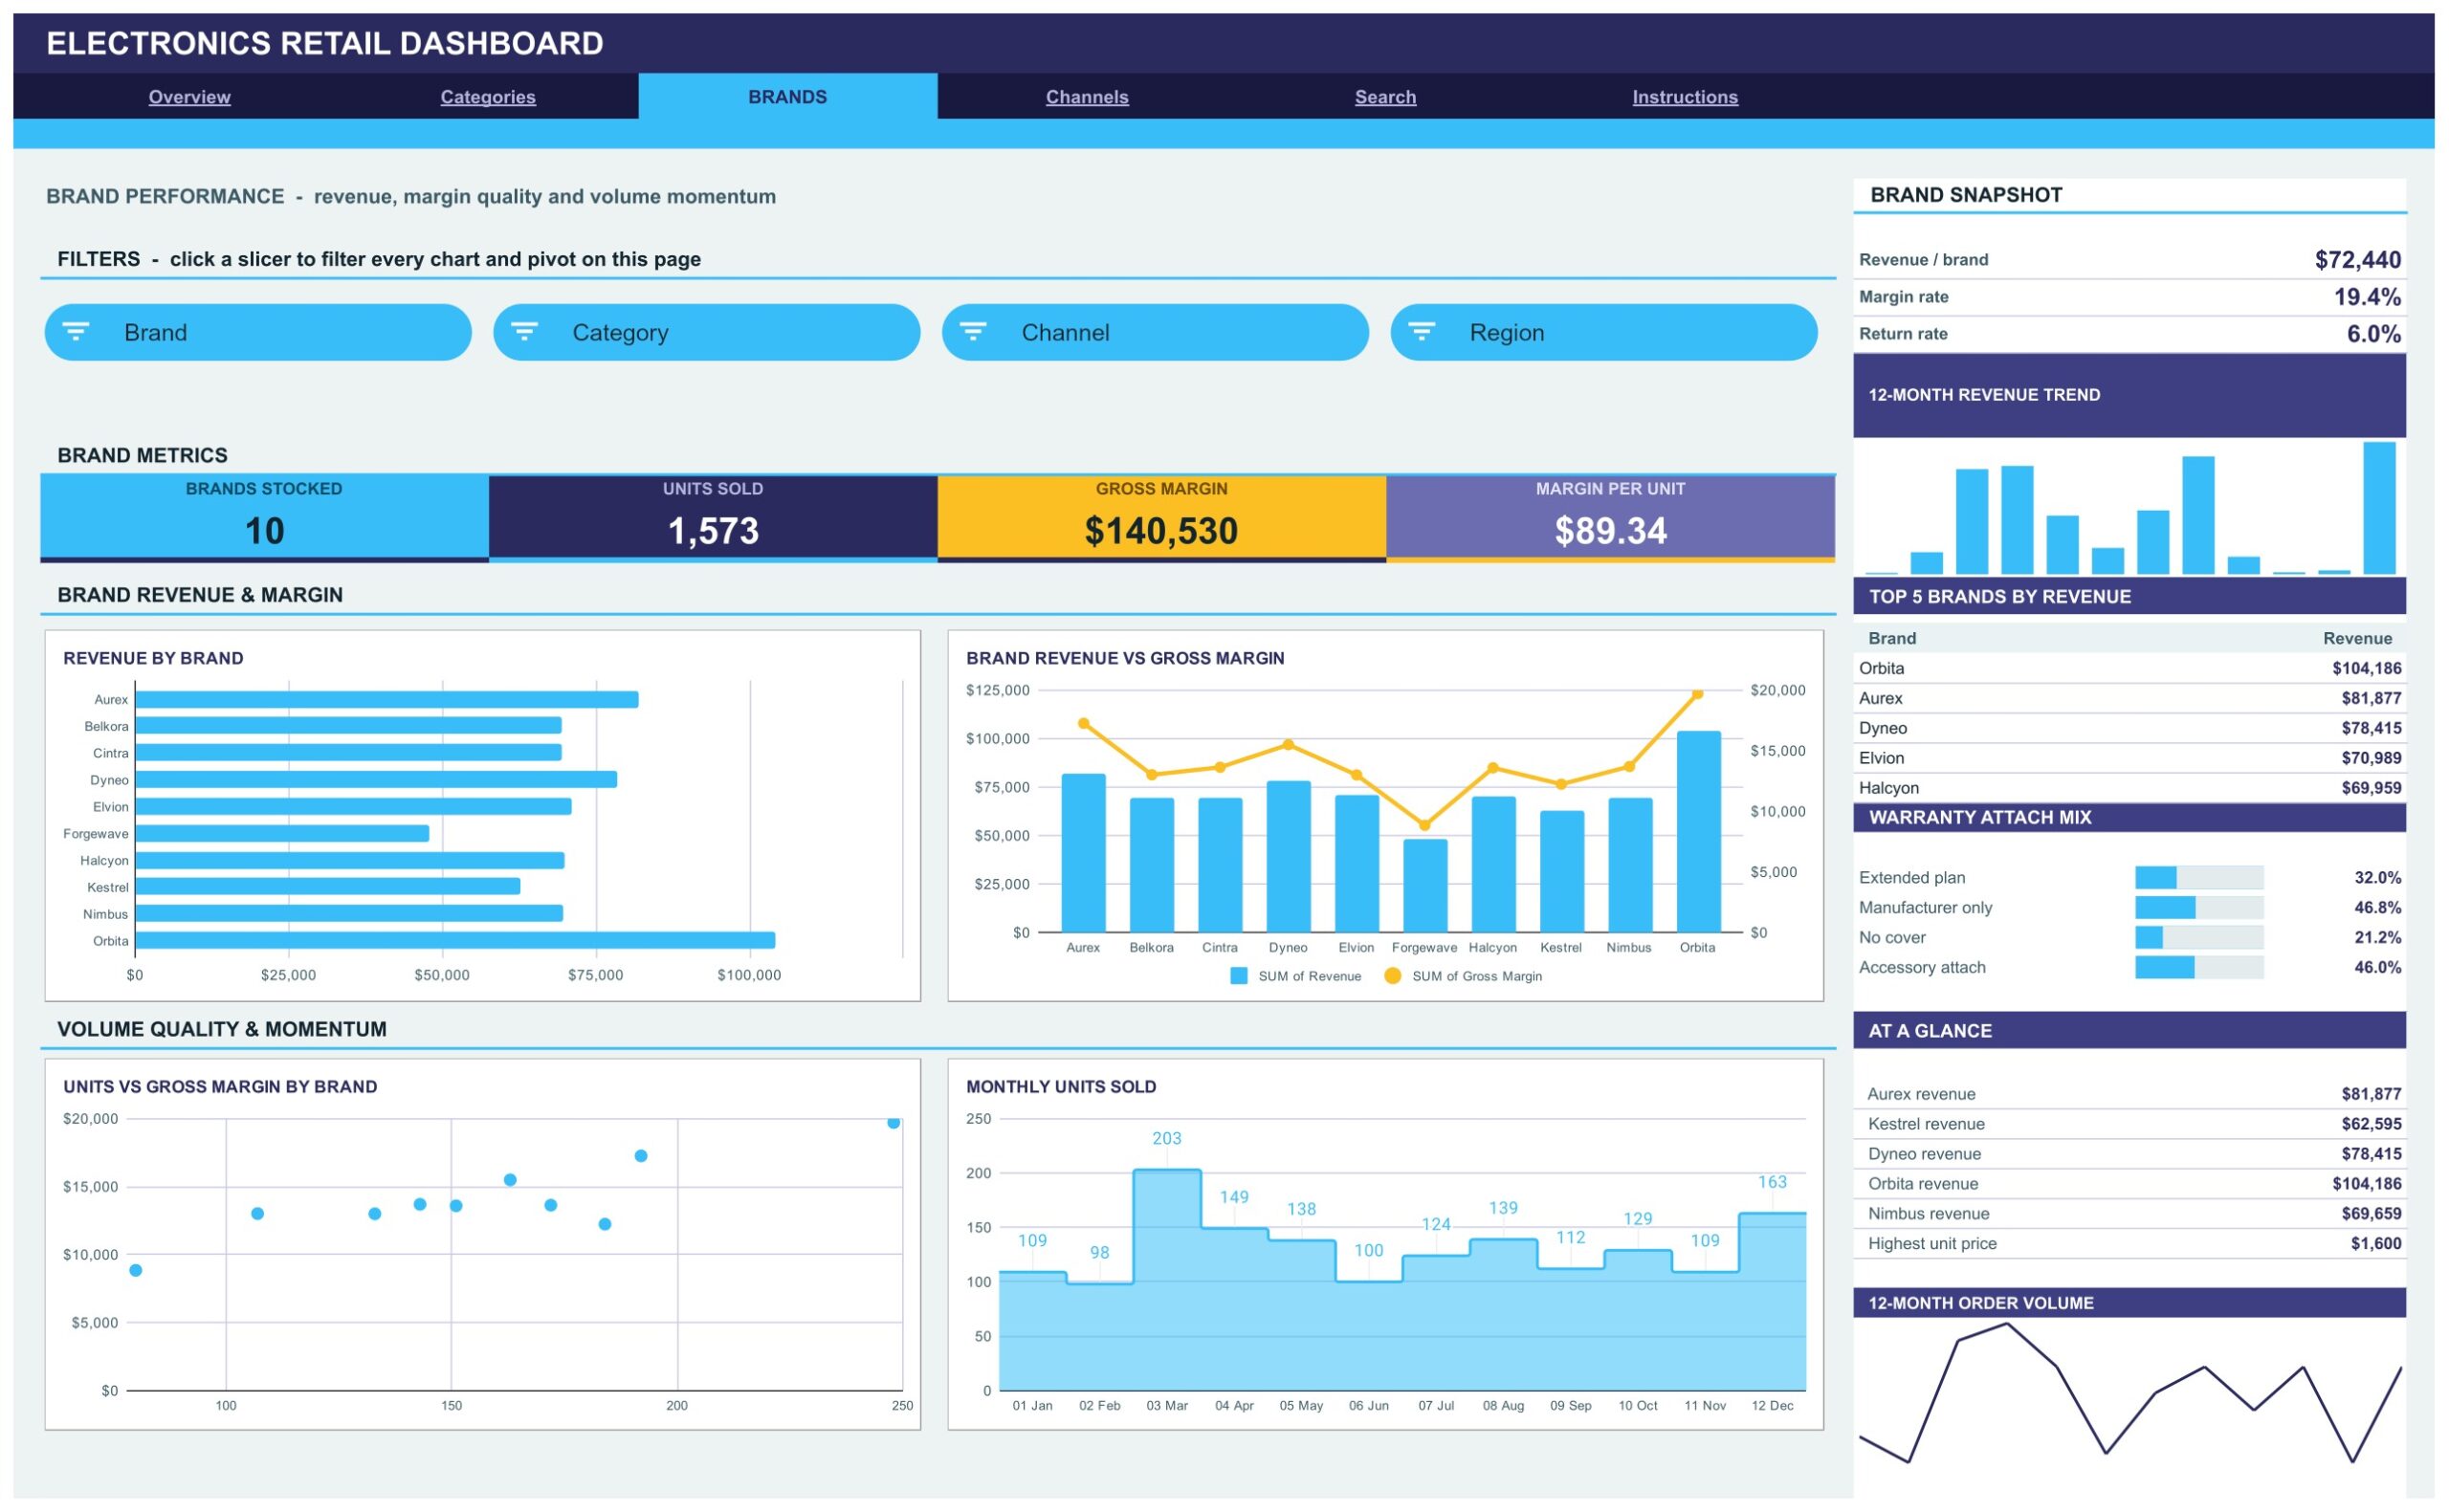
Ten stocked brands are ranked here: Aurex, Belkora, Cintra, Dyneo, Elvion, Forgewave, Halcyon, Kestrel, Nimbus and Orbita. Cards report Brands Stocked 10, Units Sold 1,573, Gross Margin $140,530 and Margin per Unit $89.34. Charts are Revenue by Brand, Brand Revenue vs Gross Margin, Units vs Gross Margin by Brand and Monthly Units Sold. The sidebar carries revenue per brand of $72,440, a 6.0% return rate, a Top 5 Brands by Revenue table led by Orbita at $104,186, and a Warranty Attach Mix of Extended plan 32.0%, Manufacturer only 46.8%, No cover 21.2% and Accessory attach 46.0%.
Page 4: Channels — Route to Market
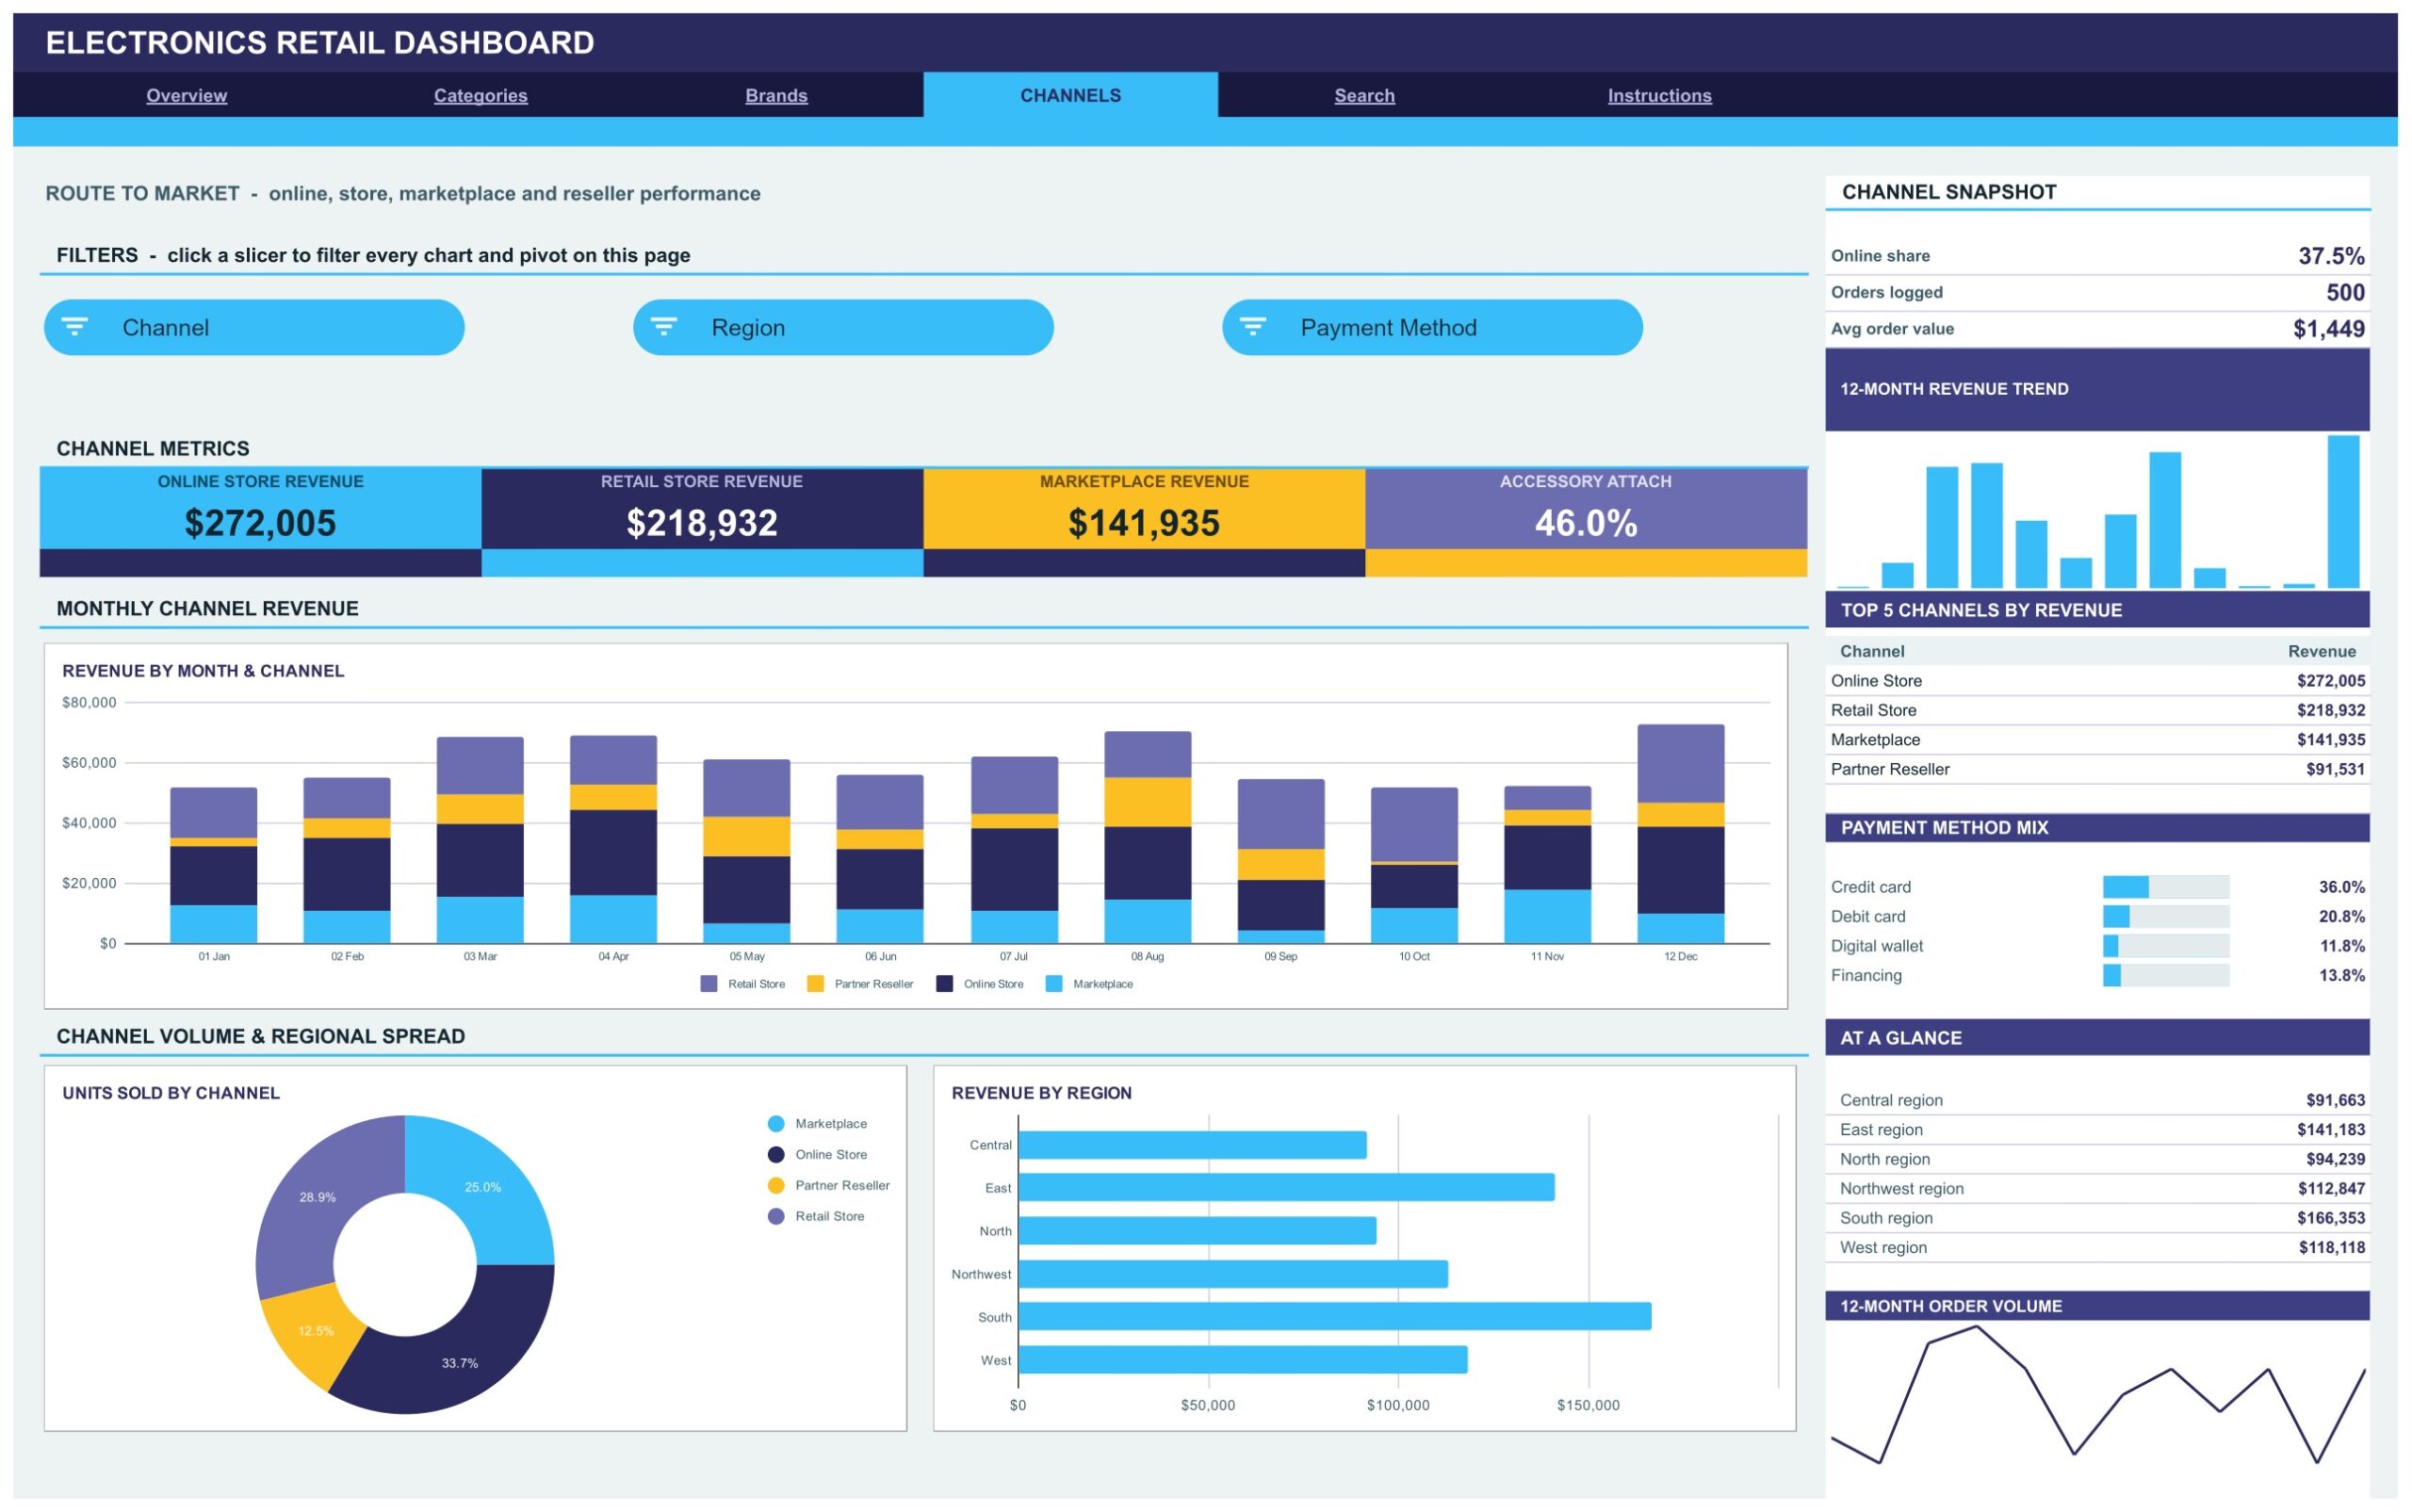
The channel tab compares Online Store, Retail Store, Marketplace and Partner Reseller. Cards report Online Store Revenue $272,005, Retail Store Revenue $218,932, Marketplace Revenue $141,935 and an Accessory Attach of 46.0%. Charts are Revenue by Month & Channel, Units Sold by Channel and Revenue by Region across Central, East, North, Northwest, South and West. The sidebar adds an online share of 37.5%, an average order value of $1,449, a Top 5 Channels by Revenue table and a Payment Method Mix of credit card 36.0%, debit card 20.8%, financing 13.8% and digital wallet 11.8%.
Page 5: Search — Order Lookup
One dropdown picks any Order ID in the log and the page returns that order’s full record in sixteen labelled rows: Order ID, Date, Category, Brand, Channel, Region, Customer Segment, Revenue, Units, Gross Margin, Avg Selling Price, Payment Method, Warranty, Order Status, Month and Quarter. It answers the “what actually happened on this one order” question without scrolling a 500-row data tab.
Page 6: Instructions — User Guide
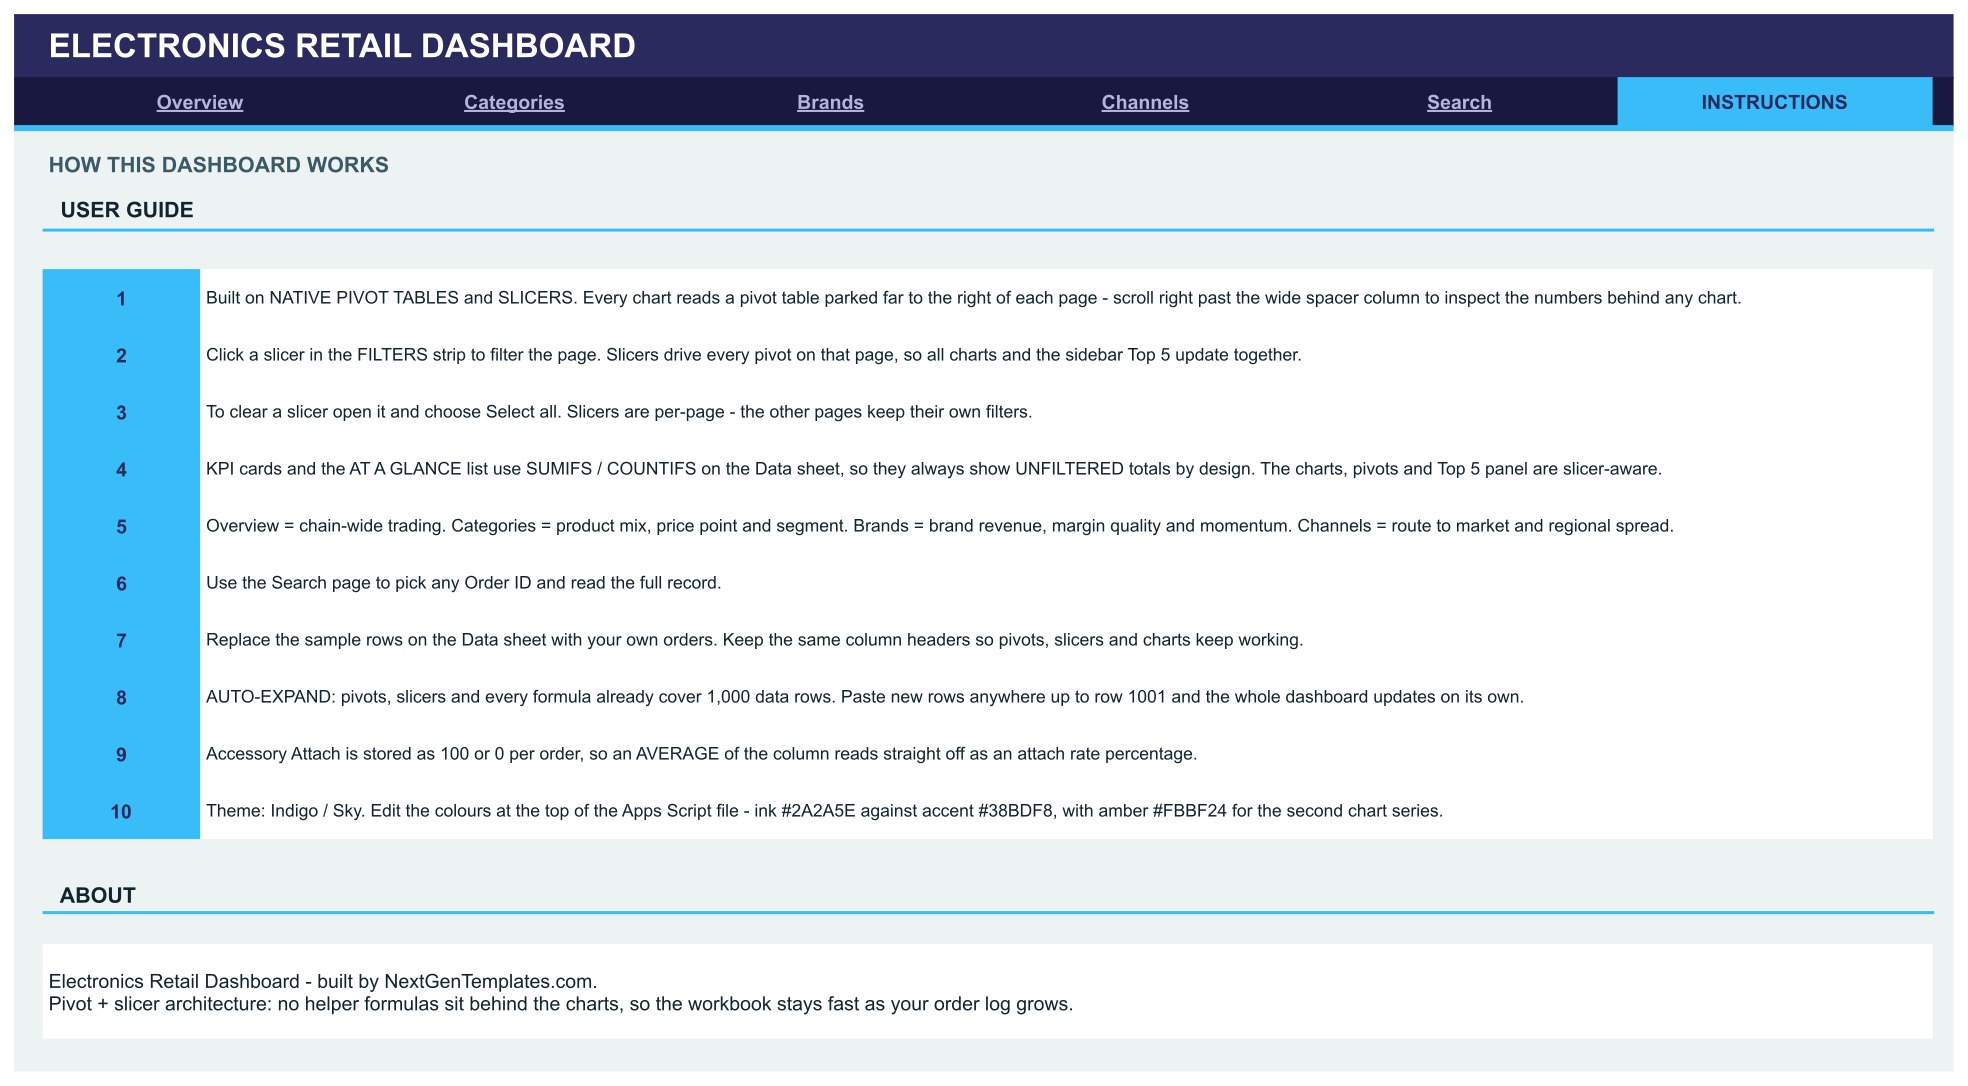
A ten-point guide explains the pivot-and-slicer architecture, how to clear a slicer with Select all, why the KPI cards stay unfiltered by design, how the 1,000-row auto-expand works, how Accessory Attach is stored as 100 or 0 so an average reads straight off as a percentage, and where to edit the theme colours in the Apps Script file.
The Data Tab
Behind the six visible tabs sits the Data tab with the 500 sample orders. Keep the column headers exactly as they are, replace the rows with your own export, and every pivot, slicer and chart keeps working. Google’s own documentation on creating and using pivot tables is worth a skim if you plan to add a pivot of your own alongside the shipped ones.
Electronics Retail Dashboard vs. an Excel Dashboard vs. Paid Retail BI — Feature Comparison
| Feature | Electronics Retail Dashboard (Google Sheets) | Microsoft Excel dashboard | Tableau / Domo / retail BI suite |
|---|---|---|---|
| Cost | One-time purchase ✅ | One-time purchase plus Microsoft 365 | $70–$190 per user per month |
| Platform | Any browser, nothing to install ✅ | Desktop Excel | Browser plus a data pipeline |
| Setup time | Under 10 minutes ✅ | 10–20 minutes | Days to weeks with a data engineer |
| Real-time team collaboration | Built in ✅ | Only via OneDrive co-authoring | Yes, on paid seats |
| Mobile access | Google Sheets app ✅ | Limited on mobile Excel | Yes, on paid seats |
| Customisable fields | Edit any column or pivot ✅ | Yes | Admin-controlled schema |
| Share with a link | Yes, view or edit ✅ | File attachment or OneDrive link | A seat is required to view |
| Order-level lookup | Search tab, sixteen fields ✅ | Needs a lookup formula | Yes, via a detail view |
| Year-1 cost at 5 users | The purchase price, once ✅ | Purchase plus five Microsoft 365 seats | $4,200–$11,400 |
For a shop or small chain that wants real consumer electronics retail analytics without paying per seat every month, this template sits in the sweet spot.
Who Should Use This Template
Perfect for:
- Owners and managers of single-store or small-chain electronics shops who already keep an order log in a spreadsheet
- Category and brand buyers who need a margin-by-category and margin-by-brand read every month
- Marketplace and online sellers comparing a direct store, a marketplace and a reseller channel side by side
- Analysts and consultants who want a finished layout to drop a client’s export into
- Anyone who wants an electronics store sales dashboard that opens in a browser with nothing to install
Not a fit if:
- You need a live POS, ERP or e-commerce connection — this template reads a Data tab you paste into, and ships with sample data only
- You need serial-number or IMEI tracking, warranty registration or RMA processing — the template reports a warranty type per order, it does not run returns
- Your order log runs far past 1,000 rows and you would rather not widen the pivot and slicer ranges yourself
- You need row-level security, SSO or an audited warehouse behind the numbers
Real-World Use Cases
Rohit runs two electronics showrooms and a marketplace storefront. Every Monday he exports his order log, pastes it over the Data tab and opens the Channels page. In ten seconds he can see whether the marketplace is still carrying a quarter of his units at a thinner margin than the shop floor — a question his billing software never answered on one screen.
Priya buys for the smartphone and laptop categories at a regional chain. She lives on the Categories tab, filtering by Customer Segment to check whether business buyers really do lift the average selling price, and reads Gross Margin by Category to decide which lines get the next promotion. The Top 5 Categories by Margin panel settles most of those arguments before the meeting starts.
Daniel consults for independent retailers. He keeps one copy of the template per client, drops their export in, and walks into the review with six pages of analysis instead of rebuilding pivots from scratch each time. Because the file is a Google Sheet, he shares a view-only link rather than emailing a workbook around.
Advantages of the Electronics Retail Dashboard in Google Sheets
The obvious win is cost: a paid retail BI seat runs $70 to $190 per user per month, and five seats clears $4,200 in the first year before anyone has built a report. This is a one-time purchase that opens in a browser the same afternoon.
The less obvious win is the architecture. Because every visual reads a real pivot table rather than a chain of helper formulas, you can scroll right on any page and check the exact numbers a chart is drawing. That makes the workbook auditable in a way that a formula-stacked dashboard is not, and it means adding your own pivot alongside the shipped ones does not risk breaking anything upstream.
Collaboration is the third. A Google Sheet is shareable by link, editable by several people at once and readable on a phone, so a buyer, a store manager and an accountant can be looking at the same six pages without anyone mailing a file around.
Opportunities for Improvement
Three things are worth knowing before you buy. First, the KPI cards and the At A Glance lists use SUMIFS and COUNTIFS against the Data tab, so they deliberately report unfiltered chain-wide totals. Click a slicer and the charts move but the cards do not — that is by design, and the Instructions tab says so, but it surprises people on day one.
Second, there is no live connection. The template holds sample data only and expects you to paste or import your own export. If you want a nightly sync from a point-of-sale system you will need to bolt that on yourself, most likely with Apps Script.
Third, the 1,000-row ceiling is generous for a single store but modest for a chain logging thousands of orders a month. Going beyond it means widening the pivot sources and slicer ranges by hand — straightforward, but not automatic.
Best Practices
- Keep the Data tab column headers untouched. Everything — pivots, slicers, cards and charts — is keyed to those header names.
- Store Accessory Attach as 100 or 0 per order. That is what lets a plain AVERAGE read straight off as an attach-rate percentage on the gauges.
- Clear a slicer with Select all rather than unticking values one by one, and remember slicers are per-page.
- Scroll right past the spacer column whenever a chart looks wrong — the pivot behind it will tell you whether the problem is the data or the visual.
- Take a fresh copy of the template for each client or each trading year rather than growing one file indefinitely.
- Comfortable with lookups? The techniques in XLOOKUP in Google Sheets pair well with the Search tab if you want to extend the order record with fields of your own.
Explore Relevant Templates
If this build suits you, the same pivot-and-slicer approach turns up in every other google sheets retail dashboard template in the range:
- Electronics & Semiconductors Dashboard in Google Sheets — the manufacturing and supply side of the same industry.
- Supermarkets Dashboard in Google Sheets — the same pivot-and-slicer build applied to grocery retail.
- Convenience Stores Dashboard in Google Sheets — a smaller-format retail read with its own channel mix.
- Inventory Tracker in Google Sheets — pair it with this dashboard to watch stock cover as well as sell-through.
- Ecommerce Conversion Rate KPI Dashboard in Google Sheets — for the traffic-to-order half of an online store.
Also available as: Electronics Retail Dashboard in Excel, Electronics Retail Dashboard in Power BI and Electronics Retail KPI Dashboard in Excel — each rebuilt for its own platform rather than ported across.
Frequently Asked Questions
What does the Electronics Retail Dashboard in Google Sheets track?
It tracks revenue, units, gross margin, average selling price and accessory attach rate across 8 categories, 10 brands, 4 channels, 6 regions, 4 customer segments and 4 payment methods, on 500 sample orders you replace with your own export.
How long does setup take?
Under 10 minutes. Open the PDF in your download, click Make a copy, then paste your order rows over the sample data on the Data tab. Pivots, slicers and charts already cover 1,000 rows, so nothing needs re-ranging first.
Does it connect to a POS or e-commerce platform?
No. It is a reporting template with sample data only, with no POS, ERP or e-commerce connection. You paste or import your own export into the Data tab, which is exactly what keeps it usable in any browser with no IT project behind it.
Why do the KPI cards ignore my slicer selection?
By design. The cards and the At A Glance lists use SUMIFS and COUNTIFS against the Data tab, so they always report unfiltered chain-wide totals. The charts, pivots and Top 5 panels are the slicer-aware parts of each page.
How does this compare to Tableau or a paid retail BI suite?
A paid suite costs $70 to $190 per user per month and needs a data pipeline behind it. This template is a one-time purchase that opens in a browser. You give up live connectors and row-level security; you keep full control of every column and every pivot.
Can I track electronics store sales in google sheets from my phone?
Yes. It runs in the Google Sheets mobile app like any other sheet, and the charts and slicers render there. The six-page layout is still far easier to read on a tablet or a desktop screen.
Does it handle warranty claims or returns?
Not as a workflow. The template records a warranty type and an order status per order and reports the mix, but it does not do serial-number or IMEI tracking, warranty registration or RMA processing.
About the Author
Built by PK — Microsoft Certified Professional with 15+ years of Excel, Google Sheets and Power BI experience. Founder of NextGenTemplates, reaching 300K+ subscribers across YouTube channels. Every template is hand-built and tested before release.
Conclusion
If your order data already exists and the only thing missing is a view of it, the Electronics Retail Dashboard in Google Sheets closes that gap in an afternoon. Six tabs, sixteen KPI cards, fifteen slicers and eighteen charts, all reading real pivot tables you can inspect, with a Search tab for the single-order questions that no chart answers.
👉 Click here to Purchase the Electronics Retail Dashboard in Google Sheets
✅ Instant download · One-time payment · No subscription
🎥 For step-by-step video walkthroughs, visit Youtube.com/@NeoTechNavigators.
Last updated: September 2026