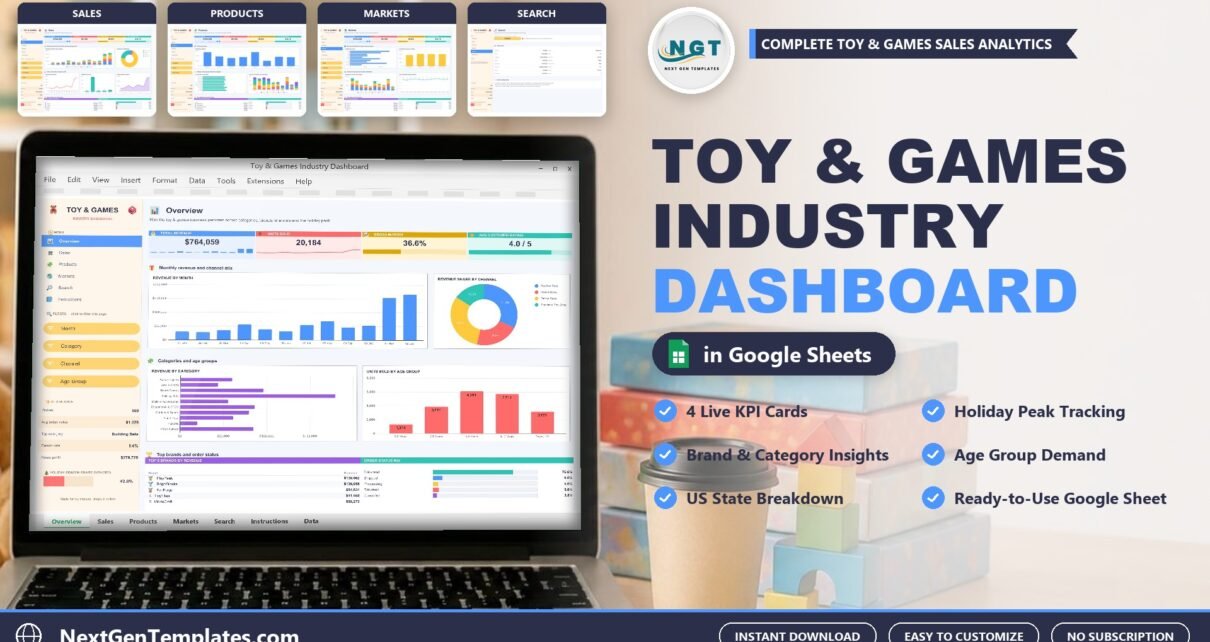
The Toy & Games Industry Dashboard in Google Sheets reports on 500 sample orders across 10 toy and game categories, 8 brands, 4 sales channels and 10 US states, laid out over six linked pages plus a Data tab. Four KPI cards, fifteen slicers and sixteen charts are ready to read, and the pivots already cover 1,000 order lines.
Toy sales are lumpy. A big share of the year lands in November and December, brands and age groups behave differently, and the order data usually sits in a billing export or marketplace report that nobody has time to analyse. This toy industry dashboard is that analysis, done in advance: paste your export over the Data tab and the dashboard follows.
Get the Toy & Games Industry Dashboard in Google Sheets
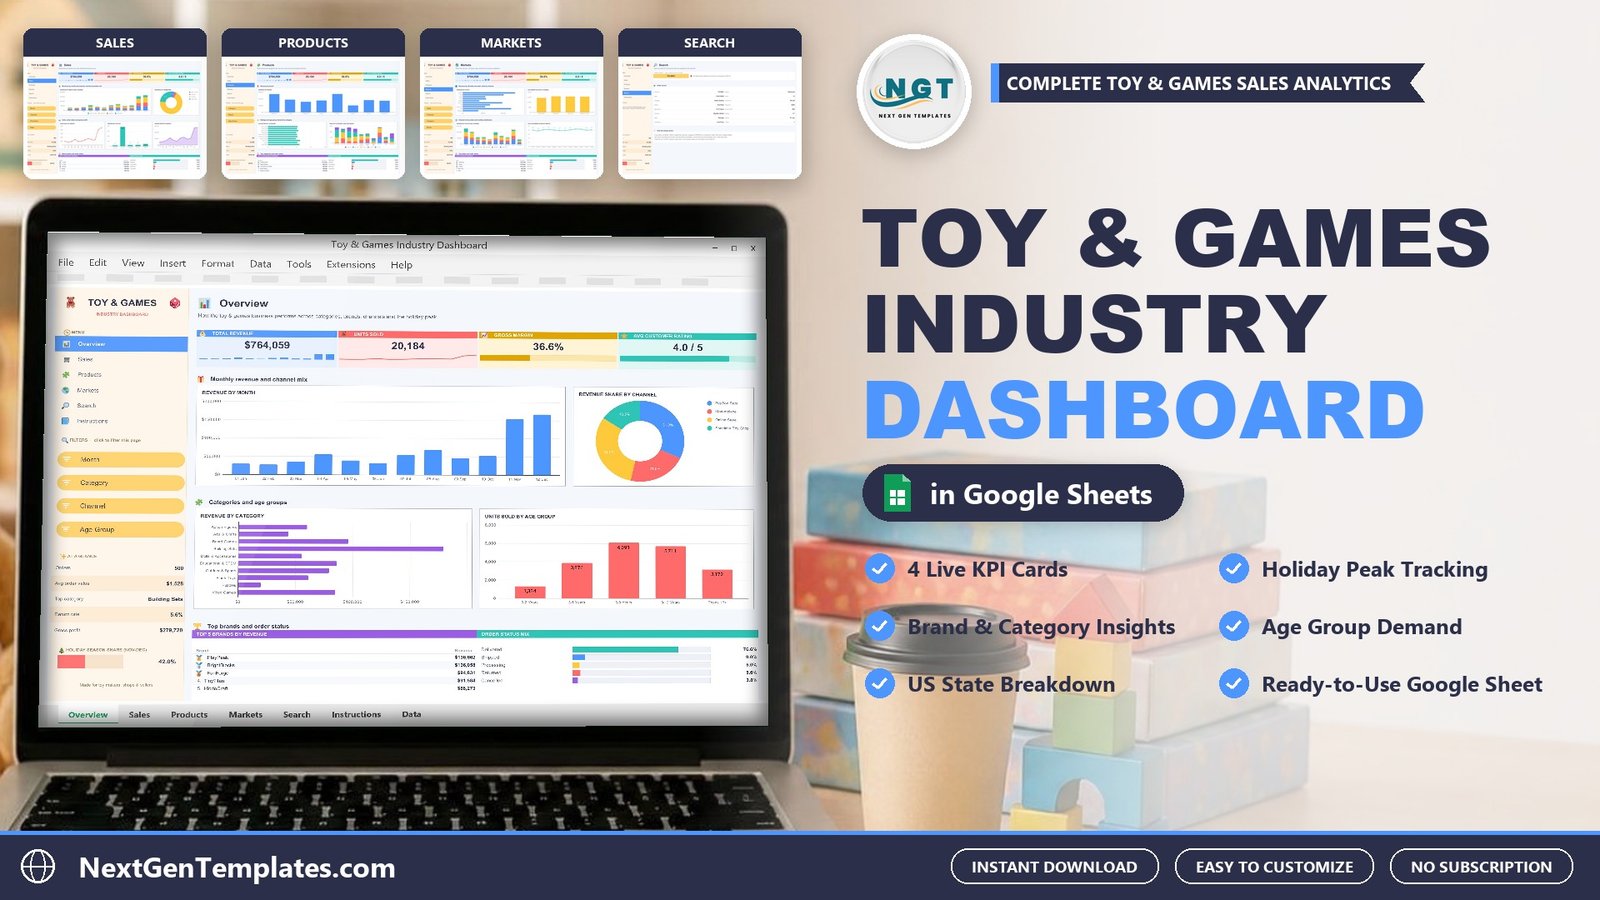
Key Features of the Toy & Games Industry Dashboard in Google Sheets
- Four KPI cards on every page. On the sample data: Total Revenue $764,059, Units Sold 20,184, Gross Margin 36.6% and Avg Customer Rating 4.0 / 5.
- Fifteen slicers. Month, Category, Channel, Age Group, Promotion, State and Brand, grouped into a yellow filter strip in the left rail of each dashboard page. Slicers apply to their own page only.
- Sixteen charts. Four on Overview, five on Sales, three on Products and four on Markets, each reading a pivot table you can inspect by scrolling right to column Z.
- A Holiday Season Share bar. It reads the November-December share of revenue (42.0% on the sample data) in the sidebar of every page.
- An Order Lookup page. Type an Order ID and the full order line is pulled from the Data tab with INDEX / MATCH, with Not found shown for a missing ID.
- 1,000-line capacity. The pivots read A1:P1001, so paste up to 1,000 orders over the sample rows without extending a range.
Dashboard Pages Explanation
The Toy & Games Industry Dashboard in Google Sheets ships six visible pages plus the Data tab that feeds them. Each page answers a different question and keeps its own slicer state.
Page 1: Overview — Revenue, Channels and the Holiday Peak
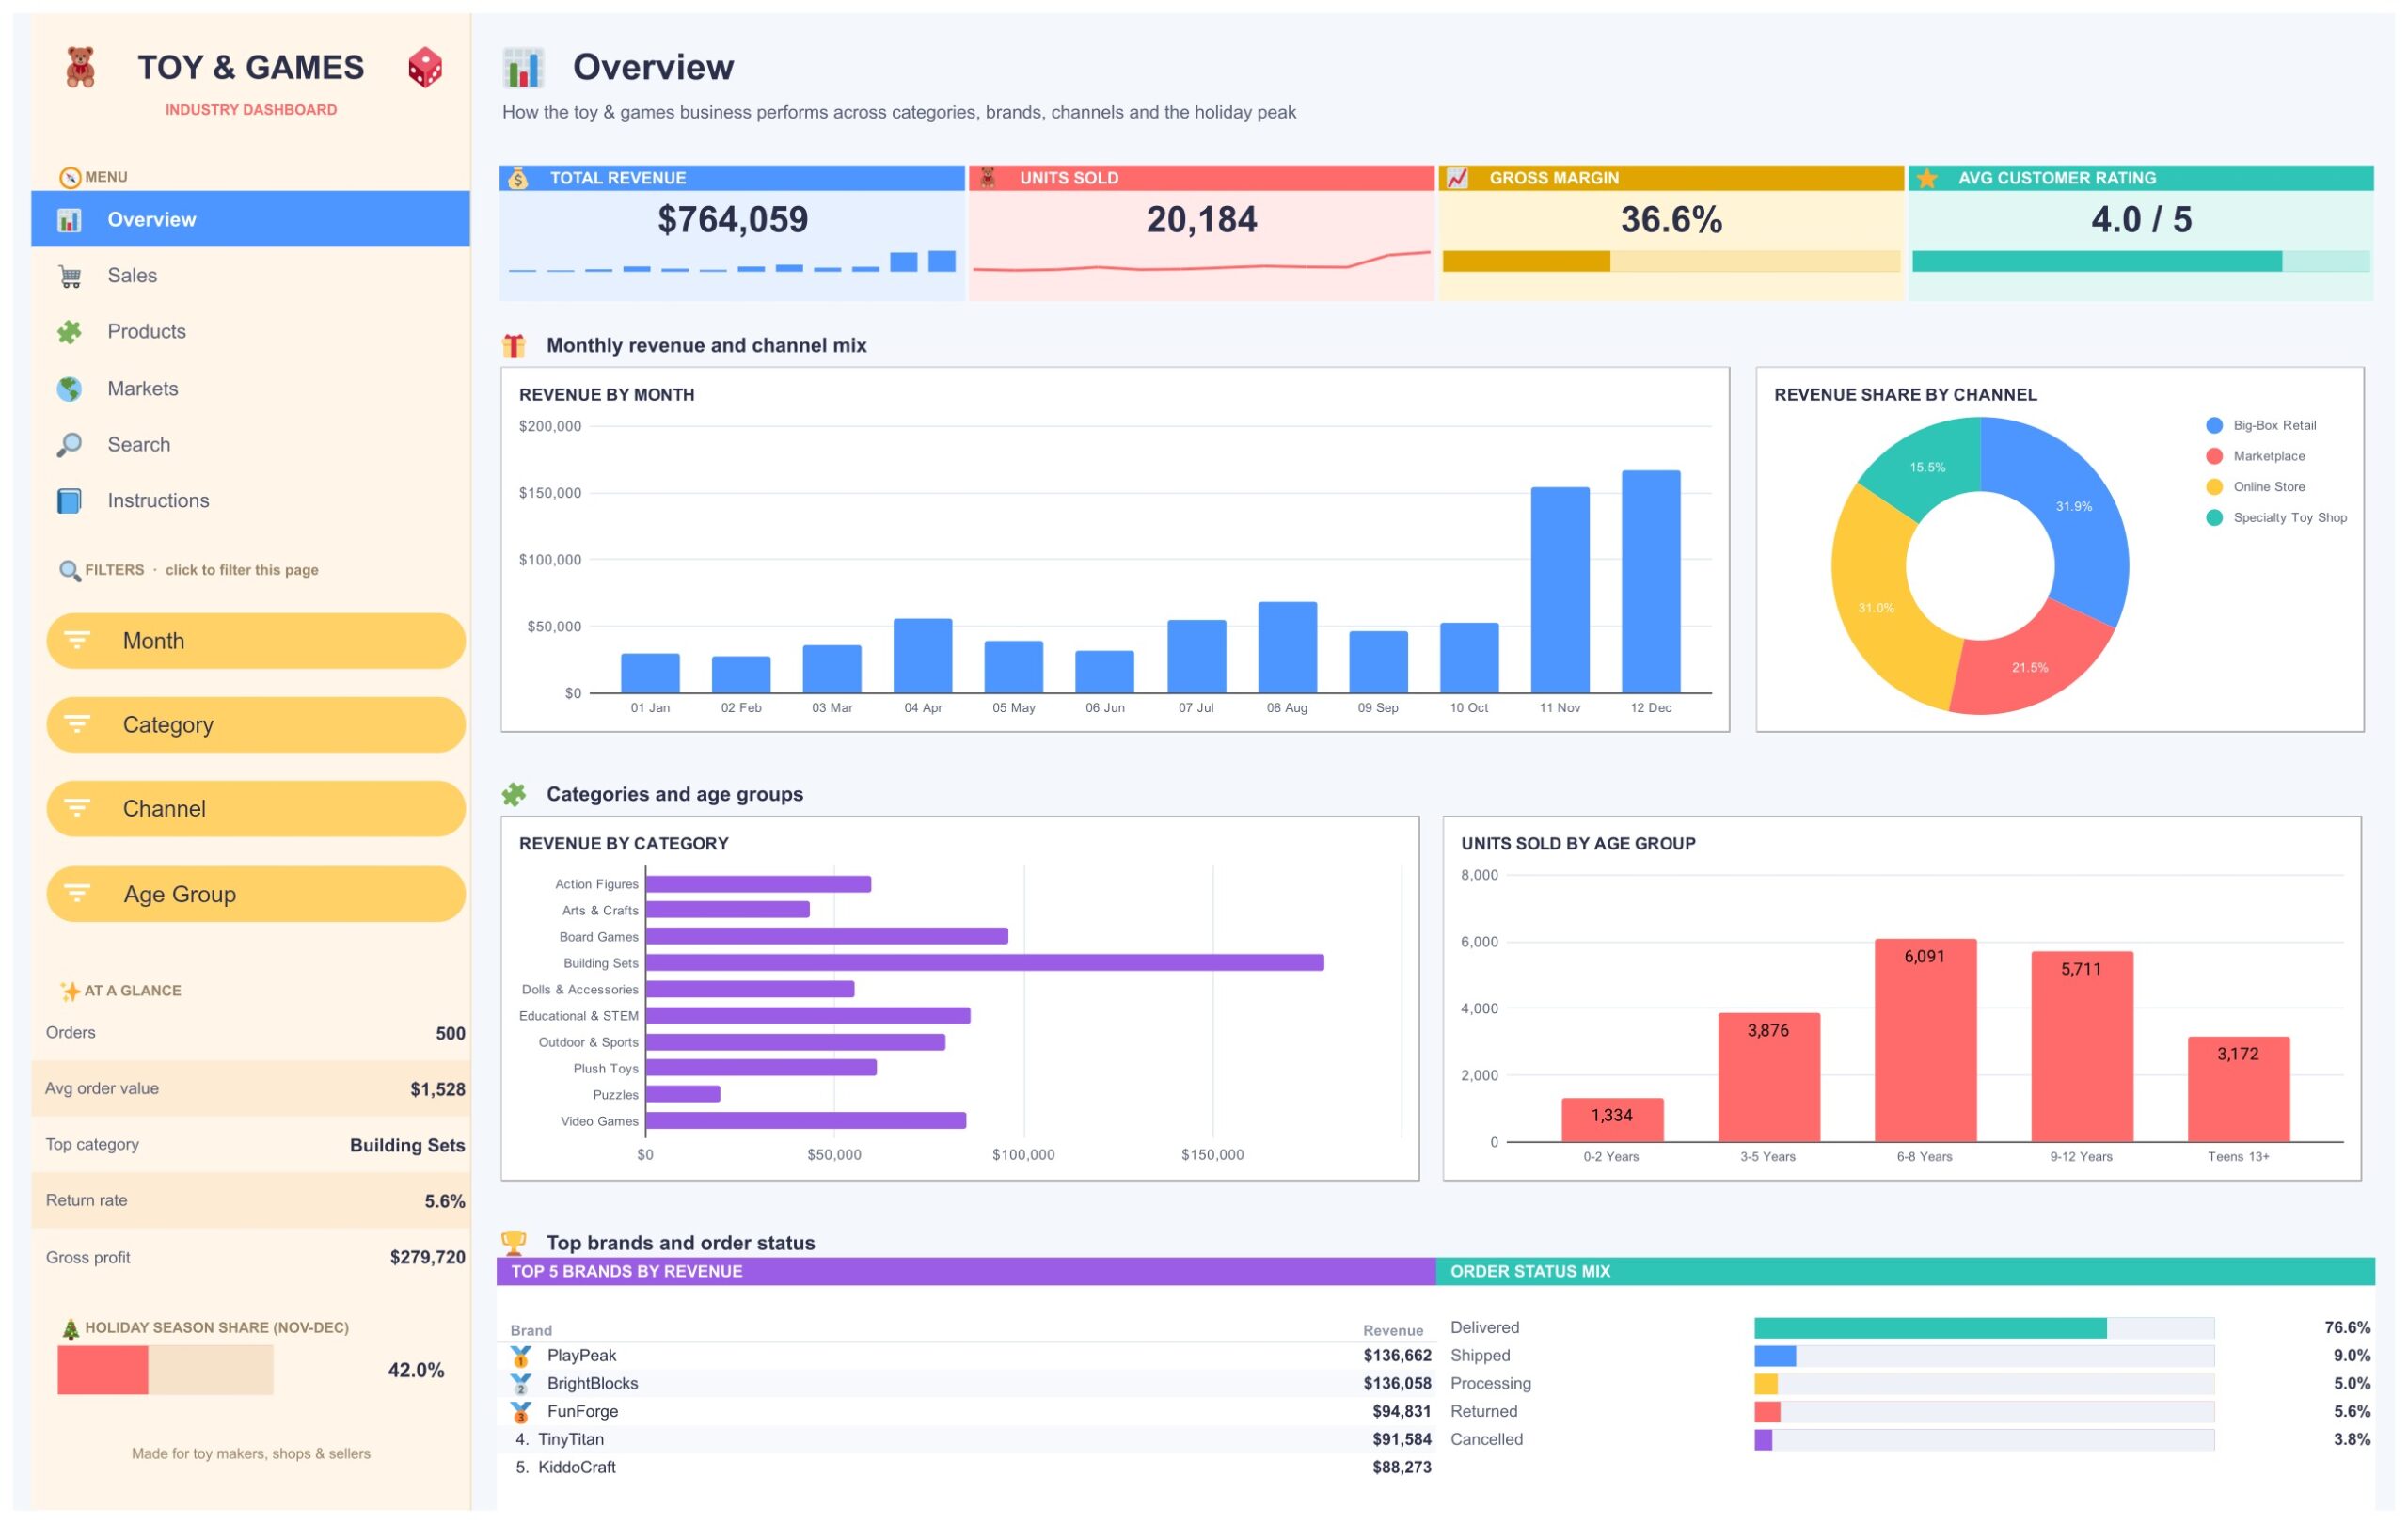
The landing tab reports all categories, brands and channels together. Four KPI cards show Total Revenue ($764,059 on the sample data), Units Sold (20,184), Gross Margin (36.6%) and Avg Customer Rating (4.0 / 5). The charts are Revenue by Month, Revenue Share by Channel, Revenue by Category and Units Sold by Age Group. The sidebar adds an At A Glance block (500 orders, $1,528 average order value, Building Sets as the top category, a 5.6% return rate and $279,720 gross profit), a Holiday Season Share bar for November and December reading 42.0%, a Top 5 Brands by Revenue table and an Order Status Mix.
Page 2: Sales — Seasonality, Promotions and Fulfilment
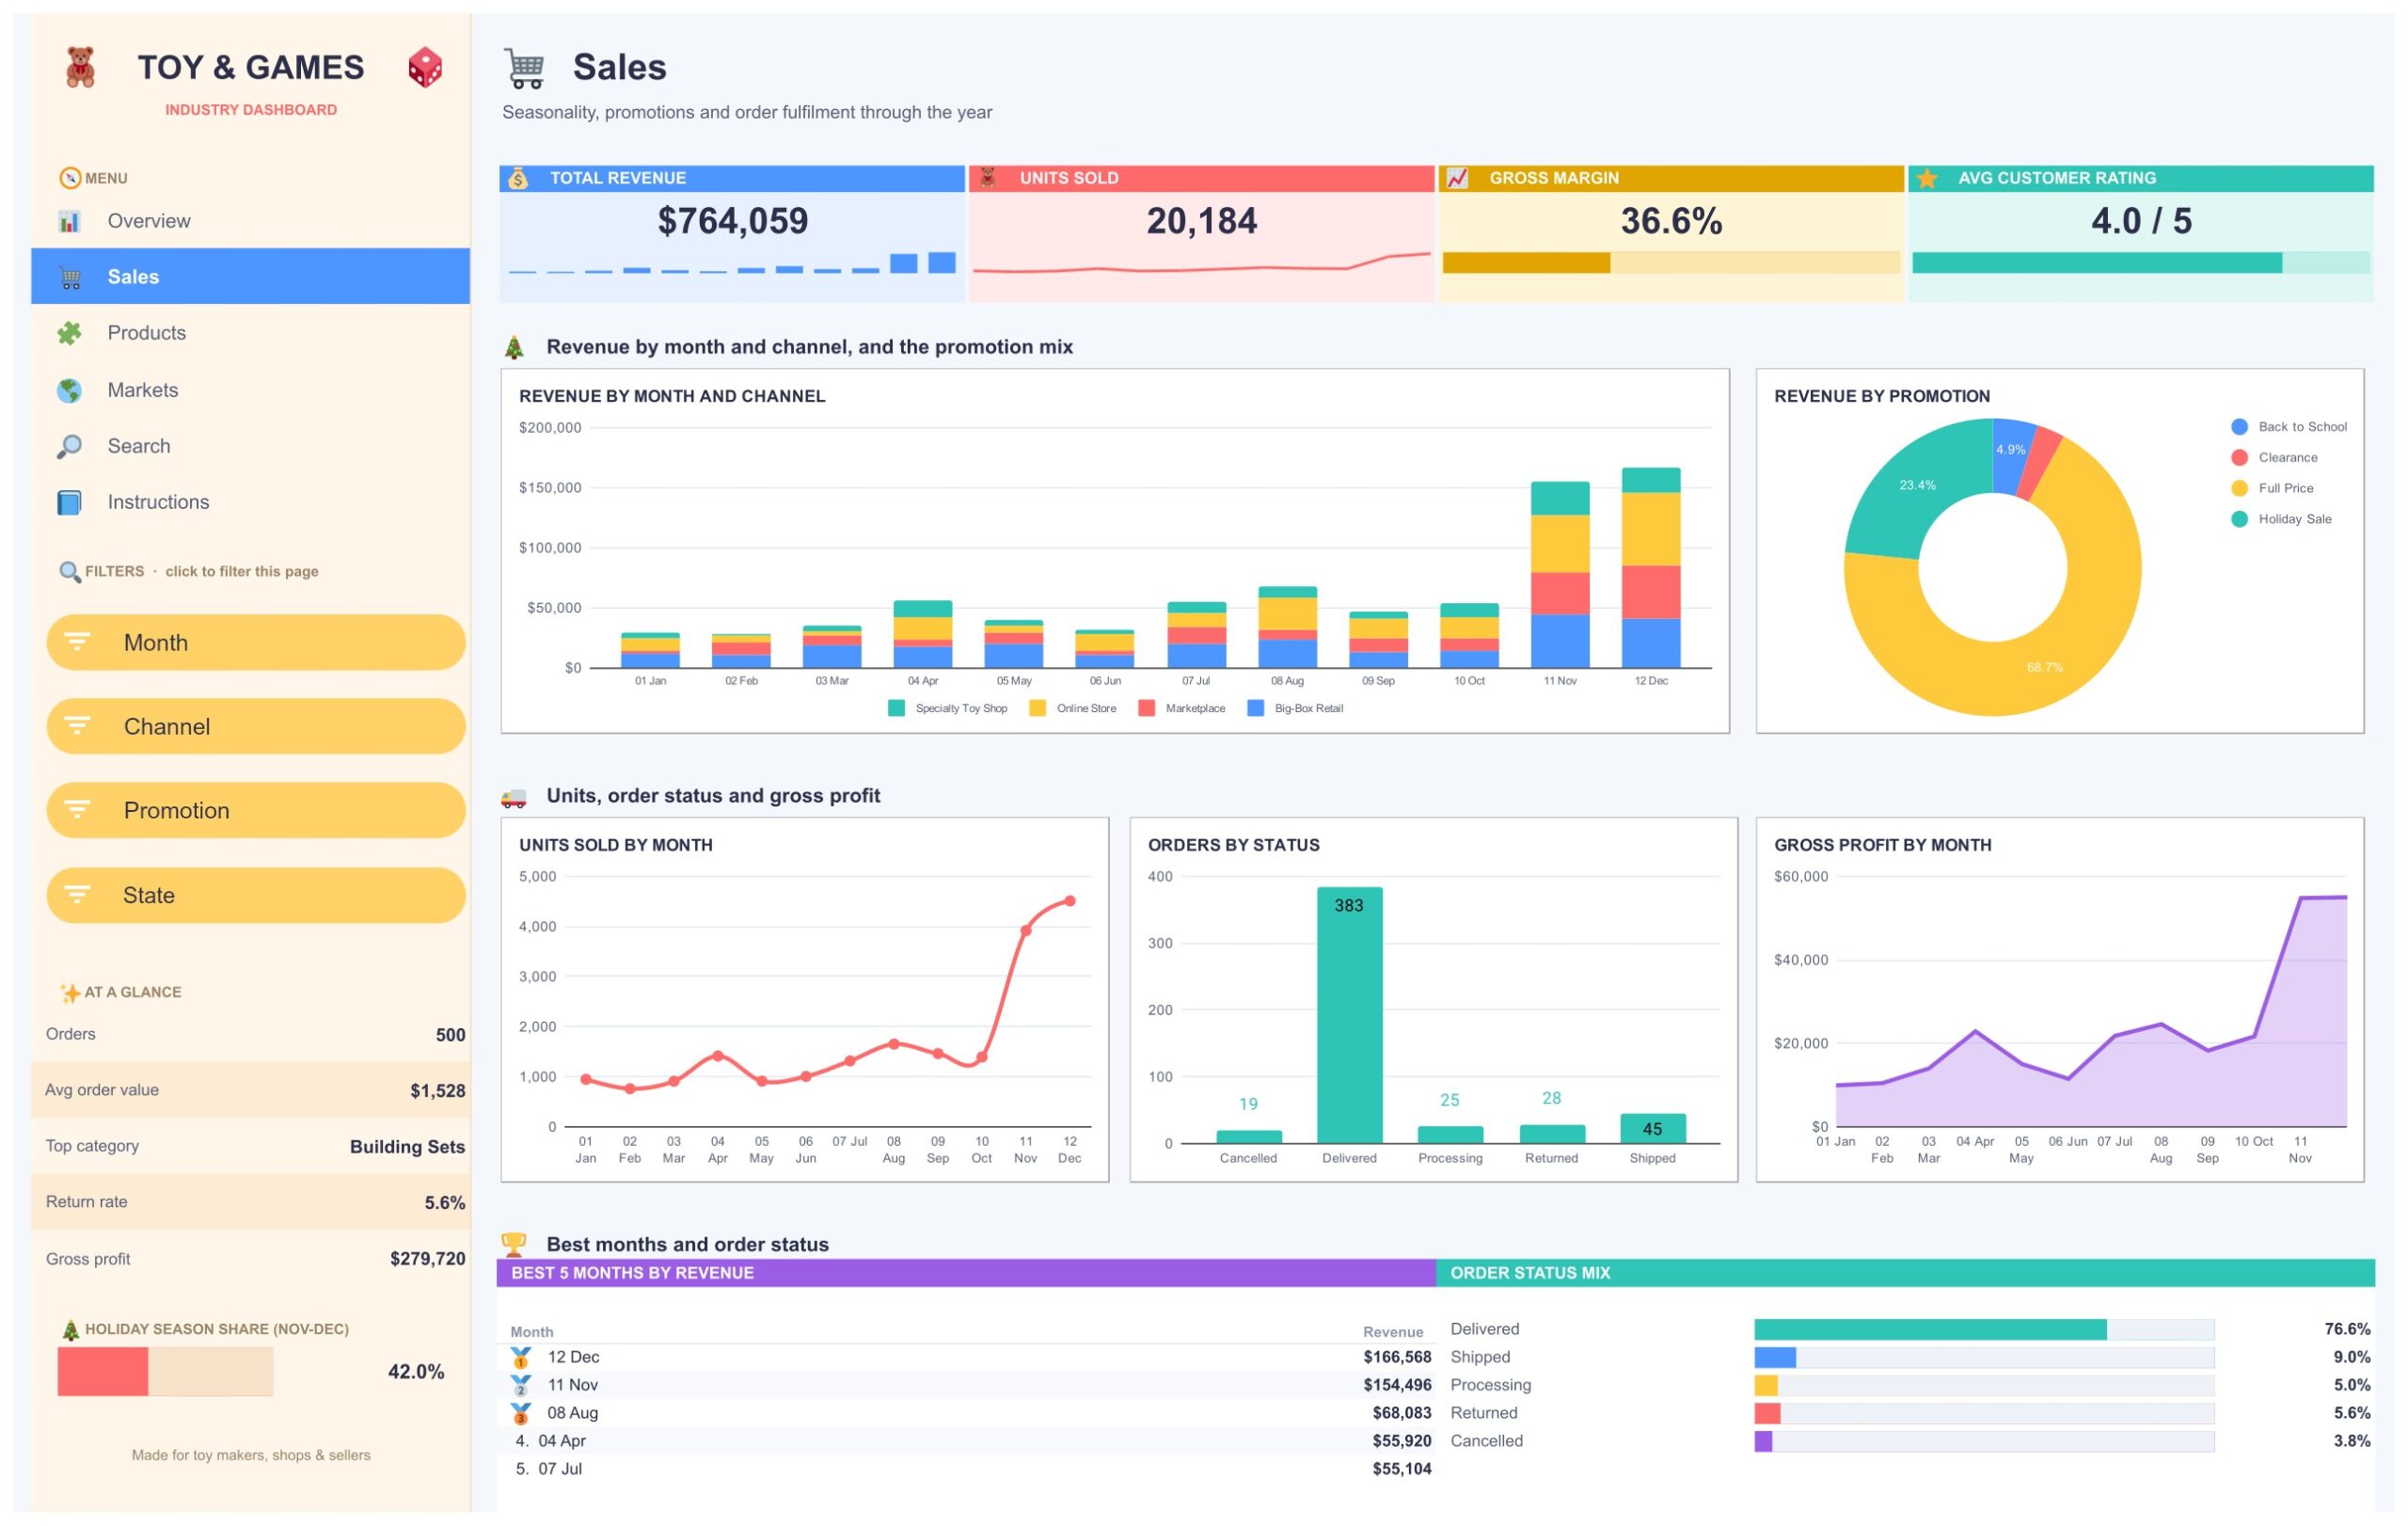
This tab is about seasonality, promotions and fulfilment. Charts are Revenue by Month and Channel, Revenue by Promotion (Full Price, Holiday Sale, Back to School and Clearance), Units Sold by Month, Orders by Status and Gross Profit by Month. A Best 5 Months by Revenue table puts December ($166,568) and November ($154,496) well ahead of the rest of the year, which is the holiday peak the sample data is built to show.
Page 3: Products — Brands, Categories and Ratings
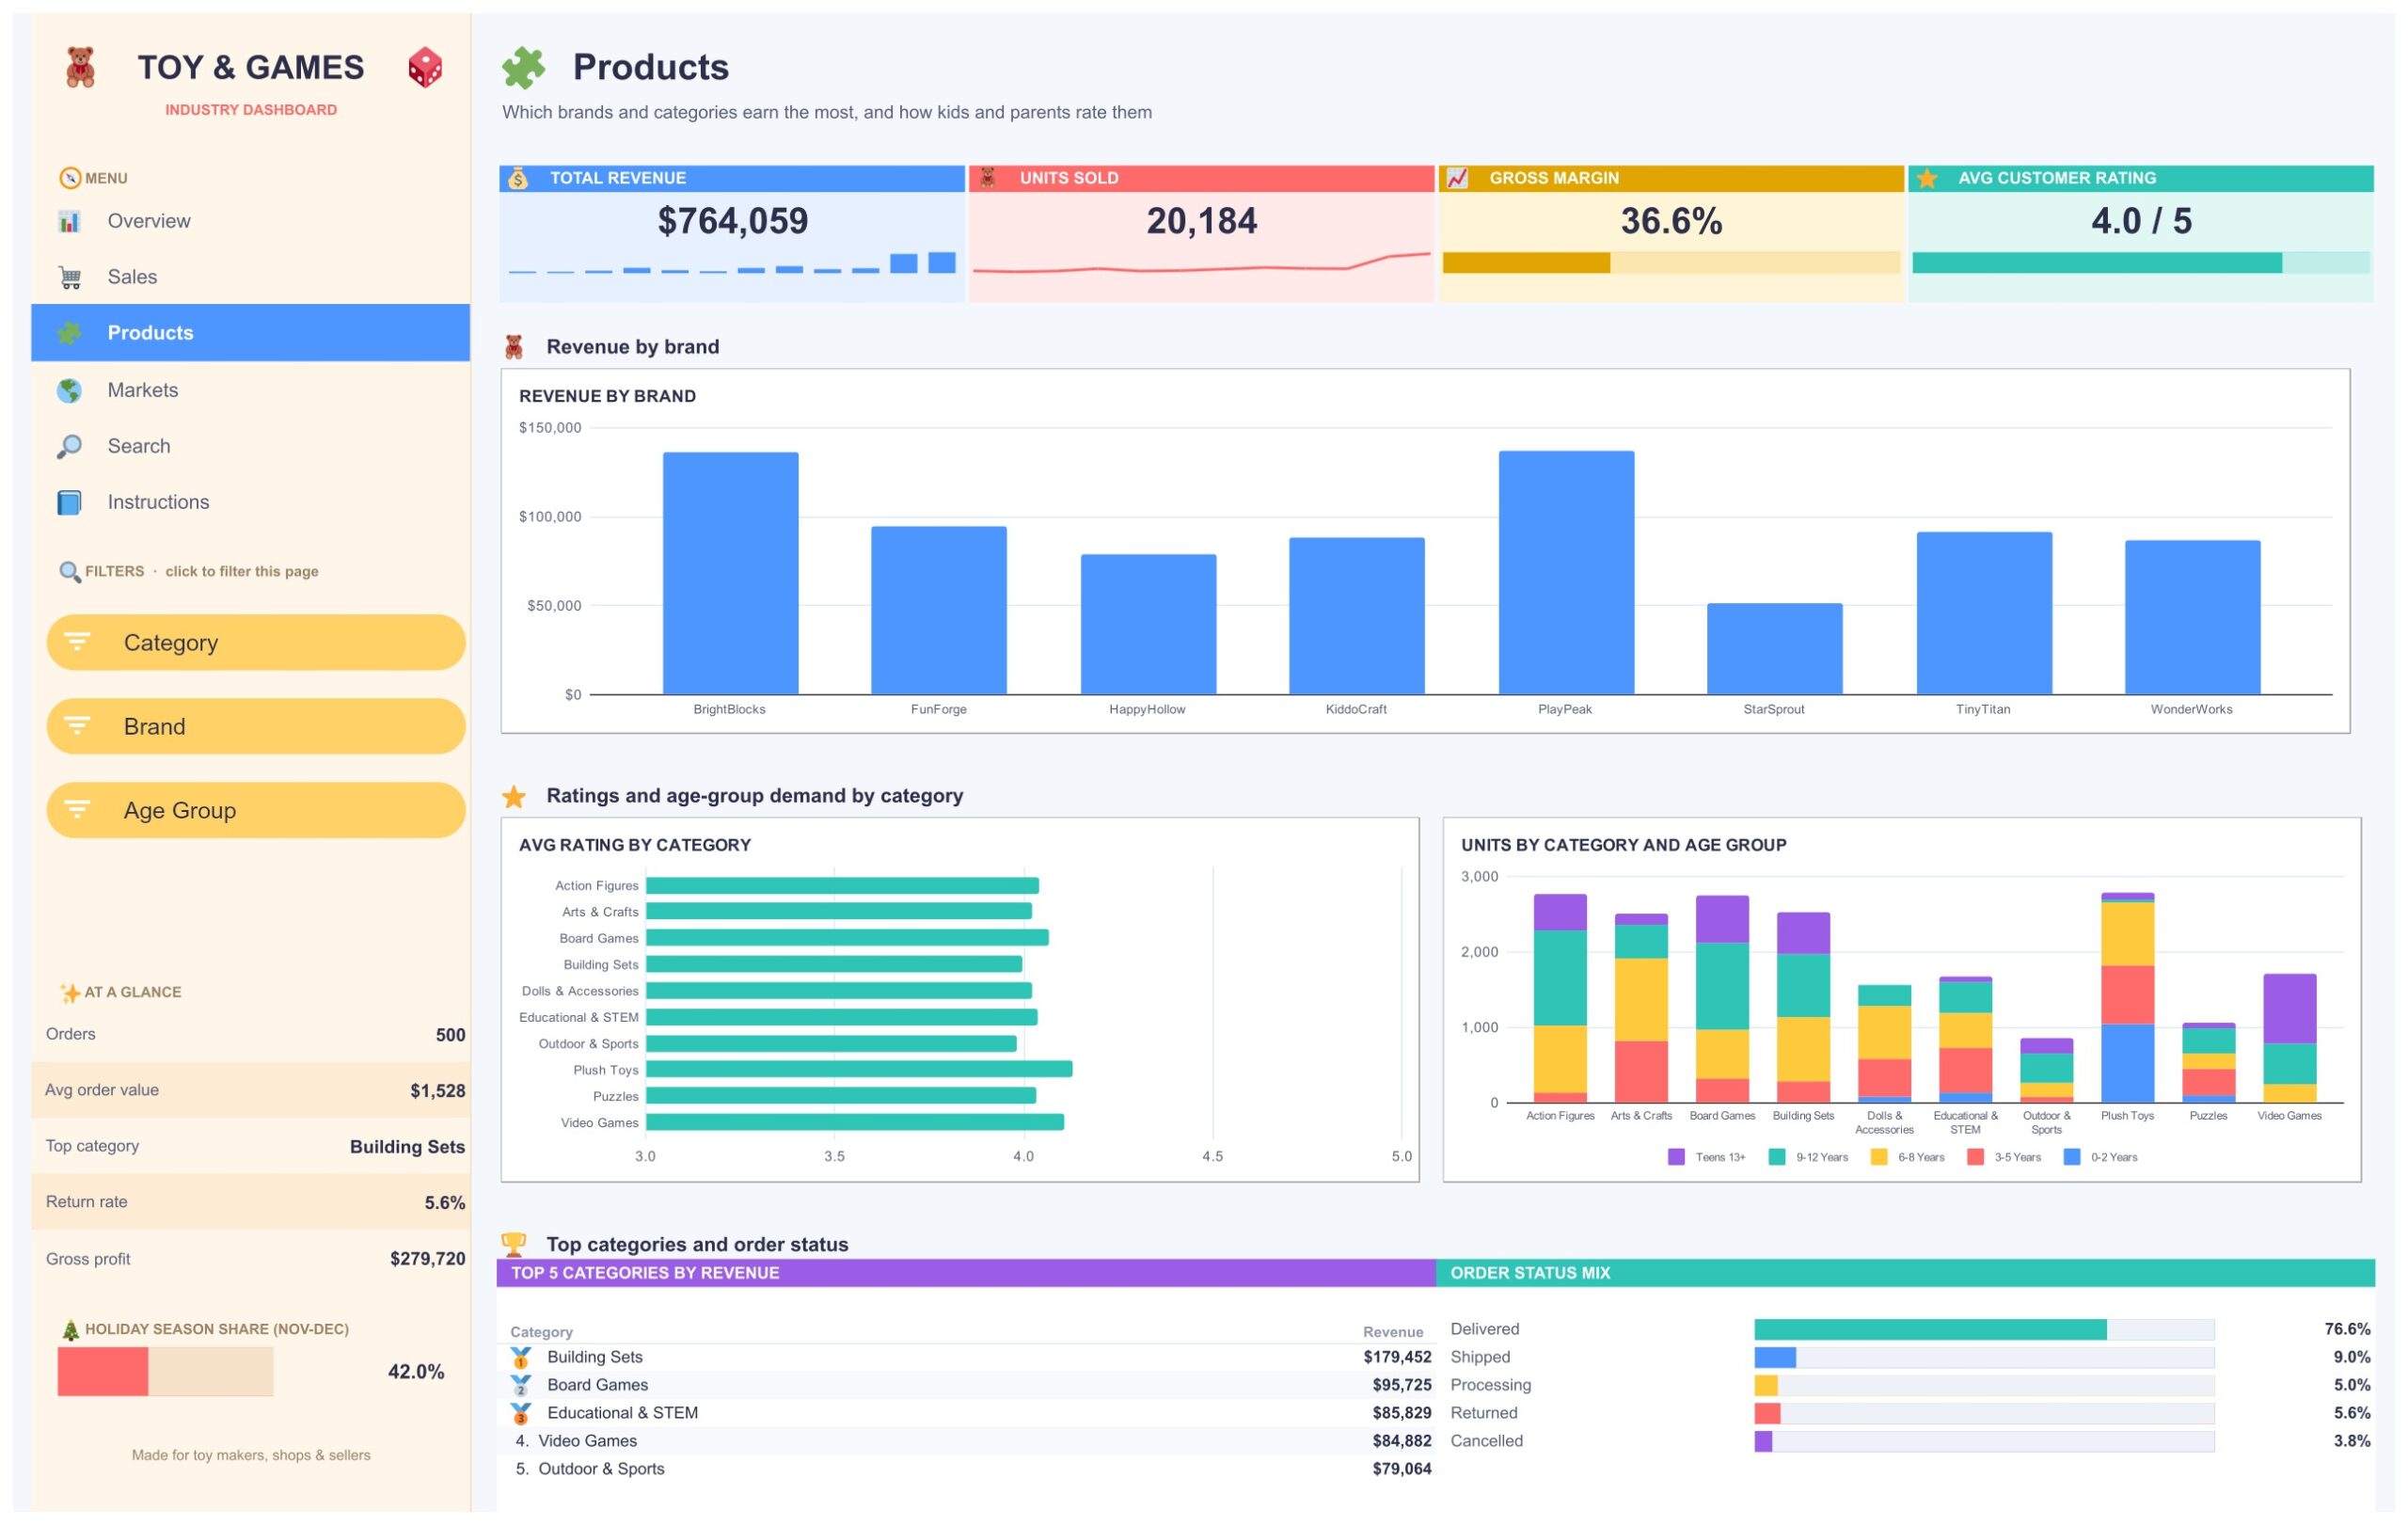
Eight brands and ten categories are compared here: BrightBlocks, FunForge, HappyHollow, KiddoCraft, PlayPeak, StarSprout, TinyTitan and WonderWorks across Action Figures, Arts & Crafts, Board Games, Building Sets, Dolls & Accessories, Educational & STEM, Outdoor & Sports, Plush Toys, Puzzles and Video Games. Charts are Revenue by Brand, Avg Rating by Category and Units by Category and Age Group, with a Top 5 Categories by Revenue table led by Building Sets at $179,452.
Page 4: Markets — States, Channels and Satisfaction
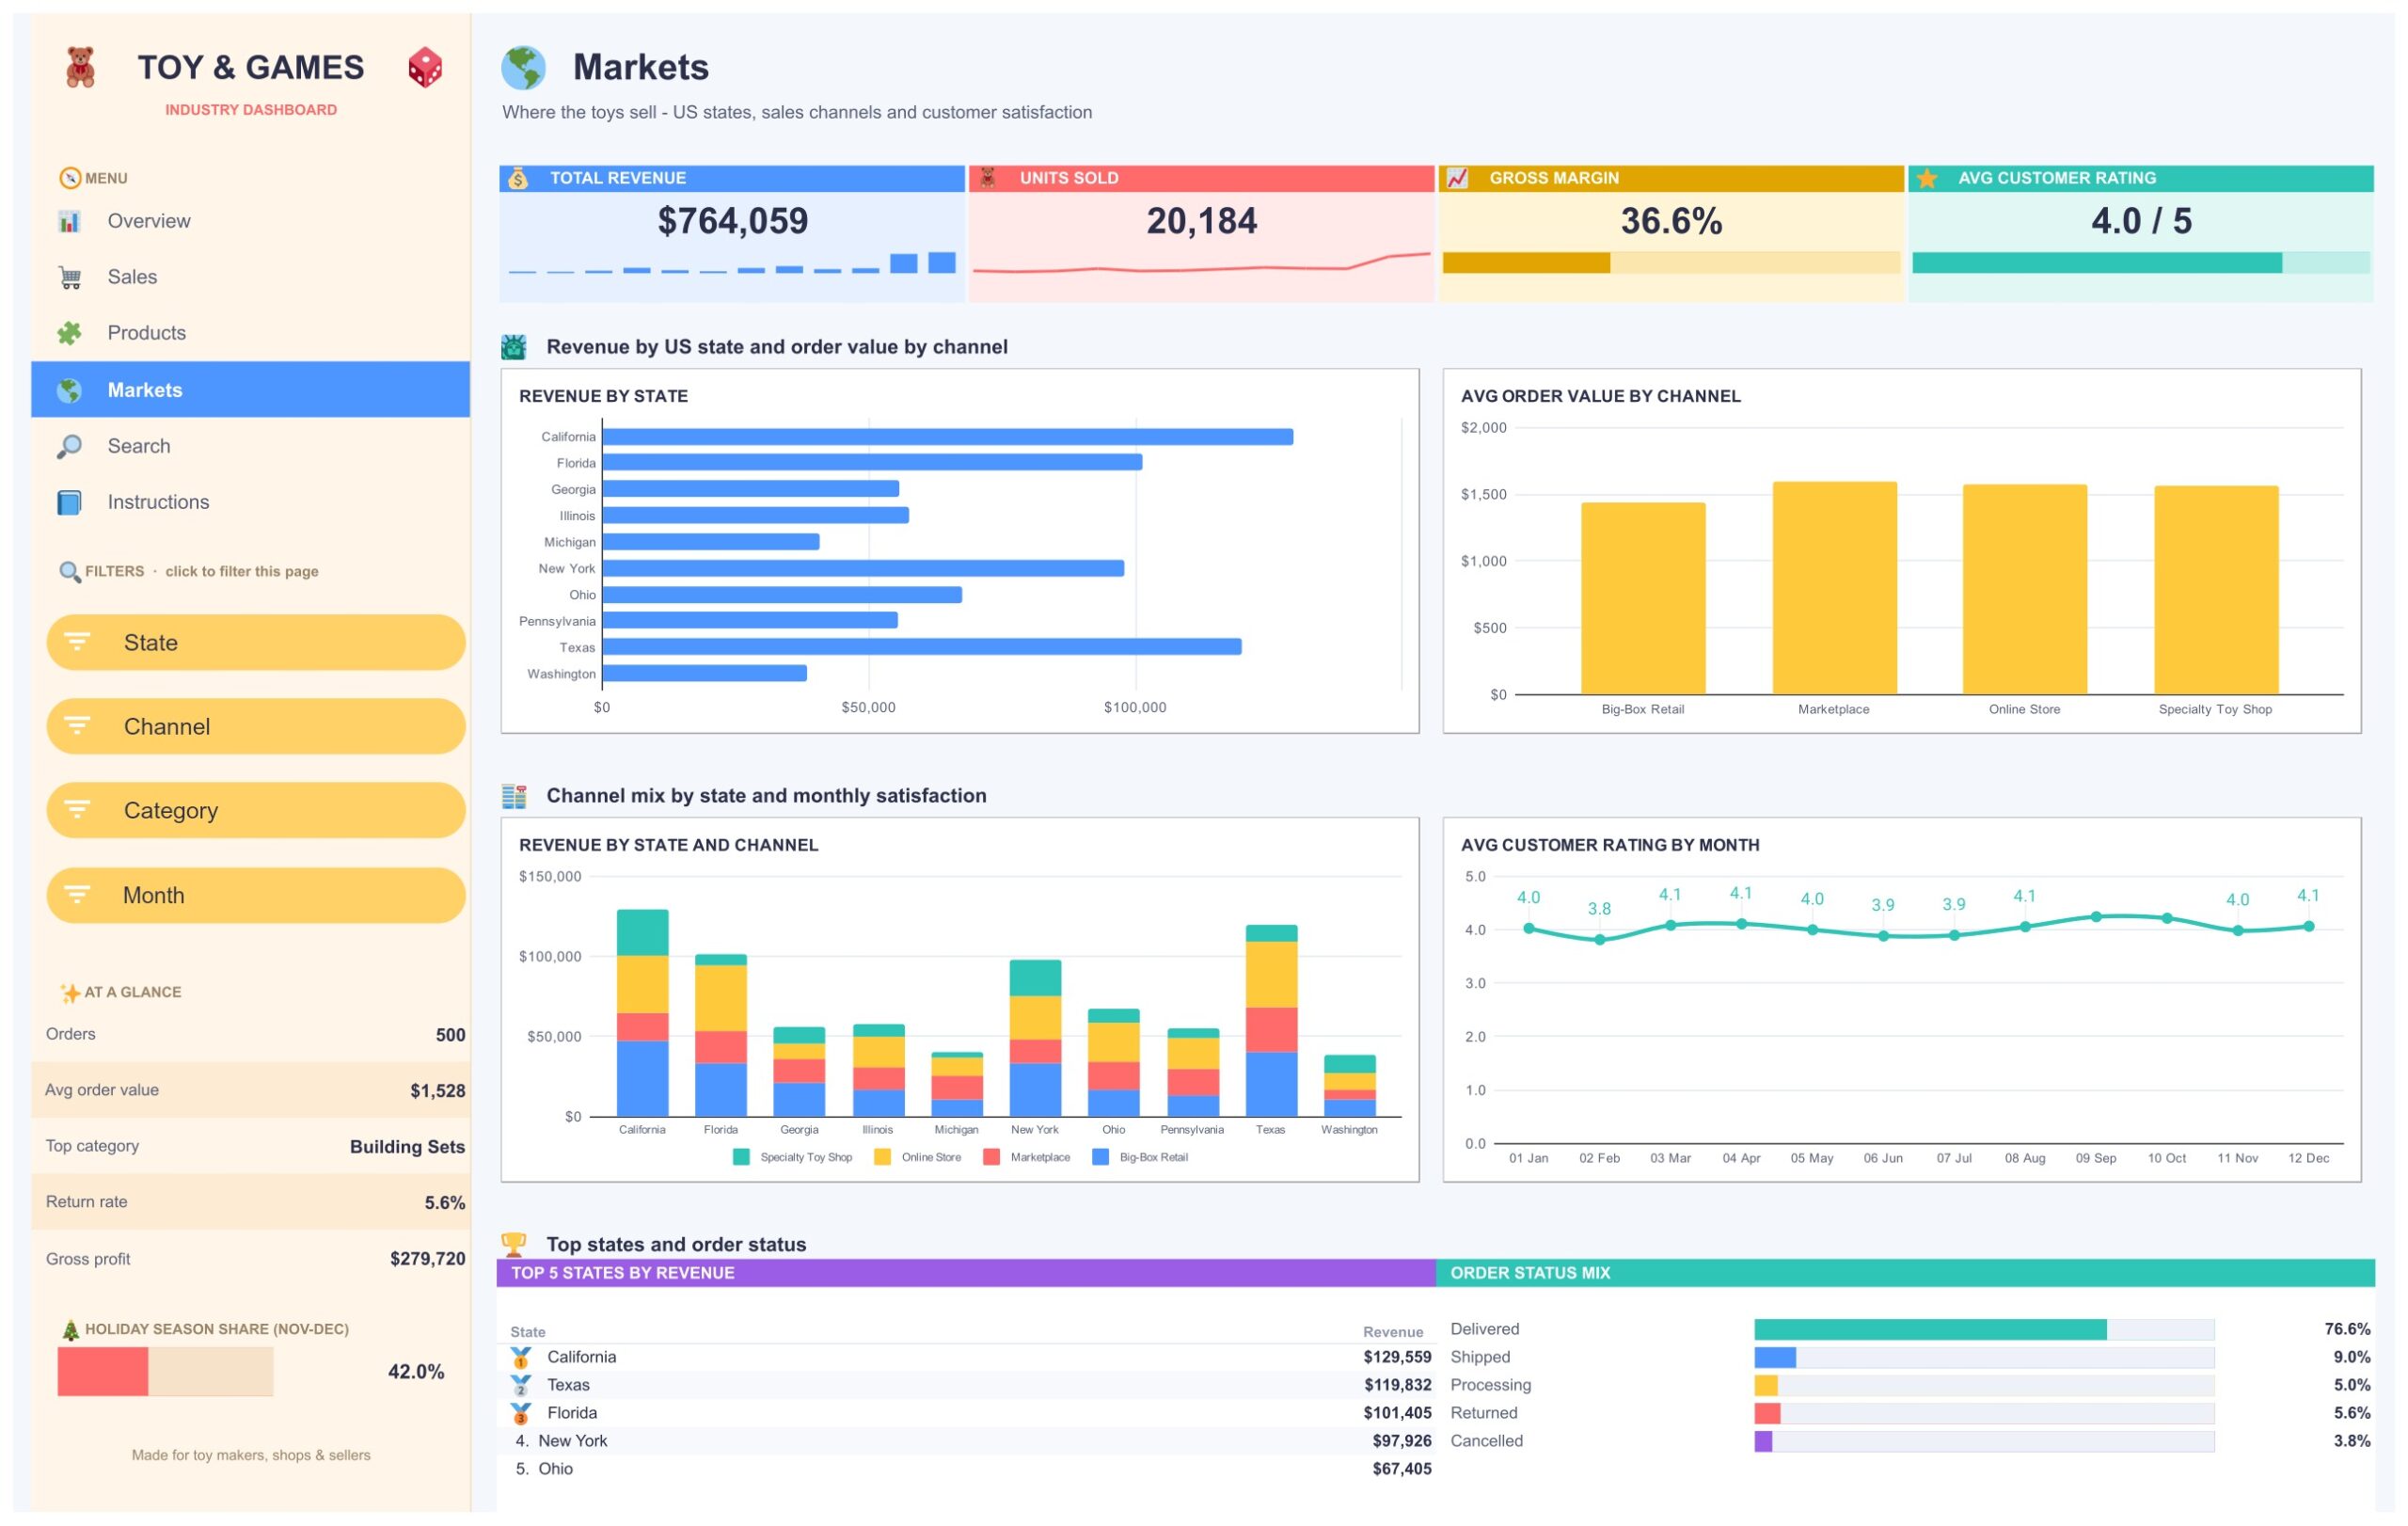
The Markets tab shows where the toys sell across ten US states and four channels: Big-Box Retail, Marketplace, Online Store and Specialty Toy Shop. Charts are Revenue by State, Avg Order Value by Channel, Revenue by State and Channel and Avg Customer Rating by Month. A Top 5 States by Revenue table lists California ($129,559), Texas ($119,832), Florida ($101,405), New York ($97,926) and Ohio ($67,405).
Page 5: Search — Order Lookup
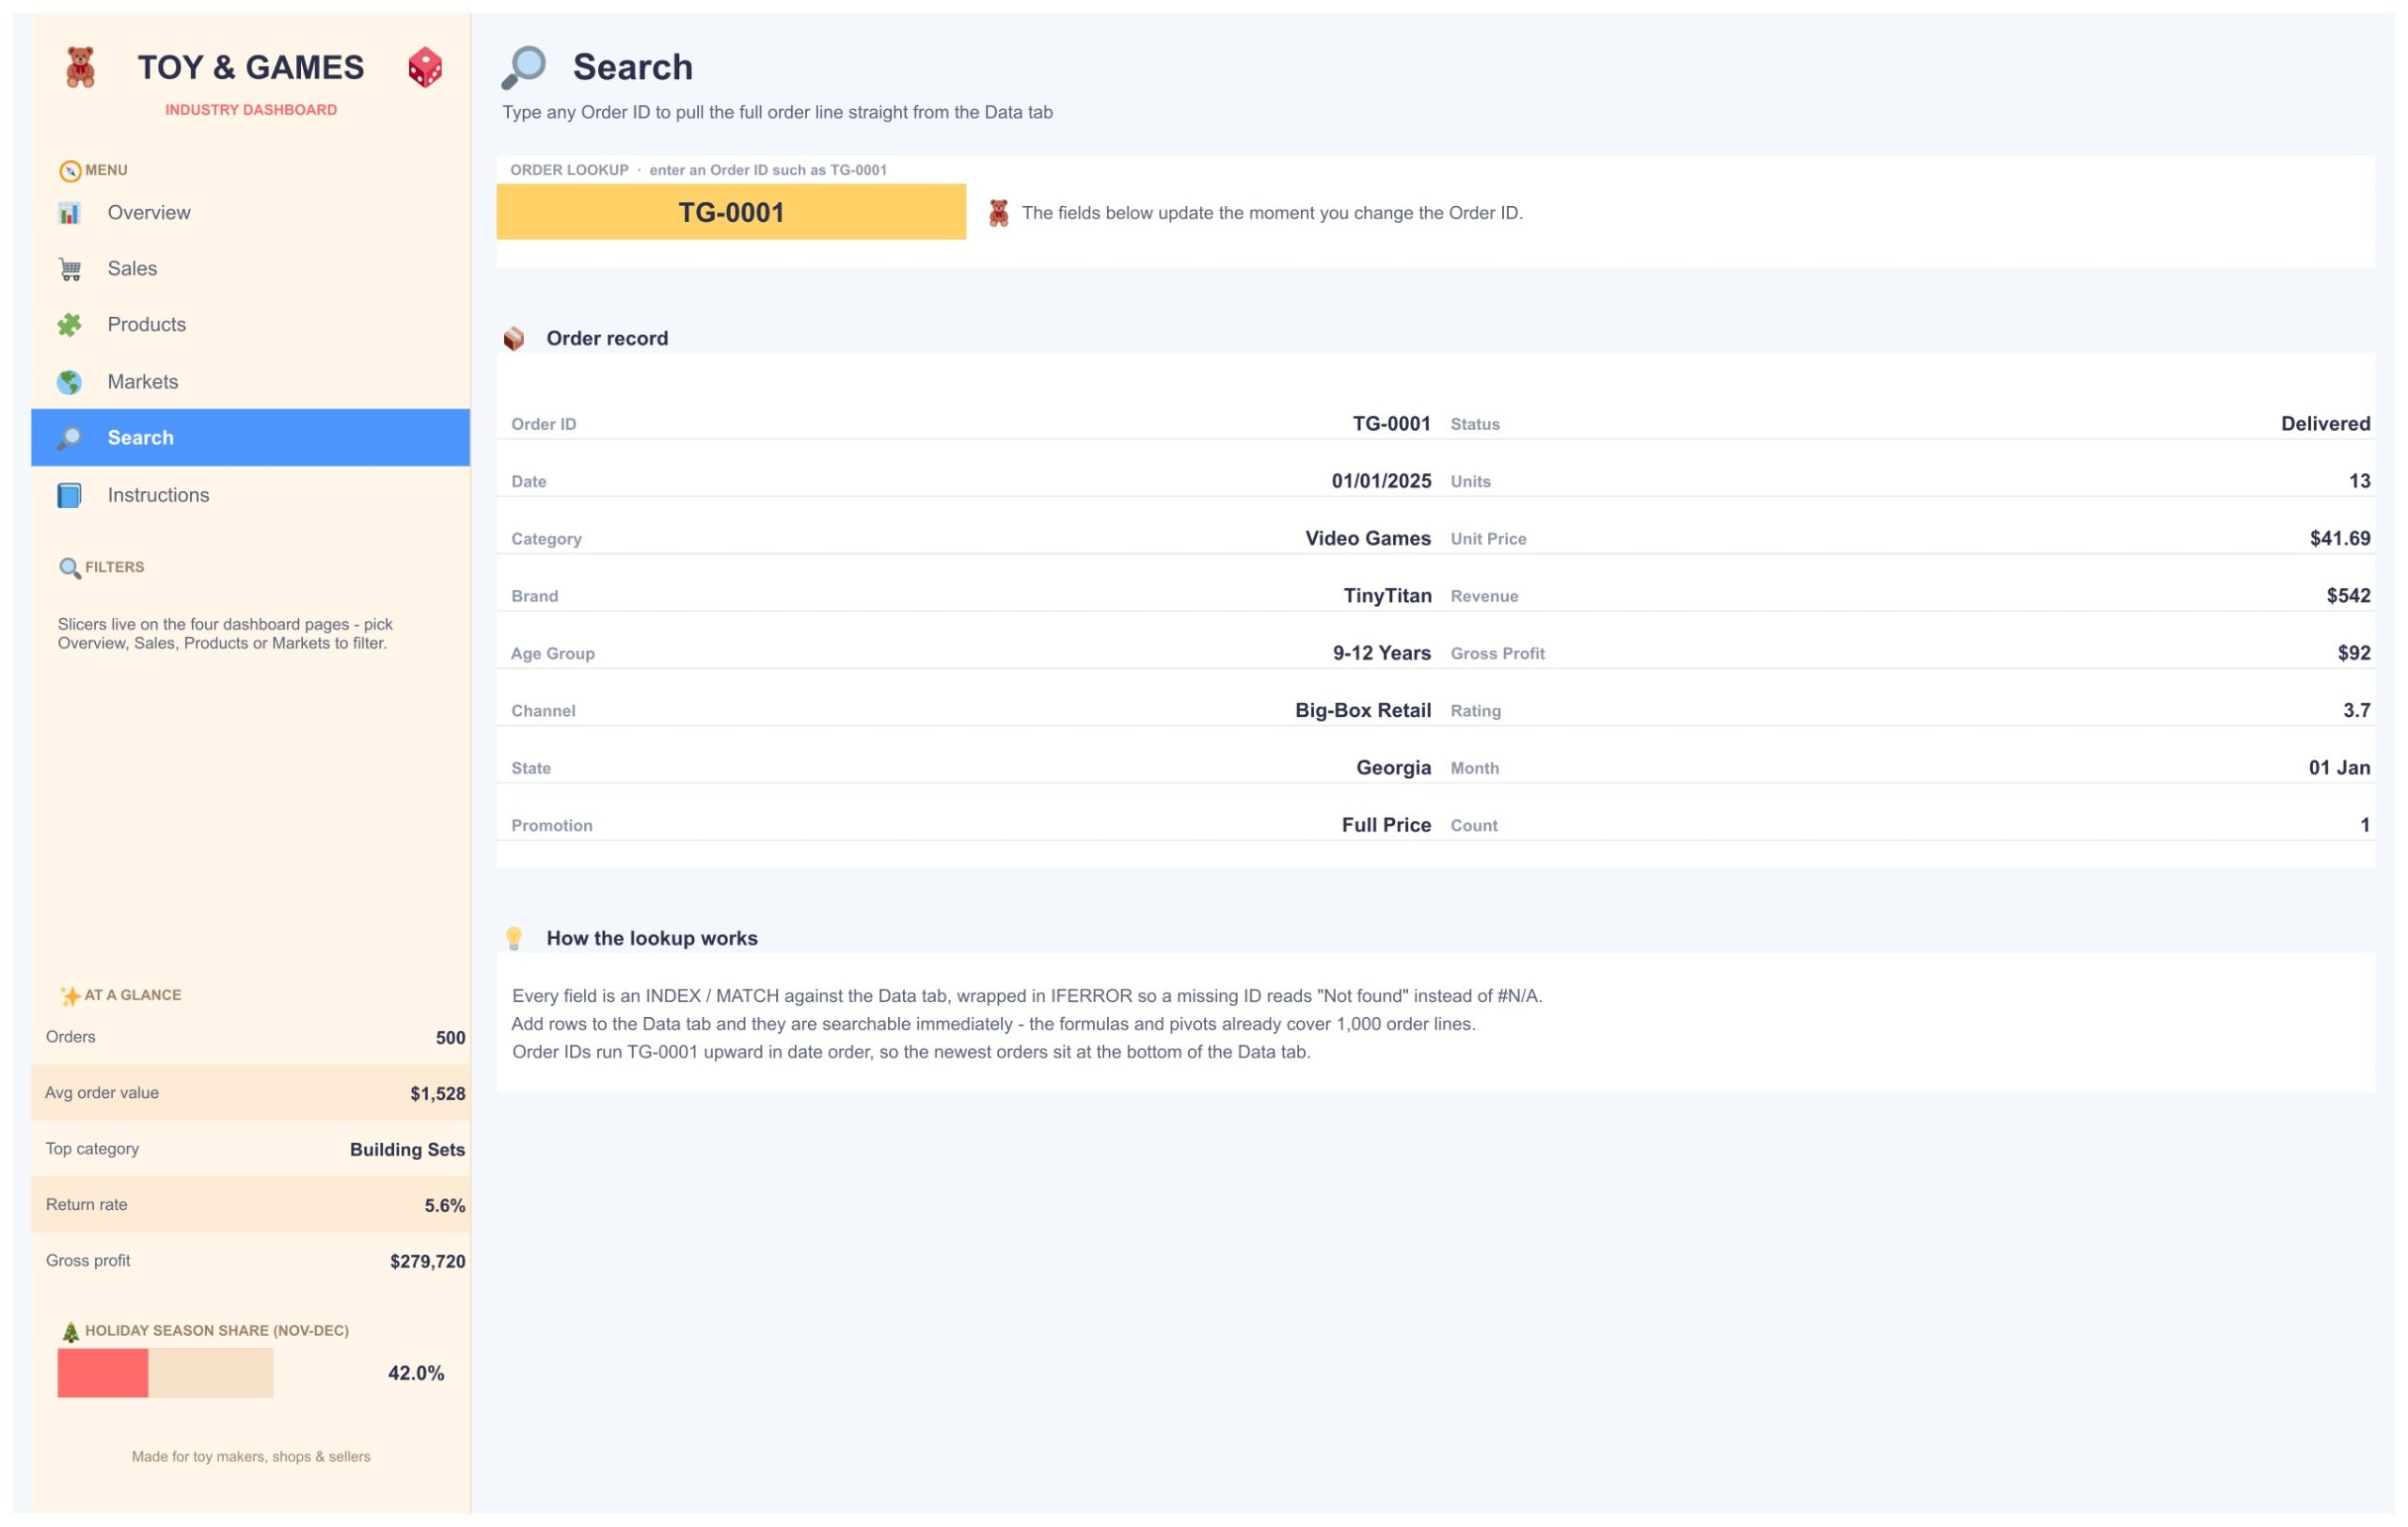
Type any Order ID, such as TG-0001, into the yellow input box and the page pulls the full order line from the Data tab: date, category, brand, age group, channel, state, promotion, status, units, unit price, revenue, gross profit and rating. Every field is an INDEX / MATCH wrapped in IFERROR, so a missing ID shows Not found instead of an error.
Page 6: Instructions — User Guide
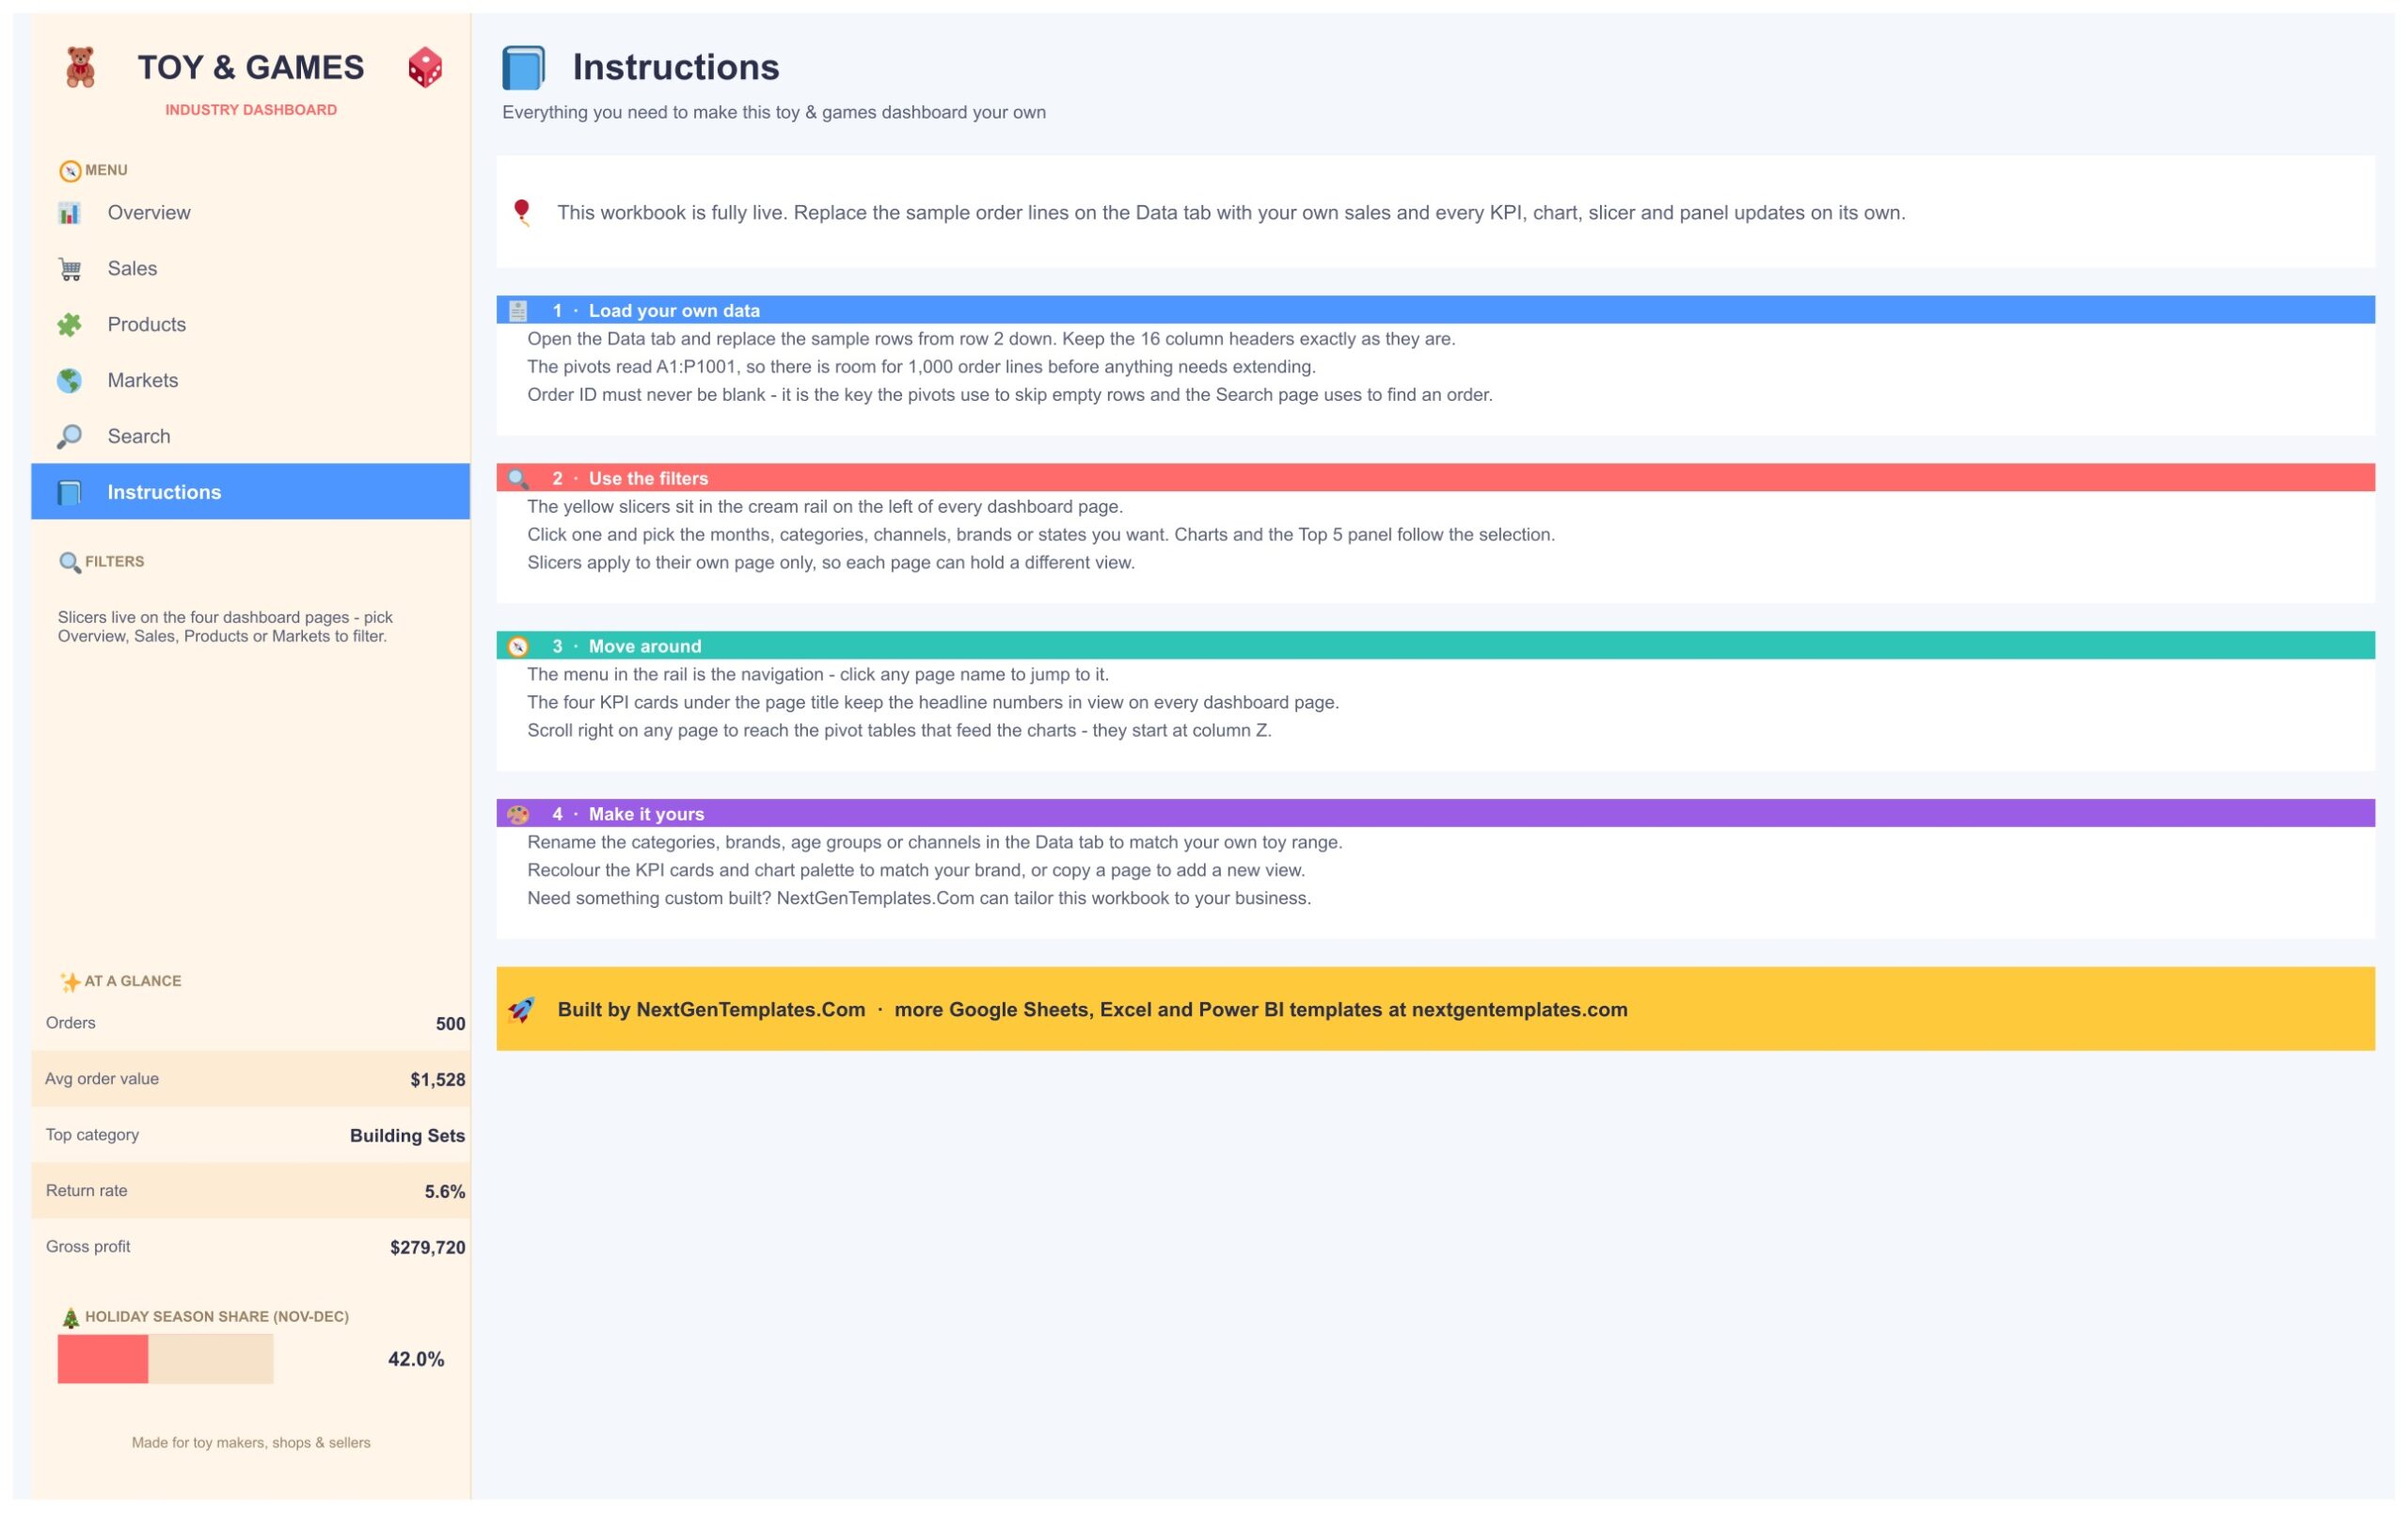
A four-step guide covers how to load your own data, use the slicers, move between pages with the rail menu, and make the workbook your own by renaming categories, brands, age groups and channels in the Data tab and recolouring the cards and charts.
The Data Tab
Behind the six visible pages sits the Data tab with the 500 sample orders and 16 columns. Keep the headers exactly as they are, replace the rows with your own export, and every pivot, slicer and chart keeps working. Google’s own documentation on creating and using pivot tables is worth a skim if you plan to add a pivot of your own.
Toy & Games Industry Dashboard vs. an Excel Dashboard vs. a Paid BI Suite — Feature Comparison
| Feature | Toy & Games Industry Dashboard (Google Sheets) | Microsoft Excel dashboard | Paid BI suite (Tableau, Domo) |
|---|---|---|---|
| Cost | One-time purchase ✅ | One-time purchase plus Microsoft 365 | Per-user monthly subscription |
| Platform | Any browser, nothing to install ✅ | Desktop Excel | Browser plus a data pipeline |
| Setup | Paste your orders and go ✅ | Build or adapt the dashboard first | Connectors and data modelling first |
| Real-time team collaboration | Built in ✅ | Only via OneDrive co-authoring | Yes, on paid seats |
| Mobile access | Google Sheets app ✅ | Limited on mobile Excel | Yes, on paid seats |
| Customisable fields | Rename any category, brand or channel ✅ | Yes | Admin-controlled schema |
| Share with a link | Yes, view or edit ✅ | File attachment or OneDrive link | A seat is required to view |
| Order-level lookup | Search page, type an Order ID ✅ | Needs a lookup formula | Yes, via a detail view |
For a toy maker, shop or seller who wants a toy store sales dashboard Google Sheets can run without paying per seat every month, this template sits in the sweet spot.
Who Should Use This Template
Perfect for:
- Toy and game shop owners and managers who already keep an order log in a spreadsheet
- Toy brands and distributors comparing categories, brands and age groups
- Online and marketplace sellers comparing channels side by side
- Buyers and planners who need to see the holiday peak coming
- Analysts and consultants who want a finished layout to drop a client’s export into
Not a fit if:
- You need a live POS, ERP or e-commerce connection — this template reads a Data tab you paste into, and ships with sample data only
- You need stock control or reorder alerts — it reports sales, not inventory
- Your order log runs far past 1,000 lines and you would rather not extend the pivot ranges yourself
- You need row-level security, SSO or an audited warehouse behind the numbers
Real-World Use Cases
A specialty toy shop owner pastes a monthly export over the Data tab and opens the Sales page to see how much of the year lands in November and December. December ($166,568) and November ($154,496) dominate the sample data, which is the pattern a holiday-driven shop needs to plan stock and staffing around.
A toy brand’s sales manager lives on the Products page, comparing brands and categories, then filters by Age Group to see which age bands drive units and which categories earn the best ratings.
An e-commerce consultant keeps one copy of the template per client, drops their export in and walks into the review with four pages of analysis instead of rebuilding pivots each time. Because it is a Google Sheet, a view-only link replaces an emailed workbook.
Advantages of the Toy & Games Industry Dashboard in Google Sheets
The obvious win is cost: a per-seat BI subscription adds up month after month, while this is a one-time purchase that opens in a browser the same afternoon.
The less obvious win is the architecture. Every chart reads a real pivot table, so you can scroll right to column Z and check the exact numbers a chart is drawing. That makes the workbook auditable, and adding your own pivot alongside the shipped ones does not risk breaking anything upstream.
Collaboration is the third. A Google Sheet is shareable by link, editable by several people at once and readable on a phone, so an owner, a buyer and an accountant can look at the same pages without mailing a file around.
Opportunities for Improvement
Three things are worth knowing before you buy. First, there is no live connection: the template holds sample data only, so you paste or import your own export. A nightly sync from a point-of-sale system would need to be added yourself, most likely with Apps Script.
Second, the 1,000-line capacity is generous for a single shop but modest for a brand logging thousands of orders a month. Going beyond it means extending the pivot sources by hand.
Third, it is a sales dashboard, not an inventory system. It does not track stock levels or reorder points.
Best Practices
- Keep the 16 Data tab column headers untouched. The pivots, slicers, cards and charts are all keyed to them.
- Never leave Order ID blank. It is the key the pivots use to skip empty rows and the Search page uses to find an order.
- Clear a slicer with Select all rather than unticking values one by one, and remember slicers are per page.
- Scroll right to column Z whenever a chart looks wrong. The pivot behind it will tell you whether the problem is the data or the visual.
- Take a fresh copy of the template for each client or trading year rather than growing one file indefinitely.
- Comfortable with lookups? The techniques in XLOOKUP in Google Sheets pair well with the Search page.
Explore Relevant Templates
If this build suits you, the same slicer-driven approach turns up in other retail dashboards in the range, and this google sheets sales dashboard template is a good place to start:
- Electronics Retail Dashboard in Google Sheets — the same pivot-and-slicer build for a consumer electronics shop.
- Supermarkets Dashboard in Google Sheets — the same approach applied to grocery retail.
- Inventory Tracker in Google Sheets — pair it with this dashboard to watch stock as well as sell-through.
- Furniture Retail Dashboard in Google Sheets — category, brand and channel analysis for another retail line.
Want to build dashboards like this yourself? The Excel Pivot Tables & Dashboards course on NextGenTemplates Academy teaches the pivot-and-chart approach with practice files.
Get the Toy & Games Industry Dashboard in Google Sheets
Frequently Asked Questions
What does the Toy & Games Industry Dashboard in Google Sheets track?
It tracks revenue, units, gross margin, gross profit, customer rating, order status and holiday-season share across 10 categories, 8 brands, 5 age groups, 4 channels, 4 promotions and 10 US states, on 500 sample orders you replace with your own.
How long does setup take?
Open the PDF in your download, click Make a copy, then paste your order rows over the sample data on the Data tab. The pivots read A1:P1001, so nothing needs re-ranging for up to 1,000 order lines.
Does it connect to a POS or e-commerce platform?
No. It is a reporting template with sample data only, with no POS, ERP or e-commerce connection. You paste or import your own export into the Data tab.
Are the sample brands and figures real?
No. Every brand, order and figure on the sample Data tab is fictional.
Can I use it on my phone?
Yes, it runs in the Google Sheets mobile app like any other sheet, though the layout is far easier to read on a tablet or desktop screen.
Is it an inventory system?
No. It reports sales, products and markets. It does not track stock levels or reorder points.
About the Author
Built by PK — Microsoft Certified Professional with 15+ years of Excel, Google Sheets and Power BI experience. Founder of NextGenTemplates, reaching 300K+ subscribers across YouTube channels. Every template is hand-built and tested before release.
Conclusion
If your order data already exists and the only thing missing is a view of it, the Toy & Games Industry Dashboard in Google Sheets closes that gap in an afternoon: six pages, four KPI cards, fifteen slicers and sixteen charts, plus a Search page for single-order questions. As a toy sales dashboard Google Sheets owners can share by link, it needs nothing installed.
✅ Instant download · One-time payment · No subscription
Watch the Toy & Games Industry Dashboard in Google Sheets walkthrough
Last updated: October 2026