Construction projects involve multiple moving parts — budgets, timelines, safety, and workforce management. To keep operations organized and on track, a centralized monitoring system is essential. The Construction Project Management Dashboard in Google Sheets is a ready-to-use analytical tool that provides an all-in-one overview of your project’s financial, operational, and safety performance.Construction Project Management Dashboard in Google Sheets
Built entirely in Google Sheets, this dashboard helps project managers, contractors, and executives make informed decisions using data-driven insights — without needing any specialized software.Construction Project Management Dashboard in Google Sheets
What Is a Construction Project Management Dashboard in Google Sheets?
A Construction Project Management Dashboard is a real-time monitoring system that tracks the key performance indicators (KPIs) across different construction projects.Construction Project Management Dashboard in Google Sheets
It helps teams to:
-
Track project progress by region, type, or phase.
-
Compare budget vs actual cost performance.
-
Monitor safety incidents across sites.
-
Identify financial and operational inefficiencies early.
Since it’s built in Google Sheets, it offers collaborative accessibility, automation, and simple customization — making it ideal for project managers and business owners.Construction Project Management Dashboard in Google Sheets
Dashboard Structure Overview
Click to Buy Construction Project Management Dashboard in Google Sheets
The Construction Project Management Dashboard in Google Sheets includes the following sheet tabs:Construction Project Management Dashboard in Google Sheets
Dashboard Sheet Tab (Main Overview)
Search Sheet Tab
Data Sheet Tab
Support Sheet Tab
Let’s explore each in detail.
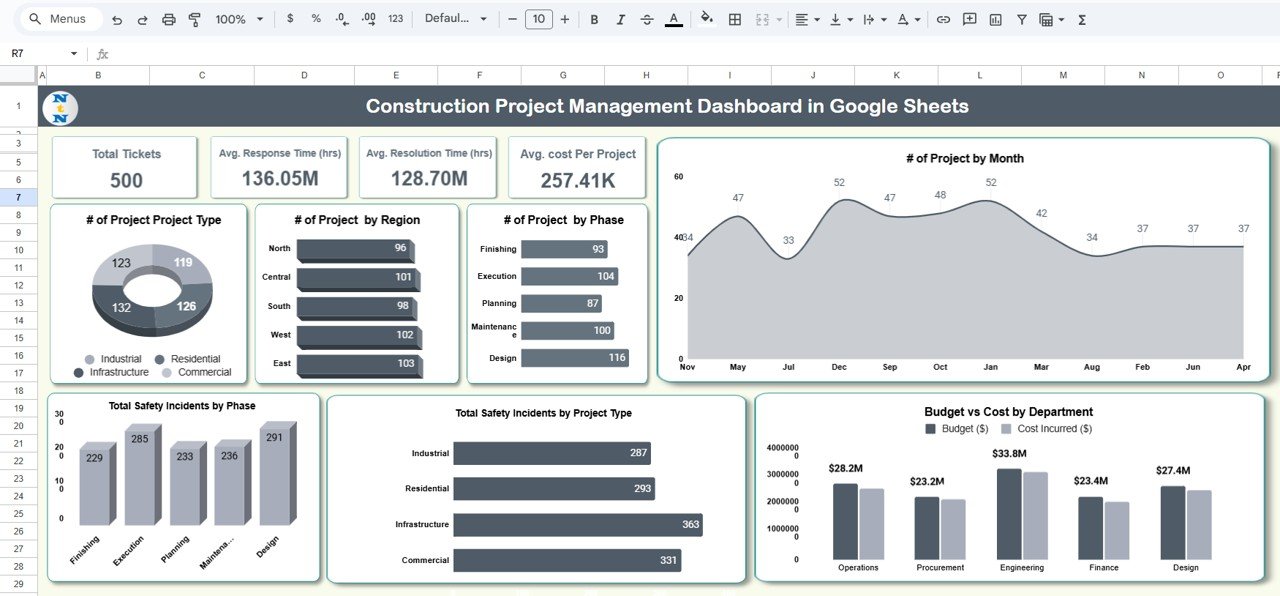
Dashboard Sheet Tab (Main Overview)
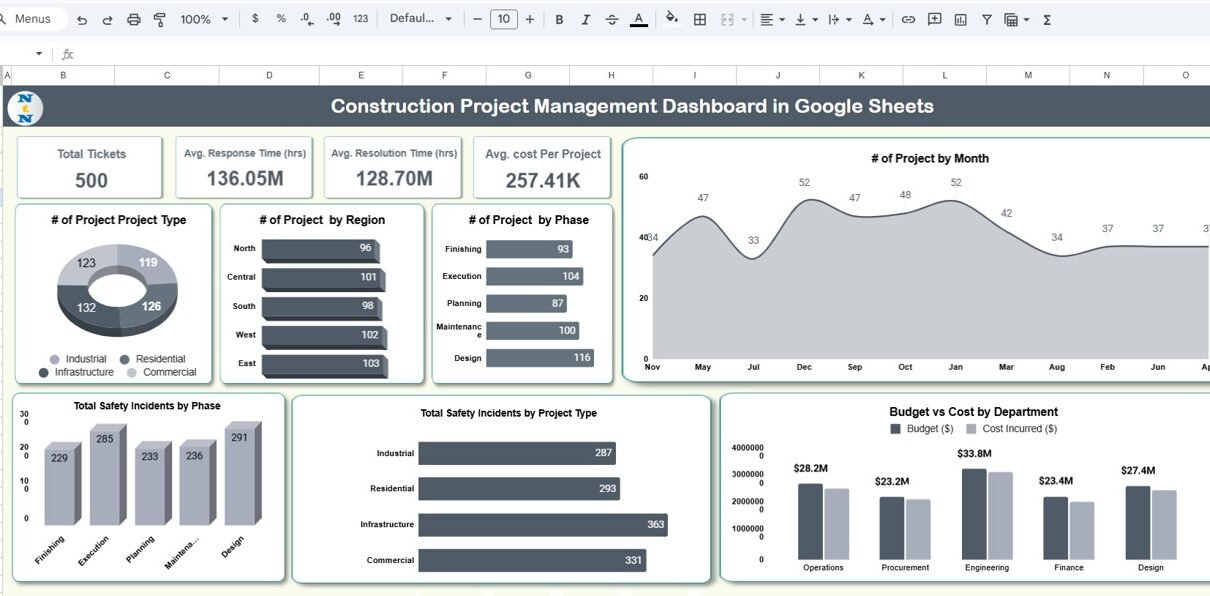
The Dashboard is the visual center of the workbook. It provides key performance metrics, interactive charts, and summarized analytics to monitor multiple projects simultaneously.
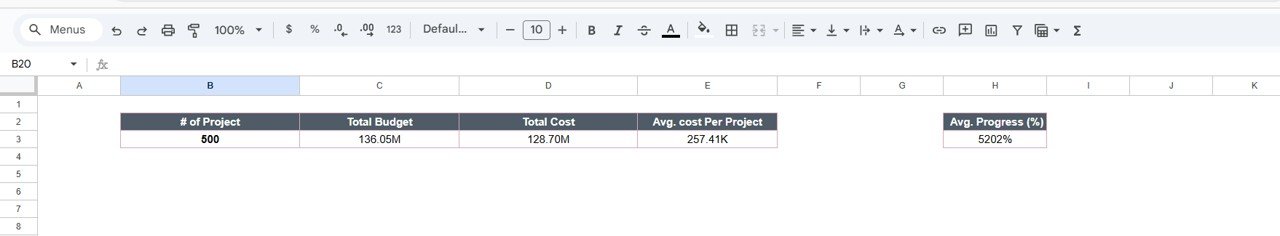
Cards (Top Summary Section)
-
# of Projects – Total number of active or completed projects.
-
Total Budget (USD) – Sum of all allocated project budgets.
-
Total Cost (USD) – Combined total of actual project expenditures.
-
Average Cost per Project (USD) – Average spend per project, calculated as Total Cost ÷ Number of Projects.
These summary cards automatically update based on live data from the Data Sheet.
Charts Included
The dashboard visually represents project data through interactive charts:
# of Projects by Project Type
-
Categorizes projects (e.g., Residential, Commercial, Industrial, Infrastructure).
-
Shows portfolio distribution.
# of Projects by Region
Click to Buy Construction Project Management Dashboard in Google Sheets
-
Displays geographic spread of ongoing and completed projects.
-
Helps assess regional performance or challenges.
# of Projects by Phase
-
Segments projects by phase (Planning, Execution, Monitoring, Closure).
-
Helps track pipeline progress.
# of Projects by Month
-
Shows project initiation trends over time.
-
Useful for understanding seasonality or workload distribution.
Budget vs Cost by Department
-
Compares planned vs actual expenses for each department (Design, Procurement, Construction, etc.).
-
Highlights budget overruns or savings.
Total Safety Incidents by Project Type
-
Monitors safety event frequency per project category.
-
Aids in identifying high-risk project types.
Total Safety Incidents by Phase
-
Evaluates safety risks during different project phases.
-
Supports safety compliance and preventive measures.
These visuals automatically refresh as new data is added, offering real-time operational insights.
Click to Buy Construction Project Management Dashboard in Google Sheets
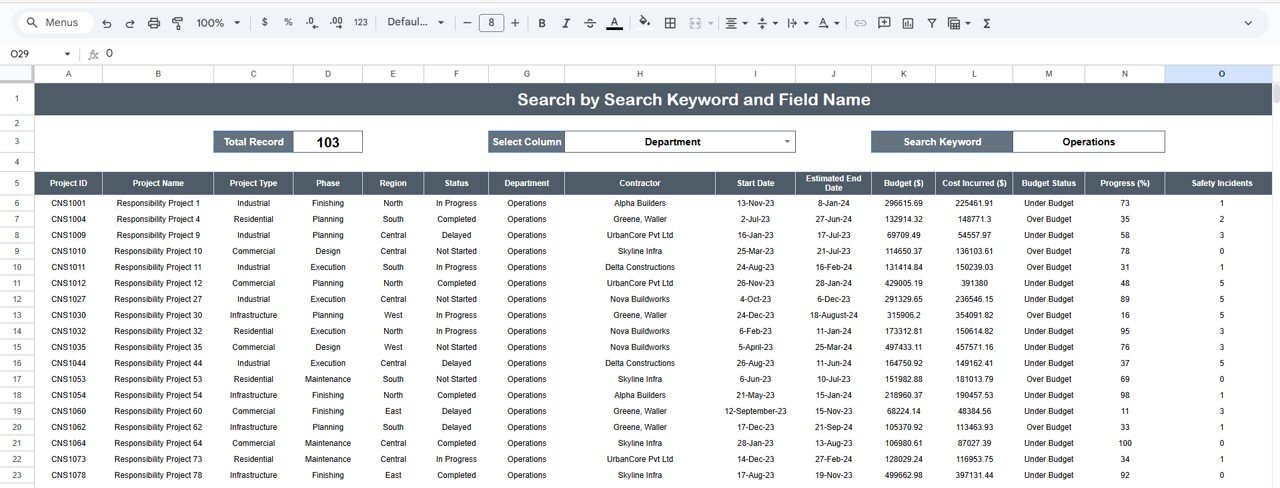
Search Sheet Tab
The Search Tab allows users to quickly find projects using keywords or field-based filters.
You can search by:
-
Project Name
-
Project ID
-
Department
-
Region
-
Project Phase
-
Manager Name
This functionality enhances data accessibility and helps users locate specific project details instantly.
Click to Buy Construction Project Management Dashboard in Google Sheets
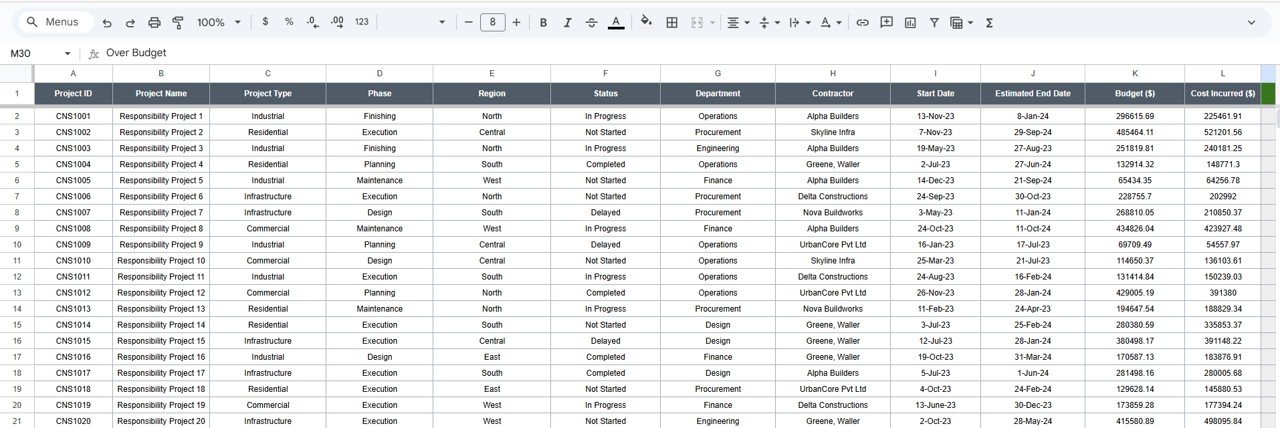
Data Sheet Tab
The Data Sheet Tab is the heart of the dashboard. It contains all raw project data and serves as the foundation for analytics
Support Sheet Tab
This sheet contains predefined lists (for dropdowns) such as Project Phases, Regions, Departments, and Project Types. It ensures consistent and standardized data entry.
Click to Buy Construction Project Management Dashboard in Google Sheets
Advantages of the Construction Project Management Dashboard
-
Centralized Overview: Monitor all projects in one place.
-
Data-Driven Decisions: Visualize costs, timelines, and performance.
-
Real-Time Tracking: Dashboard updates instantly as data changes.
-
Improved Financial Control: Detect cost overruns early.
-
Enhanced Safety Awareness: Identify high-risk areas or phases.
-
Cloud Collaboration: Multiple team members can edit simultaneously.
-
No Software Required: 100% built on Google Sheets.
Opportunities for Improvement
Click to Buy Construction Project Management Dashboard in Google Sheets
To enhance the functionality of this dashboard, consider the following upgrades:
-
Automated Data Entry: Integrate with Google Forms for project updates.
-
Timeline Visualization: Add Gantt charts for progress tracking.
-
Alerts: Set up notifications for budget or safety threshold breaches.
-
Forecasting Tools: Use trend analysis for cost and project duration projections.
-
Dashboard Filters: Add department or region-based slicers for better filtering.
Best Practices for Using the Dashboard
-
Maintain Data Accuracy: Update project status regularly.
-
Define KPI Ownership: Assign responsibility for each metric.
-
Review Monthly: Analyze cost vs budget and incident rates periodically.
-
Use Conditional Formatting: Color-code cost overruns and safety incidents.
-
Secure Sensitive Data: Restrict editing rights for financial data.
Conclusion
Click to Buy Construction Project Management Dashboard in Google Sheets
The Construction Project Management Dashboard in Google Sheets simplifies complex project tracking into an intuitive, visual, and collaborative format.
It allows managers to monitor budgets, costs, and safety across multiple projects, ensuring better financial discipline and operational control. With its automation and flexibility, it’s the perfect digital companion for construction companies of any size.
Frequently Asked Questions (FAQ)
1. Can this dashboard handle multiple contractors or clients?
Yes, you can add a “Contractor” or “Client” column in the Data Sheet for multi-party tracking.
2. Can it calculate project completion percentages?
Yes, simply add a “Progress %” column and update it monthly.
3. Can I track incidents by severity?
Yes, include a column for “Incident Severity” (Minor, Major, Critical).
4. Can I use this for cost forecasting?
Yes, by adding formulas to project cost trends based on historical data.
5. Can I share this dashboard with clients?
Yes, share it as a view-only Google Sheet to keep them informed.
Visit our YouTube channel to learn step-by-step video tutorials
Youtube.com/@NeotechNavigators
Watch the step-by-step video Demo:
Click to Buy Construction Project Management Dashboard in Google Sheets