Ask any freelancer what they earned last month and you get a number. Ask how many hours went into earning it, which client swallowed the most time, and how much of that time never made it onto an invoice, and the answer usually arrives with a shrug. The hours are in a notebook, a chat thread, a calendar and somebody’s memory. Nothing adds them up.
The billable hours time tracker in Google Sheets is built for exactly that gap. One file, four tabs, sixteen columns per entry, six of them calculating themselves, four dropdown lists fed from a single editable tab, one Total Billable Amount card and four charts that redraw as you type. Fifteen worked sample entries dated 03-Aug-2026 to 12-Aug-2026 ship inside it, spread across twelve clients and twelve project types, so nothing is blank the first time you open it and you can see the logic working before you delete a single row.
It is a spreadsheet you own, not a subscription you rent. The download is a PDF holding a “Make a copy” link; one click and the file is in your own Google Drive, editable, shareable and yours to keep.
Get the Billable Hours & Time Tracker in Google Sheets

Key Features of the Billable Hours & Time Tracker in Google Sheets
- One Total Billable Amount card. It sums the Billable Amount column across the whole log. In the sample data it reads $4.2K, and it moves the instant an end time, a rate or a Billable? flag changes.
- Times in, hours out. You type a Start Time and an End Time; Logged Hours is a formula, and it copes with a session that runs past midnight instead of returning a negative figure.
- Six automatic columns. Entry ID, Logged Hours, Billable Hours, Billable Amount, % Billable and Rate Check are all calculated. Nine fields are yours to type; the rest look after themselves.
- A Rate Check safety net. Mark a row Billable and leave Hourly Rate empty and the column returns a red Set Rate. Sample entry 6 – a 1.25-hour contract review for Foster Legal – shows exactly that state, with “Rate TBD – confirm” in the Notes.
- Billable and non-billable side by side. Three of the fifteen sample rows are Non-Billable: a sprint planning call, a weekly status report and internal admin. They still count towards Logged Hours, and % Billable drops to 0% for each, which is precisely the number most freelancers never see.
- A four-state billing trail. Status runs Unbilled, Invoiced, Paid, with On Hold for work a client has parked. The sample splits 7 Unbilled, 4 Invoiced, 3 Paid and 1 On Hold.
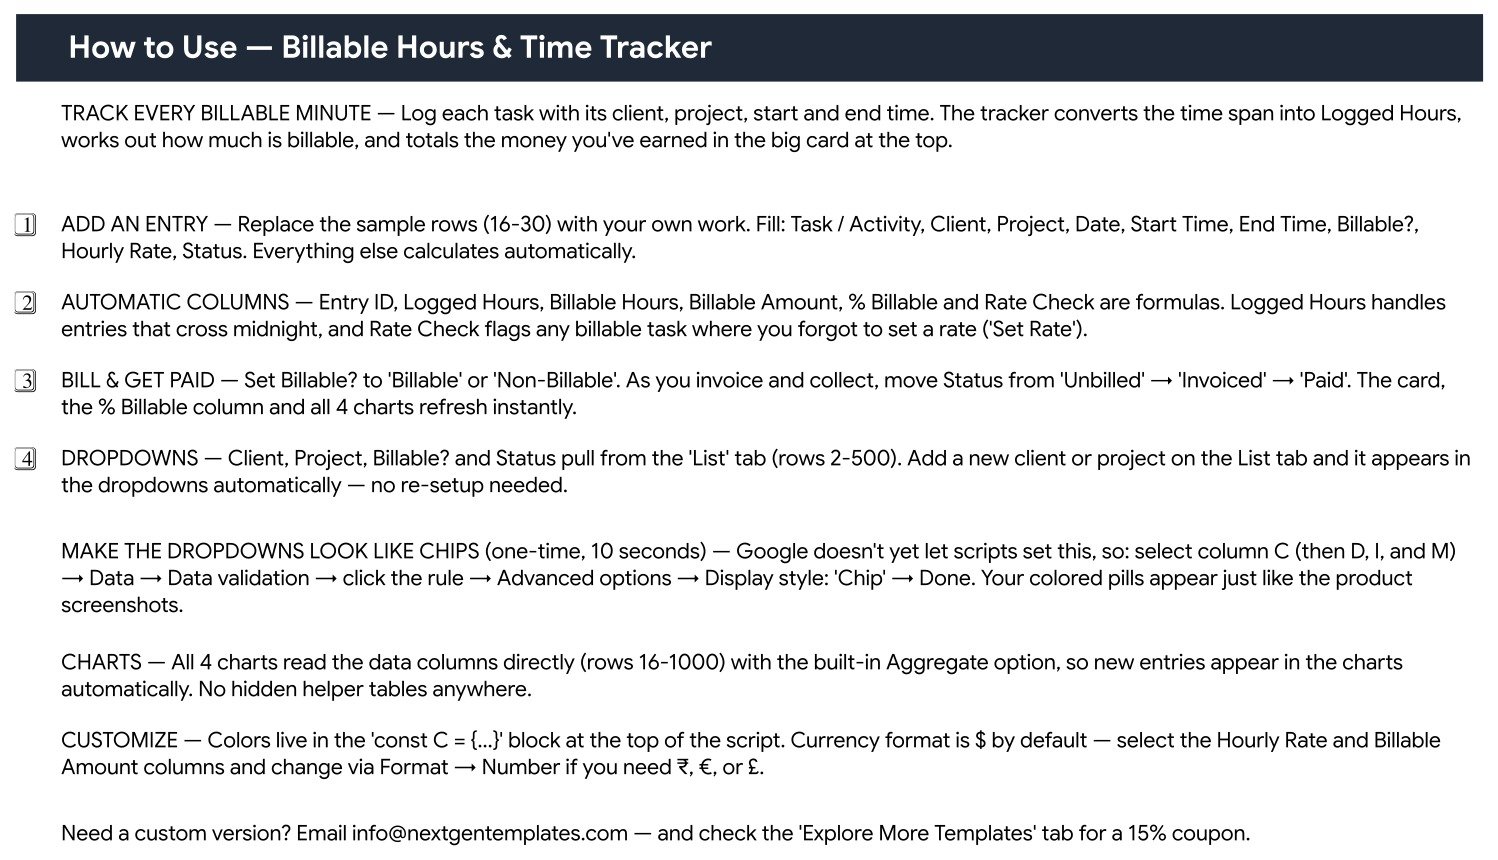
- Four charts wired straight to the data. Time Entries by Client, Entries by Status, Billable Amount by Task and Logged vs Billable Hours all read the columns directly for rows 16 to 1000 using the built-in Aggregate option. There are no helper tables hidden anywhere, which is the usual reason a spreadsheet’s charts quietly stop matching its data.
- Dropdowns that expand on their own. Client, Project, Billable? and Status read the List tab, rows 2 to 500. Add a client there and it is in the dropdown a second later.
- Yours to restyle. The colour palette sits in one constants block at the top of the script, and the currency is ordinary cell formatting – switch $ for Rs, Euro or Pound through Format, Number.
Tracker Pages Explained
Billable Hours & Time Tracker
The working page. A dark title banner, the Total Billable Amount card on the left, then the four charts across the top and the entry table beneath. The sixteen columns are Entry ID, Task / Activity, Client, Project, Date, Start Time, End Time, Logged Hours, Billable?, Hourly Rate, Billable Hours, Billable Amount, Status, % Billable, Rate Check and Notes. Client and Status cells carry colour, so the log scans in a second: green for Billable, amber for Unbilled, blue for Invoiced, red for On Hold.
List
The quiet tab that does most of the work. Clients, projects, the two Billable? values and the four Status values live here in rows 2 to 500, and every dropdown on the tracker points at them. Maintain your client roster in one place and the rest of the sheet follows.
How to Use
A single-screen guide that covers adding an entry, which columns calculate themselves, how to move an entry through the billing cycle, how the dropdowns are fed, the ten-second step that turns those dropdowns into coloured chips, how the charts are wired, and where to change colours and currency. It ends with a support email and a coupon pointer.
Explore More Templates
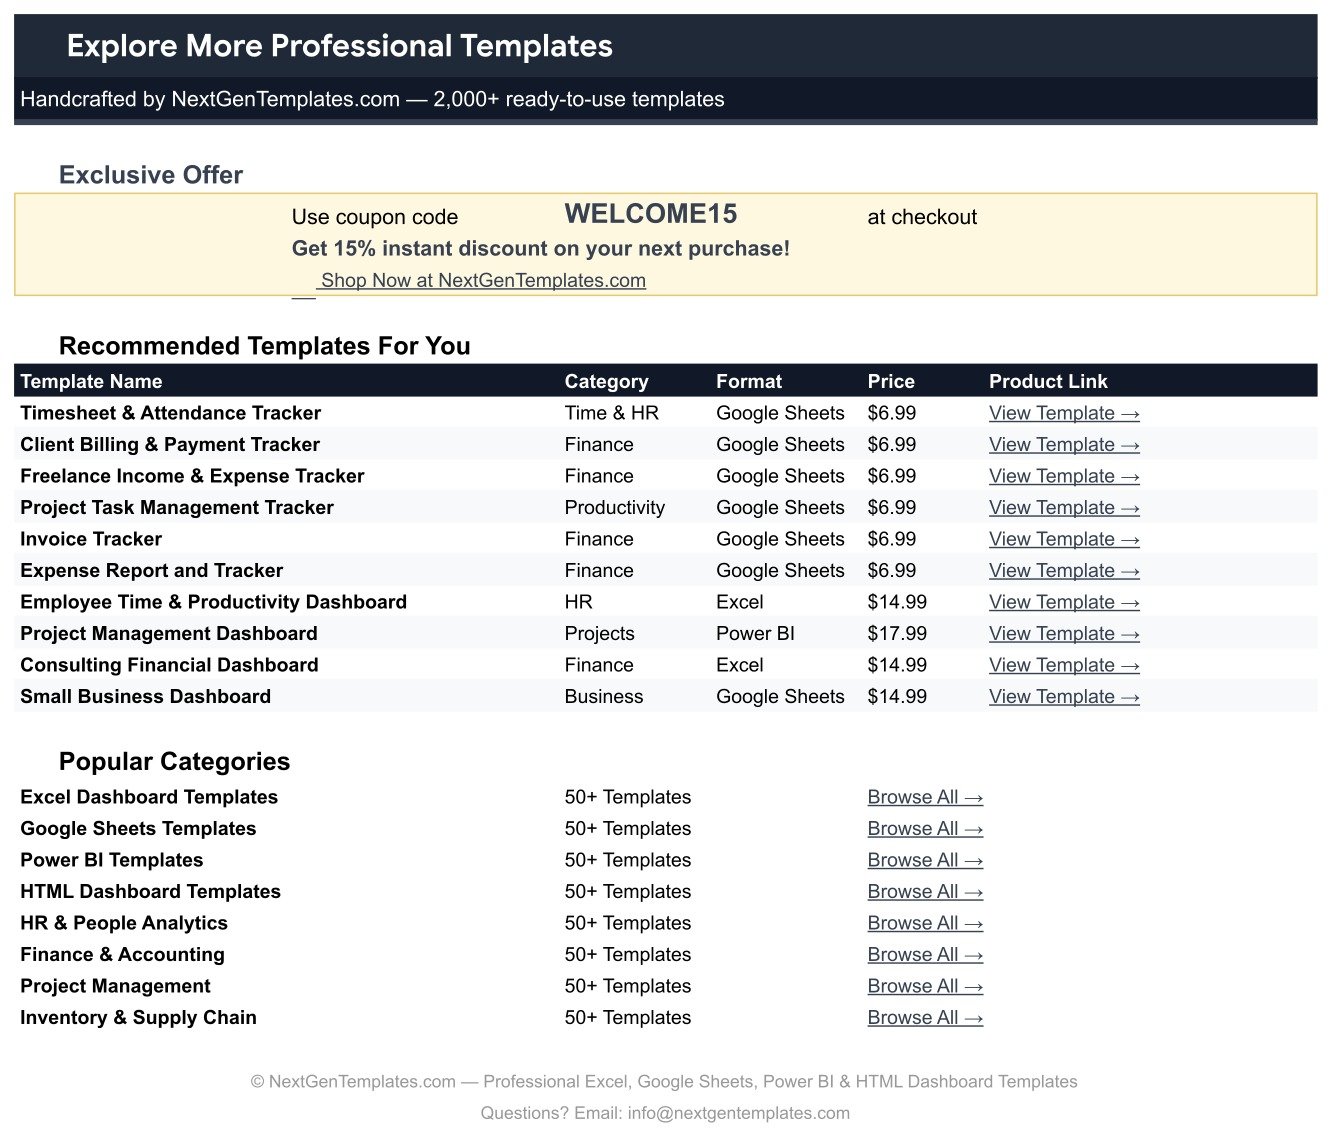
A closing tab pointing at the wider NextGenTemplates range – a WELCOME15 coupon code, ten recommended templates with prices, and eight category shortcuts.
Billable Hours Time Tracker in Google Sheets vs. an Excel Timesheet vs. Paid Time-Tracking Apps – Feature Comparison
| This Google Sheets tracker | DIY Excel timesheet | Paid time-tracking app | |
|---|---|---|---|
| Cost | $6.99 once | Free, but you build it | Commonly $10-$15 per user per month |
| Platform | Google Sheets, any browser | Microsoft Excel | Web app plus mobile app |
| Setup time | Click the copy link and start typing | Hours of columns, formulas and charts | An hour or more of accounts, projects and rates |
| Real-time collaboration | Yes, native Google Sheets sharing | Only by emailing the file | Yes, priced per seat |
| Mobile access | Google Sheets mobile app | Excel mobile, awkwardly | Yes, with a background timer |
| Customisable fields and lists | Every column and every dropdown | Anything you can build | Whatever the plan exposes |
| Share with a link | Yes, view-only or editable | No | Usually inside the team only |
| Year-1 cost, 5 users | $6.99 total | $0 plus your time and Office licences | Roughly $600-$900 |
| Stopwatch / timer button | No – you type start and end times | No | Yes |
| Generates invoices | No – it records invoice status | No | Yes on most plans |
| Per-client rate cards applied automatically | No – rate is typed per row, and flagged if missing | Only if you build the lookup | Yes |
| Export your raw data | Yes, it is a spreadsheet | Yes | Varies by vendor |
The honest summary: a paid app runs a timer on your phone, applies a stored rate and produces the invoice. This tracker does none of those three things. What it does is make the record exist at all, for a one-off price, in a file nobody can lock you out of.
Who Should Use This Template
The billable hours time tracker fits freelancers and independent consultants billing several clients by the hour. Small design, content, development and marketing studios of two to ten people who share one sheet. Bookkeepers, coaches, tutors and solicitors who bill in blocks and need a defensible record of what was done and when. Anyone who has ever written an invoice from memory and known, while typing it, that they were undercharging.
It is not for payroll, because there are no approvals, overtime rules or statutory records. Not for teams that need a phone timer running in the background. Not for agencies that must issue numbered invoices with tax lines from the same system. And not for period reporting: the card and the charts cover every row in the sheet, so what you see is the running position, not a month you selected.
Real-World Use Cases
A freelance brand designer. Two retainers, three project clients. She logs each session as she closes it and keeps Non-Billable rows for pitching and admin. At month end she filters Status to Unbilled, reads the Total Billable Amount card, and invoices from a number rather than a guess.
A four-person development studio. Everyone types into the same shared copy. The Logged vs Billable Hours chart is the Monday morning check: where the logged bar towers over the billable one, scope has drifted and it is a conversation with the client, not a write-off.
A bookkeeping practice billing three different rates. The Rate Check column is the safety net. Nothing gets invoiced from the sheet while a billable row is still flagged Set Rate, which is how an eleven-hour on-site job stops going out at zero.
A consultant preparing for a client dispute. Task, client, project, date, start time, end time and a note per entry make a contemporaneous record. It will not settle an argument by itself, but it beats reconstructing three months from a calendar.
Advantages of the Billable Hours & Time Tracker
- The unbilled number becomes visible. Sorting by Status shows what is sitting in Unbilled, in money, not in a feeling.
- Non-billable time stops being invisible. Once admin and pitching are logged, the true billable percentage of a week stops being a comfortable estimate.
- No helper tables to break. The charts read the columns directly, so inserting rows, sorting or filtering does not silently detach a chart from its data.
- Setup is minutes, not an afternoon. Copy the file, fill the List tab, start logging.
- It shares like any Google Sheet. One link, live for everyone, no seats to buy – see Google’s guide to sharing files.
- It is portable. Download to Excel or CSV whenever you want; there is no export queue and no vendor in the middle.
Opportunities for Improvement
Stated plainly, because you should know before you buy:
- The chip-style dropdowns need one manual step. Google does not let a script set the Chip display style, so on first open the dropdowns look like plain text. Select column C, then Data, Data validation, click the rule, Advanced options, Display style: Chip – and repeat for D, I and M. Ten seconds, once, and it is documented on the How to Use tab.
- There is no timer. Start Time and End Time are typed. If you routinely forget to note when you started, an app with a stopwatch will serve you better.
- Hourly Rate is entered per row. There is no per-client rate card feeding it automatically. Rate Check flags a missing rate rather than filling one in, which is a warning system, not a lookup.
- No month or date-range filter. The card and all four charts read the whole log, so the totals are running rather than period-specific. A filter view or a sort by Date is the workaround.
- It records invoice status; it does not raise invoices. No invoice numbers, no tax lines, no payment links.
- No expenses, mileage or tax columns. Billed time only – pair it with an income and expense tracker if you need the whole picture.
Best Practices
Six habits that decide whether a billable hours time tracker pays for itself in the first week:
- Fill the List tab before your first entry. Every dropdown reads from it, and five minutes there removes a hundred typos later.
- Log at the end of each task, not the end of the week. The single biggest source of lost income is reconstruction from memory.
- Log non-billable work too. A week that looks 100% billable usually means the admin simply was not recorded.
- Never invoice while a row reads Set Rate. Treat the red flag as a hard gate.
- Move Status the day the money moves. Unbilled to Invoiced when you send it, Invoiced to Paid when it clears.
- Keep one file per year. Duplicate the sheet each January so the charts stay readable and the running totals stay meaningful.
Explore Relevant Templates
- Freelance Income & Expense Tracker in Google Sheets – the money side of the same business, once the hours are billed.
- Screen Time & Digital Detox Tracker in Google Sheets – where the unbilled hours actually go.
- Therapy Sessions & Progress Tracker in Google Sheets – the same one-page tracker pattern applied to a session-based practice.
- Billable Hours & Time Tracker in Google Sheets – the template this article describes.
- All Google Sheets trackers – the wider range.
If you would like to build tracker skills step by step, the NextGenTemplates Academy learning paths include practice files you can work through at your own pace.
Get the Billable Hours & Time Tracker in Google Sheets
Frequently Asked Questions
How do I get the file?
Your download is a PDF containing a “Make a copy” link. Click it and Google creates your own editable copy in your Drive. Nothing is installed, and the master file is never touched.
Does it have a start/stop timer?
No. You type a start and an end time, and the sheet does the arithmetic, including entries that cross midnight. A background timer is the one thing a paid app genuinely does better.
Can my team log time in the same file?
Yes. Share it like any Google Sheet. Everyone types into the same table, and the card and the four charts update for all of them at once.
Will new rows show up in the charts?
Yes. Every chart reads the data columns directly for rows 16 to 1000 with the built-in Aggregate option, so entries appear without any chart being touched.
Can I use a currency other than dollars?
Yes. Select the Hourly Rate and Billable Amount columns and change the format under Format, Number. The symbol is cell formatting, not a hard-coded value.
Does it produce invoices?
No. It tracks where each entry sits – Unbilled, Invoiced, Paid or On Hold – and totals what is owed. The invoice document itself stays in your invoicing tool.
Why are my dropdowns plain text instead of coloured chips?
Chip display is a setting a script cannot apply. Turn it on for columns C, D, I and M through Data, Data validation, Advanced options – it takes about ten seconds and is written up on the How to Use tab.
About the Author
Built by PK – Microsoft Certified Professional with 15+ years of Excel, Google Sheets, and Power BI experience. Founder of NextGenTemplates, reaching 300K+ subscribers across YouTube channels. Every template is hand-built and tested before release.
Conclusion
A billable hours time tracker fails for one reason: the recording is more effort than the money seems to justify, right up until the invoice. This sheet lowers that effort to nine typed fields and shows you the consequence immediately – a running total, a billable percentage, a red flag when a rate is missing, and four charts that make a drifting project obvious. It will not run a stopwatch or raise an invoice, and it does not pretend to. What it will do is make sure the hours exist somewhere other than your memory.
Get it here: Billable Hours & Time Tracker in Google Sheets – $6.99, one payment, yours to keep.