Most of us already know roughly how long we spend on a screen, because the phone tells us every Sunday. What almost nobody has is a record — the weekly figure disappears the moment the next week starts, so there is no way to compare this March with last October, or to see whether the evening you deliberately put the phone away actually shifted anything.
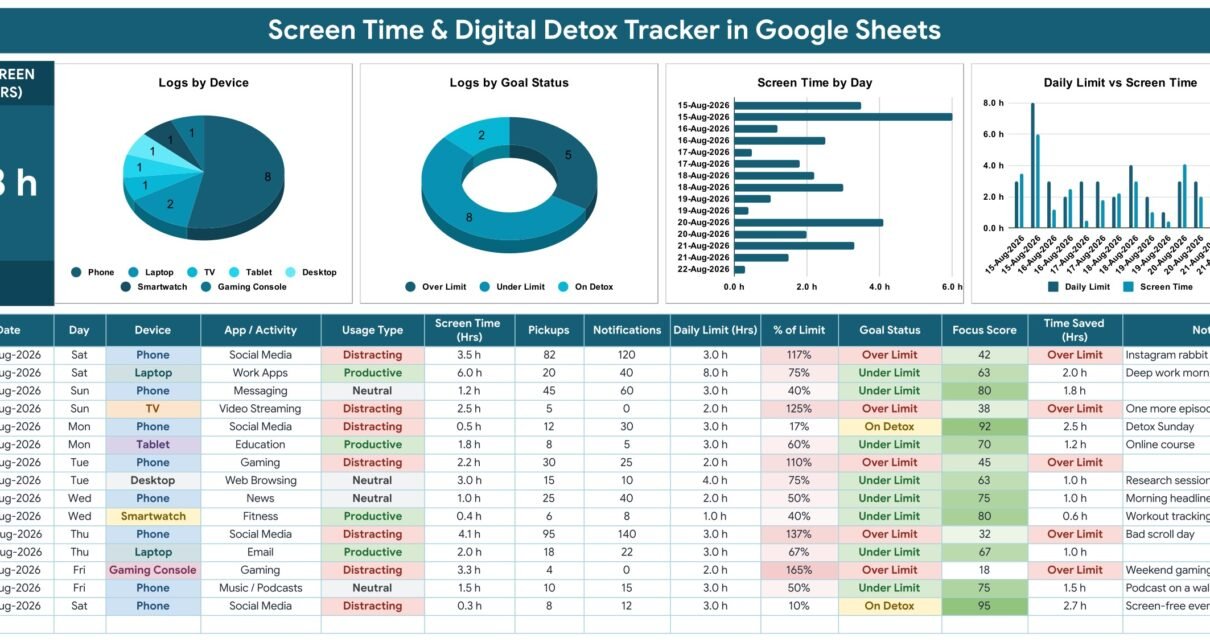
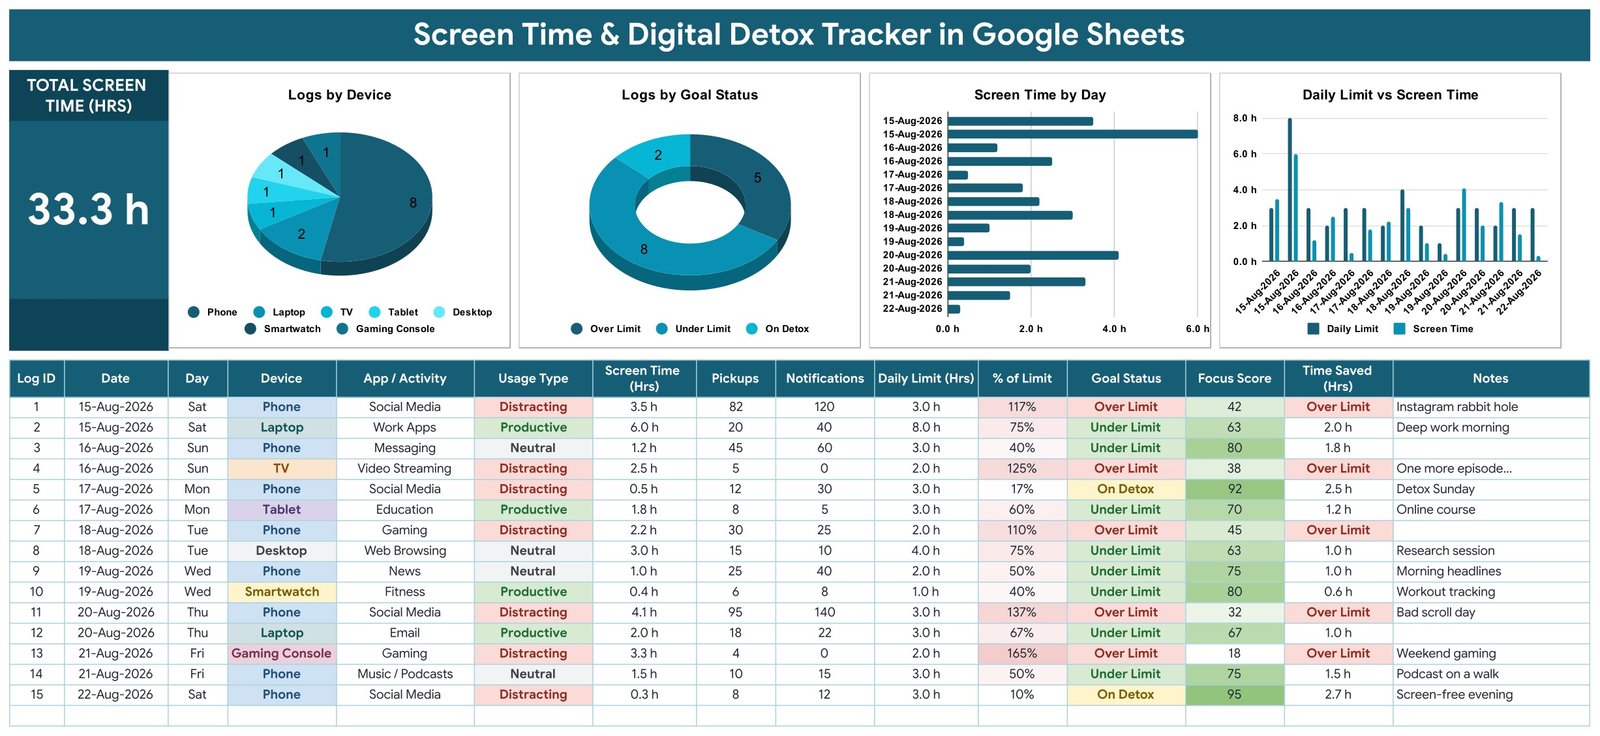
That is the gap the Screen Time & Digital Detox Tracker in Google Sheets fills. It is a single-page log with 15 columns, 5 of them formulas, one headline card and 4 charts, spread across 4 tabs. The sample file ships with 15 sessions logged between 15-Aug-2026 and 22-Aug-2026, and the TOTAL SCREEN TIME (HRS) card on top of them reads 33.3 h. Formulas and charts already reach row 1000, which is 985 logs before you have to extend anything.
Get the Screen Time & Digital Detox Tracker
One thing to be completely clear about before you read any further: this template is a manual log. It does not measure your screen time. It does not monitor your phone, does not block apps or sites, does not run in the background, and does not connect to iOS Screen Time, Android Digital Wellbeing or any browser extension. There is no device integration and no permission to grant. You read the figure off your own device and type it in. Every number the sheet then shows you — the card, the percentages, the Focus Score, the four charts — is arithmetic performed on values you entered yourself.
Key Features of the Screen Time & Digital Detox Tracker
- TOTAL SCREEN TIME (HRS) card. A
SUMover the Screen Time (Hrs) column from row 16 to row 1000. On the shipped sample: 33.3 h. - 15 columns, 9 of them typed. Date, Device, App / Activity, Usage Type, Screen Time (Hrs), Pickups, Notifications, Daily Limit (Hrs) and Goal Status. Notes is optional; the rest calculate.
- 5 formula columns. Log ID, Day, % of Limit, Focus Score and Time Saved (Hrs).
- Focus Score 0-100. Each session scored against the limit you set for that session.
- 4 charts reading the data columns directly, with no hidden helper table anywhere in the file.
- 28 dropdown values across 4 lists on a plain List tab, read from rows 2 to 500.
- No Apps Script, no macros, no add-on. Free-tier Google Sheets, no permissions prompt.
The Four Tabs, Explained
1. Screen Time Tracker
The working page, and the only one you type into. The headline card sits top-left, the four charts run in a band across the top, headers are on row 15 and data starts at row 16.
The 15 columns in order: Log ID, Date, Day, Device, App / Activity, Usage Type, Screen Time (Hrs), Pickups, Notifications, Daily Limit (Hrs), % of Limit, Goal Status, Focus Score, Time Saved (Hrs), Notes.
Log ID numbers itself from the row. Day converts the date to a three-letter weekday with TEXT(B16,"ddd"). % of Limit is Screen Time divided by Daily Limit. Focus Score is ROUND(MAX(0, MIN(100, 100 * (2 * Limit - Screen Time) / (2 * Limit))), 0) — so 3.5 h against a 3 h limit gives 42, and 0.3 h against the same limit gives 95. Time Saved returns Limit minus Screen Time when you come in under, and the literal words “Over Limit” when you do not.
Conditional formatting does the rest of the reading for you: Usage Type, Goal Status, % of Limit and Focus Score are all colour-banded, so an over-limit row is red across four columns without you looking at a single number.
2. List
Four dropdown source columns, one per validated field:
- Device – Phone, Tablet, Laptop, Desktop, TV, Gaming Console, Smartwatch, E-Reader (8)
- Goal Status – Under Limit, Over Limit, On Detox (3)
- App / Activity – Social Media, Video Streaming, Gaming, Messaging, Web Browsing, Work Apps, Email, News, Music / Podcasts, Education, Fitness, Shopping, Photo / Video, Productivity (14)
- Usage Type – Productive, Neutral, Distracting (3)
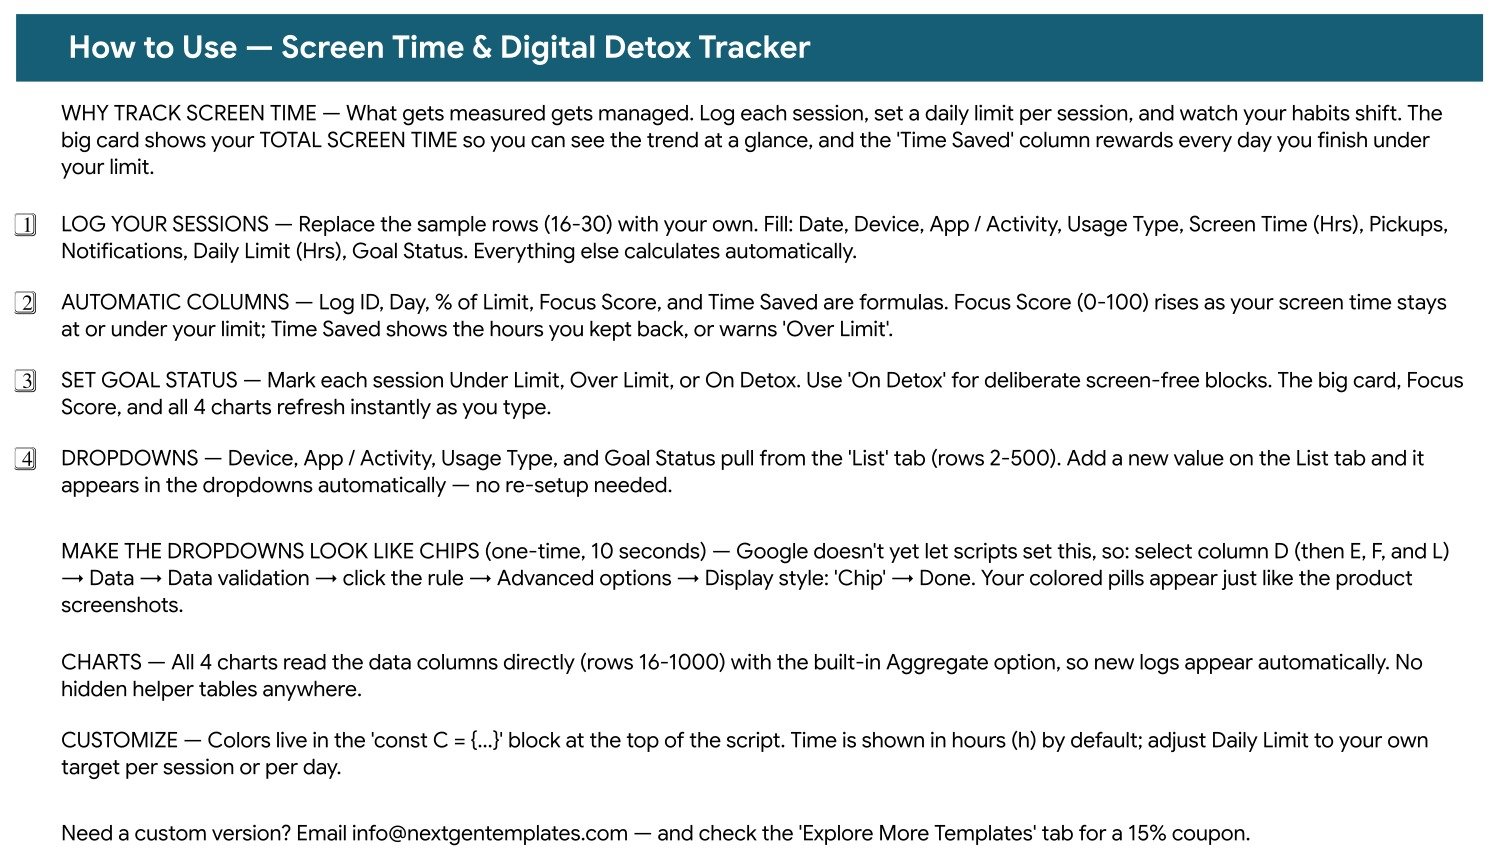
The dropdowns read rows 2 to 500 of each column, so adding a device or an app is a matter of typing it under the last one. Nothing has to be re-pointed.
3. Instructions
The How to Use page. It covers the typed columns, the formula columns, what “On Detox” is for, how the List tab feeds the dropdowns, and the one manual step in the whole build: turning the plain dropdowns into the coloured chips you see in the screenshots. That is Google’s data validation setting and a script cannot set it, so it is ten seconds of clicking on columns D, E, F and L.
4. Explore More Templates
A WELCOME15 coupon and links out to ten related NextGenTemplates files.
Screen Time Tracker in Google Sheets vs. a Blank Spreadsheet vs. a Paid Habit App
| This template | Blank Excel / Sheets file | Paid habit or focus app | |
|---|---|---|---|
| Cost | $6.99 once | Free, plus your evening | $4-$12 per month |
| Platform | Google Sheets, free tier | Excel or Sheets | Phone app plus account |
| Setup time | About 1 minute | 2-4 hours | 10 minutes, then permissions |
| Captures screen time for you | No – you type it in | No | Usually yes |
| Real-time collaboration | Yes, standard Sheets sharing | Sheets yes, Excel desktop no | Rarely |
| Mobile access | Google Sheets mobile app | Varies | Yes |
| You own the data file | Yes, in your own Drive | Yes | No |
| Customisable columns | Yes | Yes | Almost never |
| Year-1 cost, 5 people | $6.99 | $0 plus 5 evenings | $240-$720 |
| Rows ready out of the box | 985 (rows 16-1000) | Whatever you build | Unlimited |
Who Should Use This Template
People who already see their weekly device report and want to keep it. Households agreeing limits and wanting one shared, visible record instead of an argument. Students and freelancers who want to separate Productive hours from Distracting ones rather than just count total hours. Anyone running a deliberate detox who wants the screen-free evenings logged next to the ordinary ones, so the difference is on the page instead of in memory.
It is the wrong tool if you want capture without typing, app blocking, focus timers or alerts. And it is not a clinical instrument: it cannot tell you whether your use is healthy or unhealthy, and nothing in it is medical or psychological advice. If screen use is affecting your sleep, your work or your relationships, that is a conversation for a qualified professional, not a spreadsheet.
Real-World Use Cases
Two rows a day, one device each. A freelance designer logs a laptop row for Work Apps against an 8 h limit and a phone row for Social Media against a 1 h limit. After a month the Daily Limit vs Screen Time chart makes the split obvious: the work rows land under almost every day and the phone rows almost never do.
A household ledger. One shared sheet, one row per child per evening, Goal Status agreed in advance, Sunday logged as “On Detox”. The Logs by Goal Status donut is the whole conversation.
A four-week experiment. Log two weeks as they are, then change one thing — phone out of the bedroom, notifications off after 8pm — and log two more. Sort by Date and the before-and-after sits in the same table, in the same units.
Advantages of the Screen Time & Digital Detox Tracker
- It is honest about what it is. No background process, no permission, no data leaving your Drive. The template cannot see anything you do not type.
- The limit is per row, not global. A 30-minute limit for social media and an 8-hour one for work apps coexist in the same log, and % of Limit stays meaningful for both.
- Nothing is hidden. Five visible formulas, four charts pointed straight at the data columns, no helper tables, no named ranges to hunt through.
- It is a spreadsheet. Delete a column you do not want, add one you do, change a formula. No app is going to stop you.
- 985 rows are already wired. Log daily and that is more than two and a half years before you extend anything.
Opportunities for Improvement
Three honest ones, all visible in the shipped screenshots:
The day charts plot one bar per log row, not one per date. In the sample, 15-Aug-2026 has two sessions and appears twice on the Screen Time by Day axis. If you would rather see one bar per calendar day, switch the chart’s Aggregate option on in the chart editor, or keep one row per device per day.
Time Saved (Hrs) mixes text and numbers. It returns hours when you are under and the words “Over Limit” when you are over, which reads well but means a plain SUM down the column will not give you a total. Use SUMIF on the numeric entries if you want one.
Screen time is entered in decimal hours. 20 minutes is 0.3, 90 minutes is 1.5. That keeps every formula simple, but it is a conversion you do in your head each time. If you prefer minutes, change the header, divide by 60 inside the Focus Score and % of Limit formulas, and the rest still works.
Best Practices
- Log at a fixed time. Once a day, same moment. A log with gaps in it is worse than no log, because the charts will quietly mislead you.
- Set the Daily Limit before the session, not after. Filling it in afterwards to make the Focus Score look good is the one way to make this template useless.
- Keep the categories few. Fourteen App / Activity values ship with it; if you add forty, the Logs by Device and Logs by Goal Status charts stop being readable.
- Use “On Detox” honestly. It is for deliberate screen-free blocks, not for days you happened to be busy.
- Duplicate the tab each year. Charts and formulas run to row 1000; a clean sheet per year keeps comparisons tidy.
Explore Relevant Templates
- Digital Detox Checklist in Google Sheets
- Habit Tracker in Google Sheets
- Sleep Tracker in Google Sheets
- Mood & Mental Health Tracker in Google Sheets
- Weekly Planner with Goals Tracker in Google Sheets
- Daily Habits Tracker Checklist in Google Sheets
More on this blog: Digital Marketing KPI Scorecard in HTML, Digital Marketing Campaign Dashboard in HTML and Digital Advertising Calendar in Google Sheets.
Want to build spreadsheet skills like this step by step? The NextGenTemplates Academy learning paths walk you through trackers and templates with practice files.
Get the Screen Time & Digital Detox Tracker
Frequently Asked Questions
Does it track my screen time automatically?
No. It has no access to your device and no way to observe anything. You type the figures in from your phone’s or computer’s own report.
Does it connect to iOS Screen Time or Android Digital Wellbeing?
No. There is no import, no sync and no API connection to either platform.
Can it block an app or remind me to stop?
No. It cannot block, filter, time, alert or notify. It is a record of what already happened.
How is the Focus Score calculated?
100 x (2 x Daily Limit - Screen Time) / (2 x Daily Limit), rounded and clamped to 0-100. It compares your session against the limit you set for it and nothing else. It is not a norm or a health measure.
How many entries fit?
985, in rows 16 to 1000, with all formulas and charts already covering that range.
Do I need a paid Google Workspace account?
No. Free-tier Google Sheets is enough. There is no Apps Script and no add-on.
Will it work in Excel?
You can export to .xlsx, but it is built for Google Sheets and the chip dropdowns and formatting will not come across cleanly.
About the Author
Built by PK – Microsoft Certified Professional with 15+ years of Excel, Google Sheets, and Power BI experience. Founder of NextGenTemplates, reaching 300K+ subscribers across YouTube channels. Every template is hand-built and tested before release.
Conclusion
The Screen Time & Digital Detox Tracker will not do the watching for you, and it does not pretend to. What it does is give the numbers you already see once a week somewhere permanent to live, in a shape you can compare across months: 15 columns, 5 of them automatic, one headline hour count, four charts, and 985 rows of room. That is worth about a minute a day, and the file is yours to change forever after one payment.
Get the Screen Time & Digital Detox Tracker in Google Sheets – $6.99, instant download, no subscription.