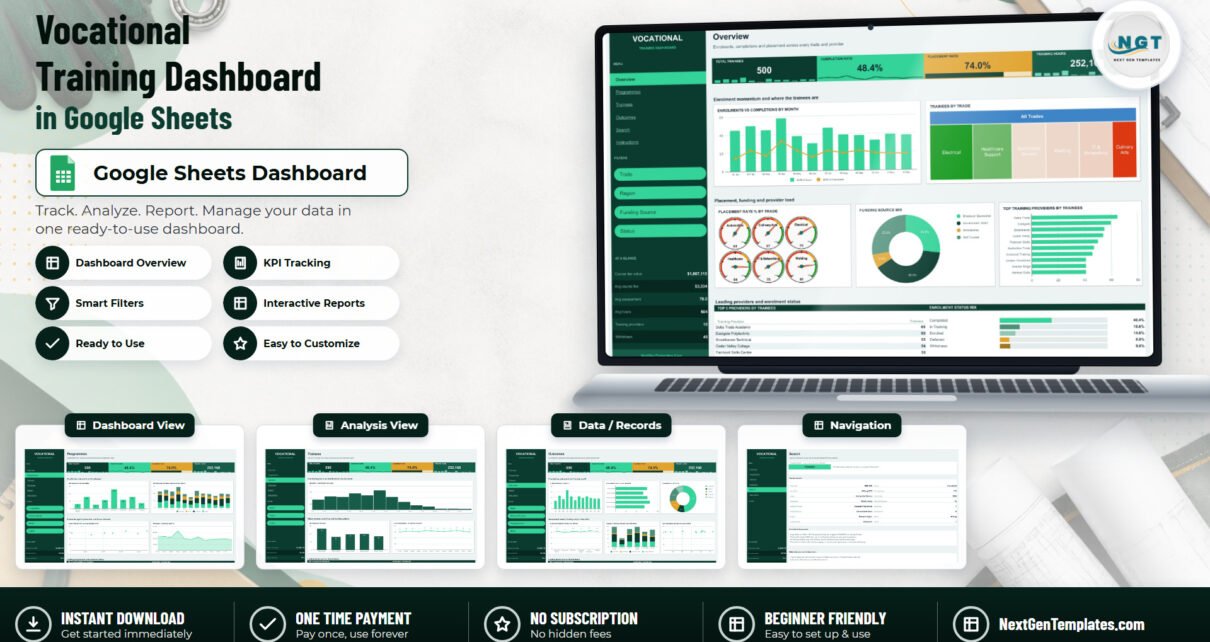
The Vocational Training Dashboard in Google Sheets is a six-tab reporting workbook that turns one flat export of trainee records into four analysis pages, four headline KPIs, 17 charts and a six-dial placement gauge panel. The sample file ships with 500 trainee rows across 6 trades, 8 programmes and 10 training providers, and the formulas already stretch to 1,000 rows – so most providers can paste their own data in and read the numbers within ten minutes.
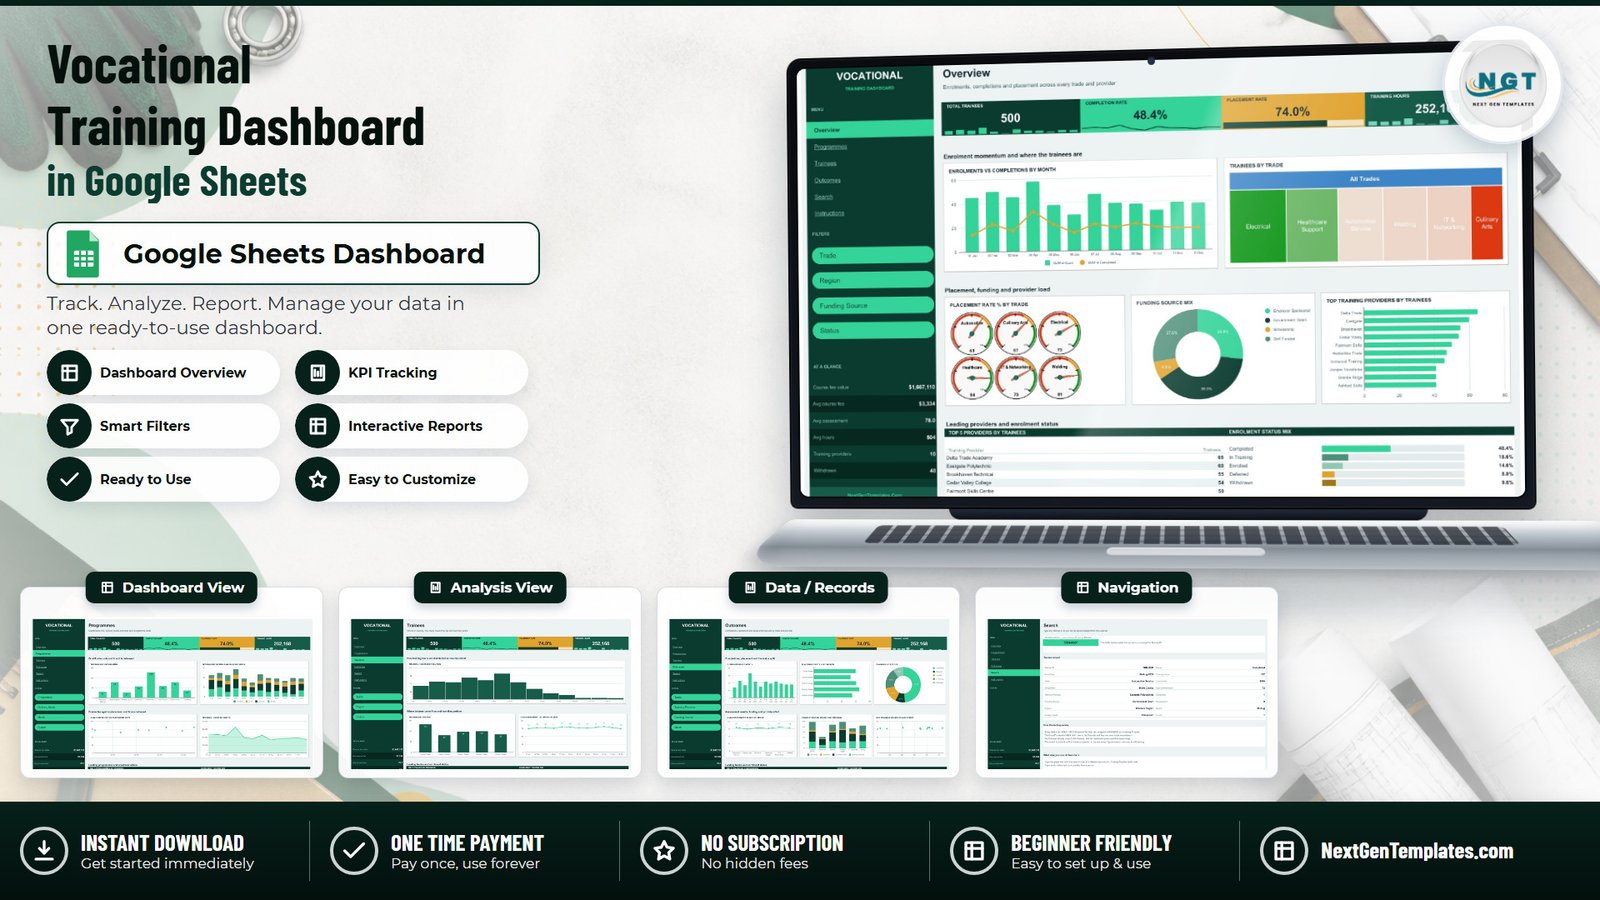
Most training providers already hold the data they need. It sits in a student MIS or an enrolment spreadsheet, and once a month somebody rebuilds the same board pack by hand – completions by trade, placement by region, which provider is carrying the biggest cohort. The Vocational Training Dashboard in Google Sheets exists to end that rebuild. It is deliberately a reporting layer and nothing more: a static workbook you refresh by pasting a fresh export, with no live connection to any enrolment system.
Get the Vocational Training Dashboard in Google Sheets
Key Features of the Vocational Training Dashboard in Google Sheets
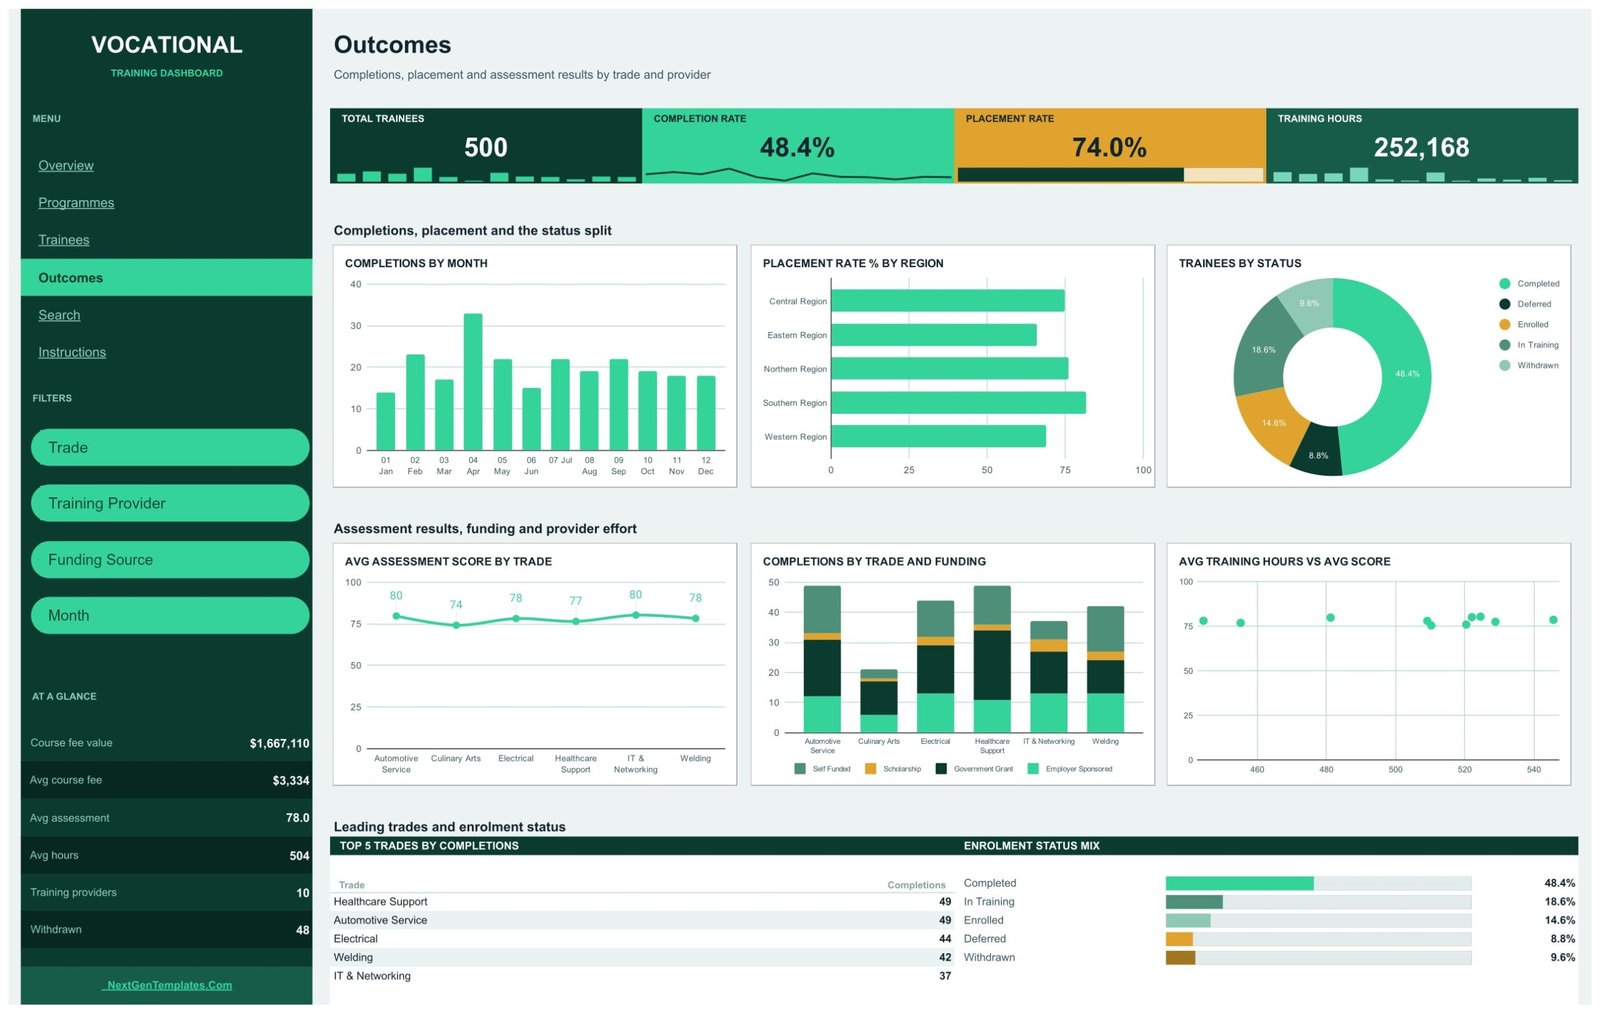
- Four KPI tiles repeated on every analysis page. Total Trainees, Completion Rate, Placement Rate and Training Hours, each with an inline spark strip. In the shipped sample they read 500, 48.4%, 74.0% and 252,168.
- A standing “At a glance” rail under the navigation carrying course fee value, average course fee, average assessment score, average hours, training provider count and withdrawn count.
- Fifteen slicer chips across four pages. Overview, Programmes and Outcomes carry four each; Trainees carries three because it runs a wider chart set. Slicers apply per page, so each page holds its own view.
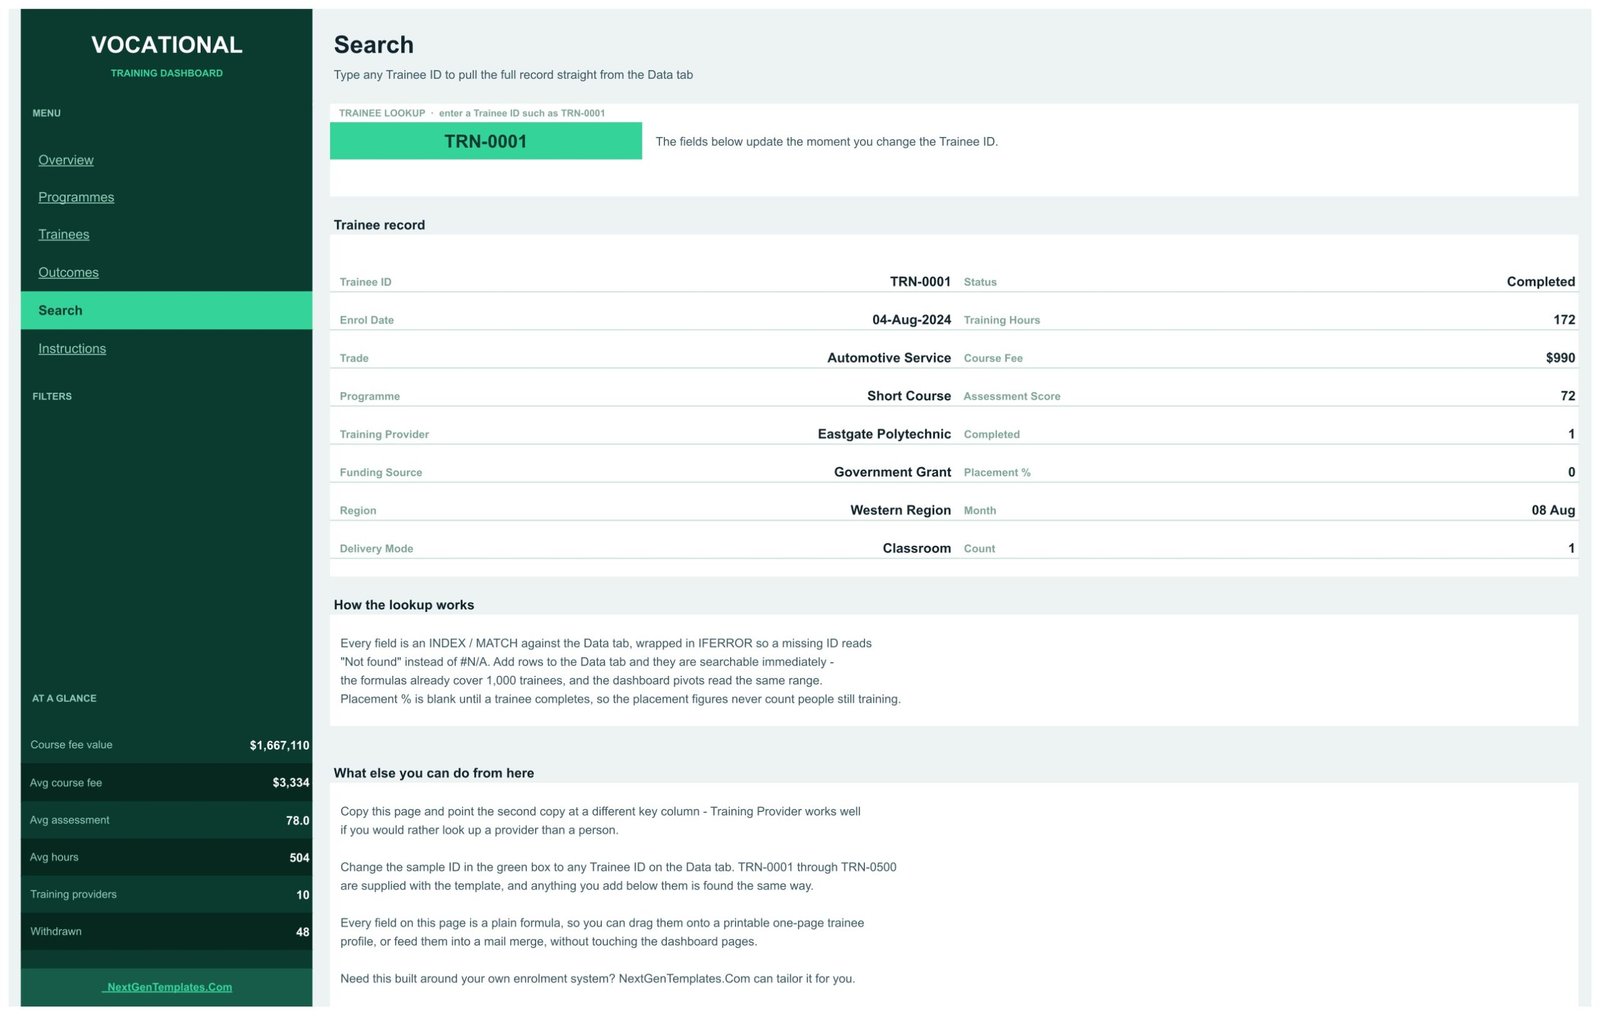
- A formula-only Trainee ID lookup. The Search page returns all 16 record fields through INDEX/MATCH wrapped in IFERROR – a missing ID reads “Not found” rather than #N/A. No Apps Script anywhere in the file.
- Placement maths that does not flatter itself. Placement % stays blank while a trainee is still in training, so the placement rate counts only people who have actually completed.
- Sixteen data columns, none of them personal. Trainees are identified by a code such as TRN-0142 – there is no name, date of birth, contact detail, employer, funding-eligibility flag or disciplinary column in the file.
Dashboard Pages Explanation
Overview
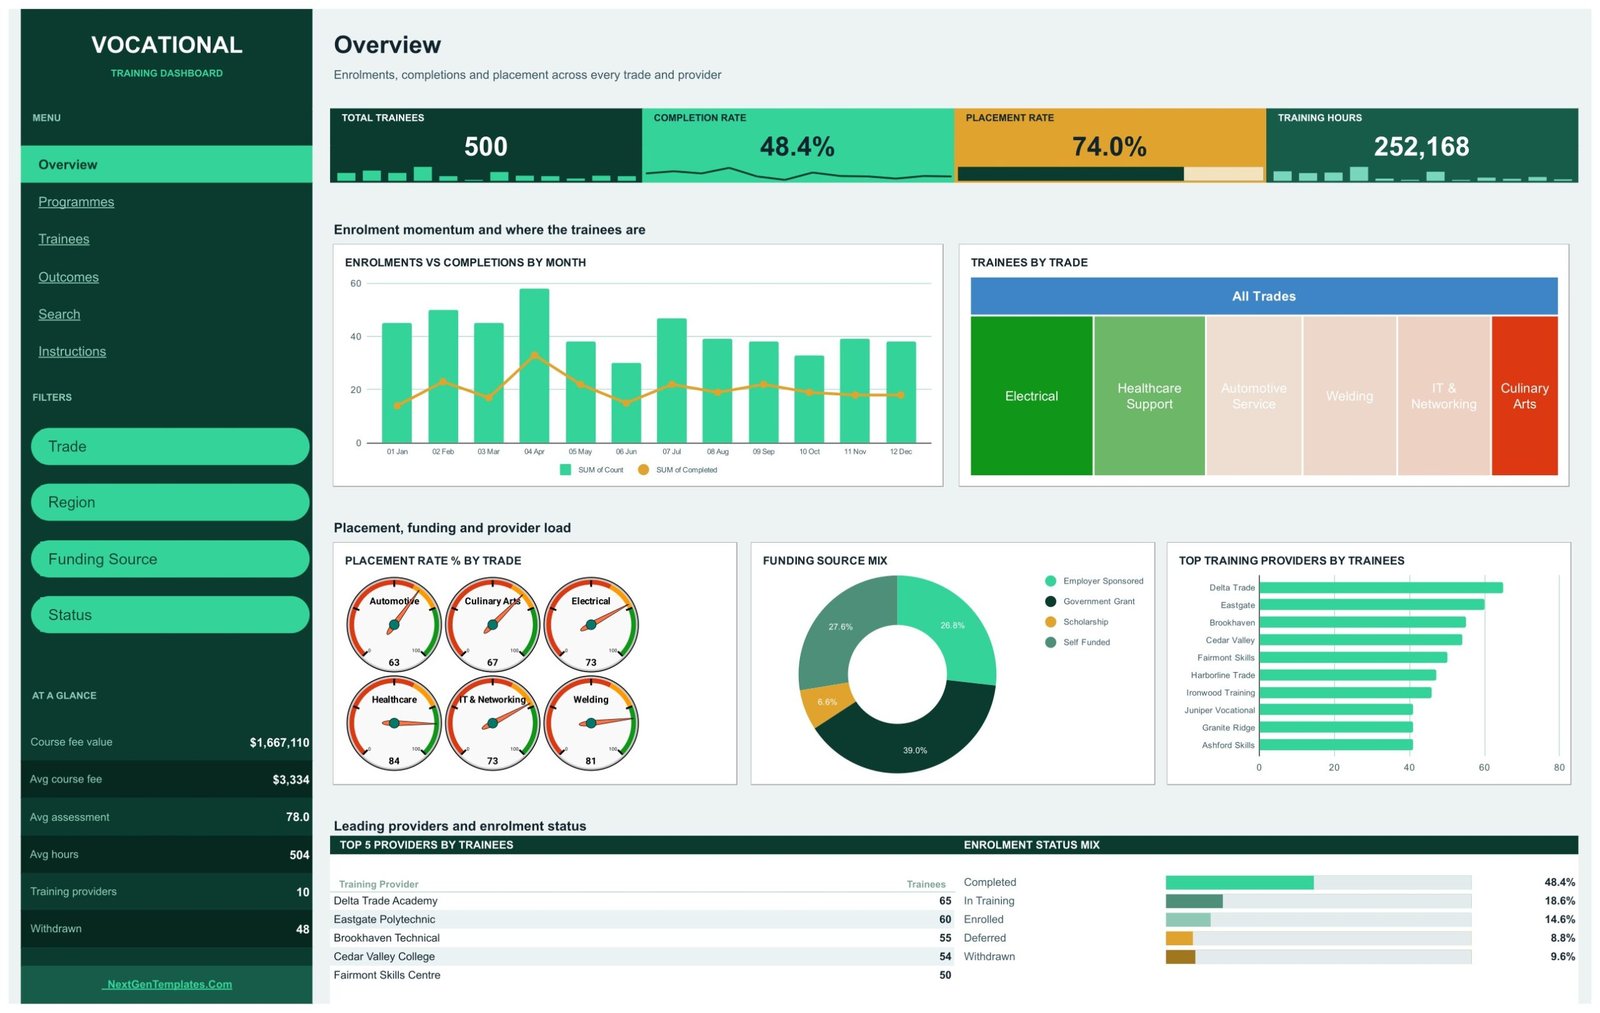
Enrolments, completions and placement across every trade and provider. The charts are Enrolments vs Completions by Month, Trainees by Trade, Placement Rate % by Trade as a six-dial gauge panel, Funding Source Mix, and Top Training Providers by Trainees, closed by a Top 5 Providers table and an Enrolment Status Mix bar panel. The gauges band placement below 60% red, 60-75% amber and above 75% green. Filters: Trade, Region, Funding Source, Status.
Programmes
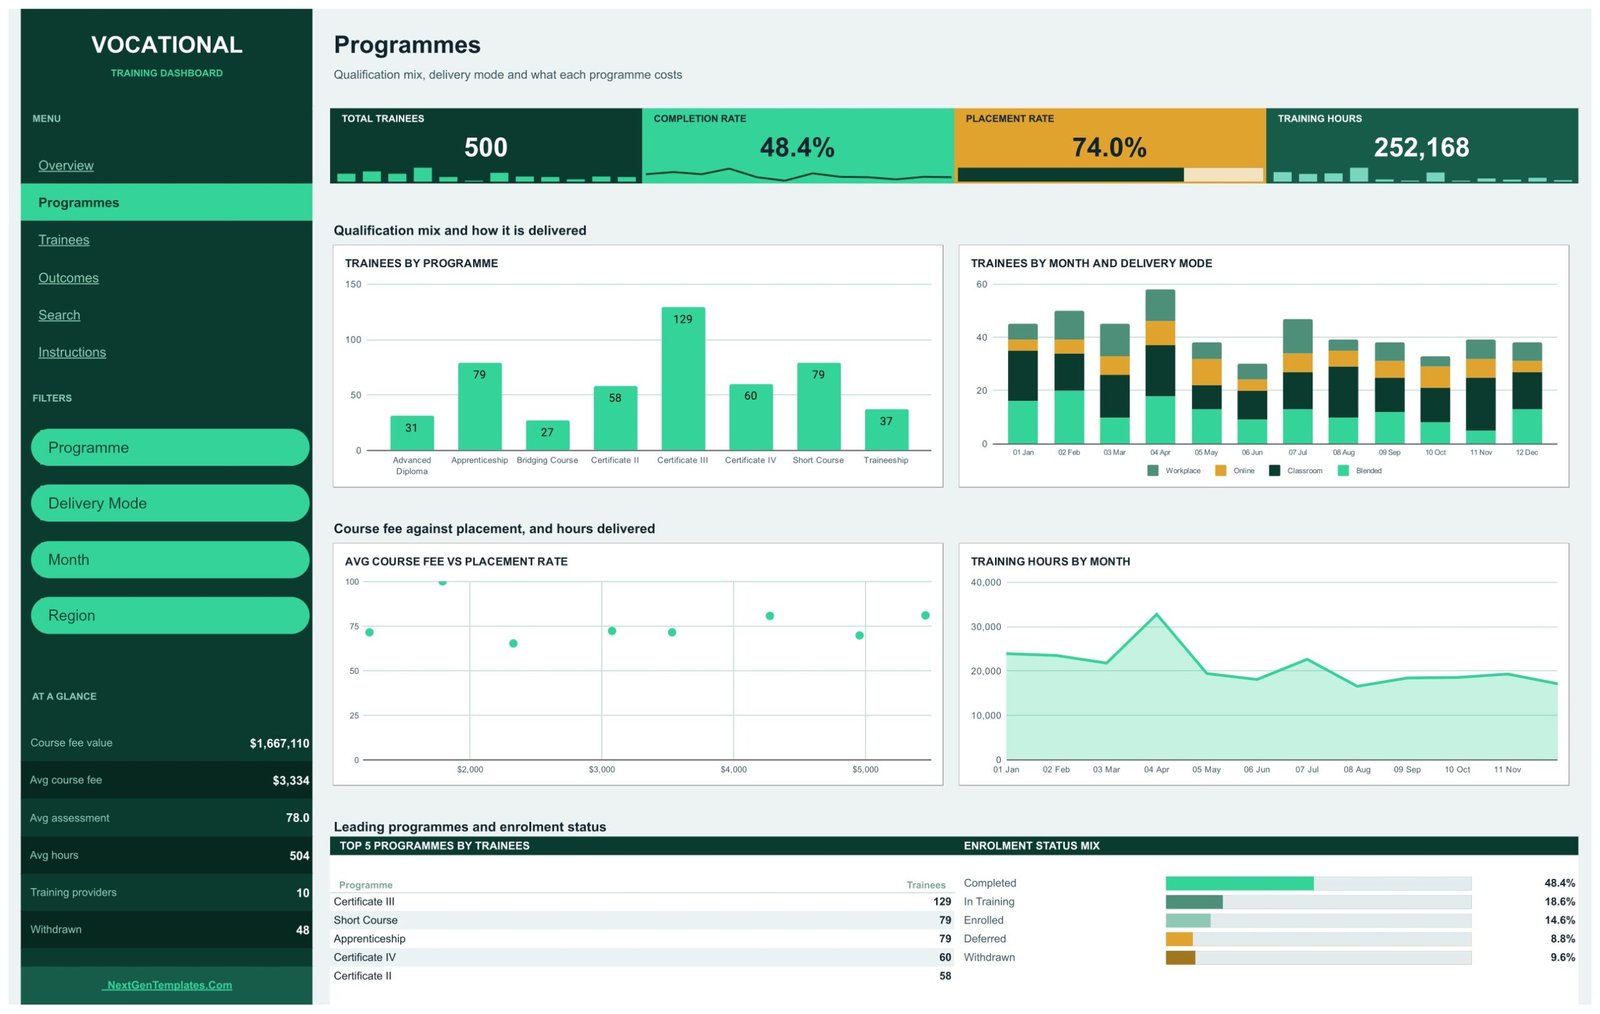
Qualification mix, delivery mode and what each programme costs. Charts: Trainees by Programme, Trainees by Month and Delivery Mode, Avg Course Fee vs Placement Rate, and Training Hours by Month, plus a Top 5 Programmes by Trainees table. In the sample, Certificate III is the largest programme at 129 trainees, with Short Course and Apprenticeship tied at 79. Filters: Programme, Delivery Mode, Month, Region.
Trainees
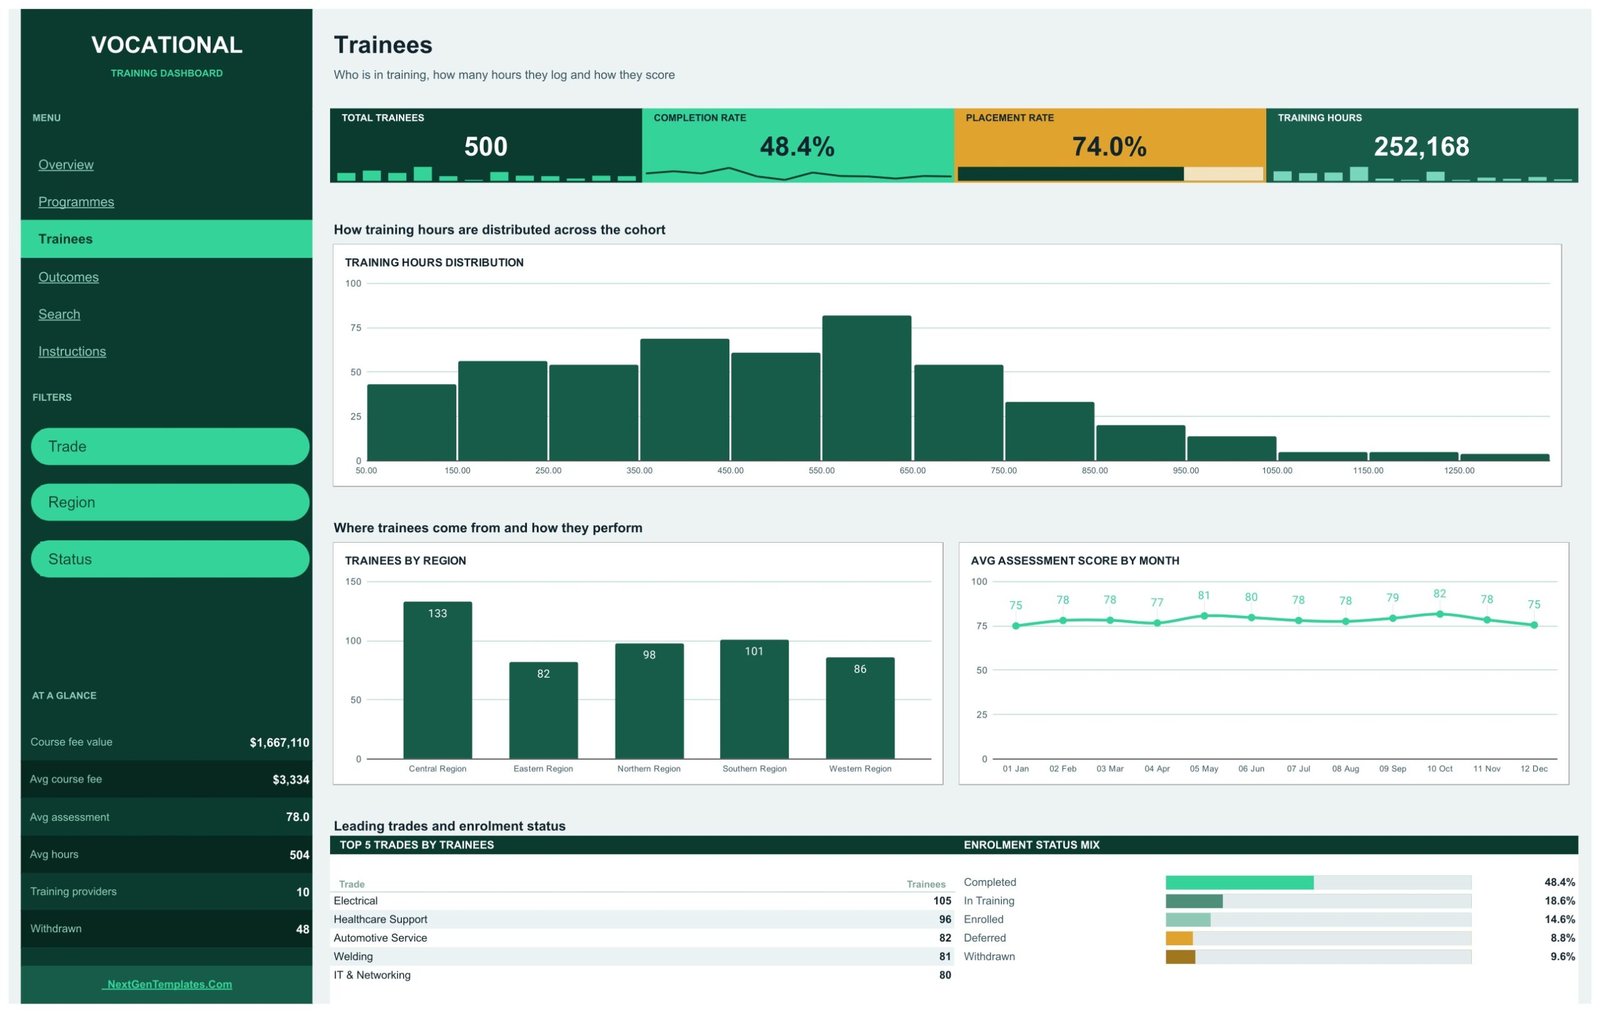
Who is in training, how many hours they log and how they score. Charts: Training Hours Distribution, Trainees by Region and Avg Assessment Score by Month, with a Top 5 Trades by Trainees table. This is the page that answers “are our cohorts evenly spread?” – in the sample, Central Region carries 133 trainees against Eastern Region’s 82. Filters: Trade, Region, Status.
Outcomes
Completions, placement and assessment results by trade and provider – the densest page, with six charts: Completions by Month, Placement Rate % by Region, Trainees by Status, Avg Assessment Score by Trade, Completions by Trade and Funding, and Avg Training Hours vs Avg Score. A Top 5 Trades by Completions table sits underneath. Filters: Trade, Training Provider, Funding Source, Month.
Search
Type any Trainee ID into the green box and the page pulls that record straight from the Data tab: Enrol Date, Trade, Programme, Training Provider, Funding Source, Region, Delivery Mode, Status, Training Hours, Course Fee, Assessment Score, Completed, Placement %, Month and Count. Sample IDs run TRN-0001 to TRN-0500. Because every field is a plain formula, you can copy the page and repoint it at Training Provider instead if you would rather look up a provider than a person.
Instructions
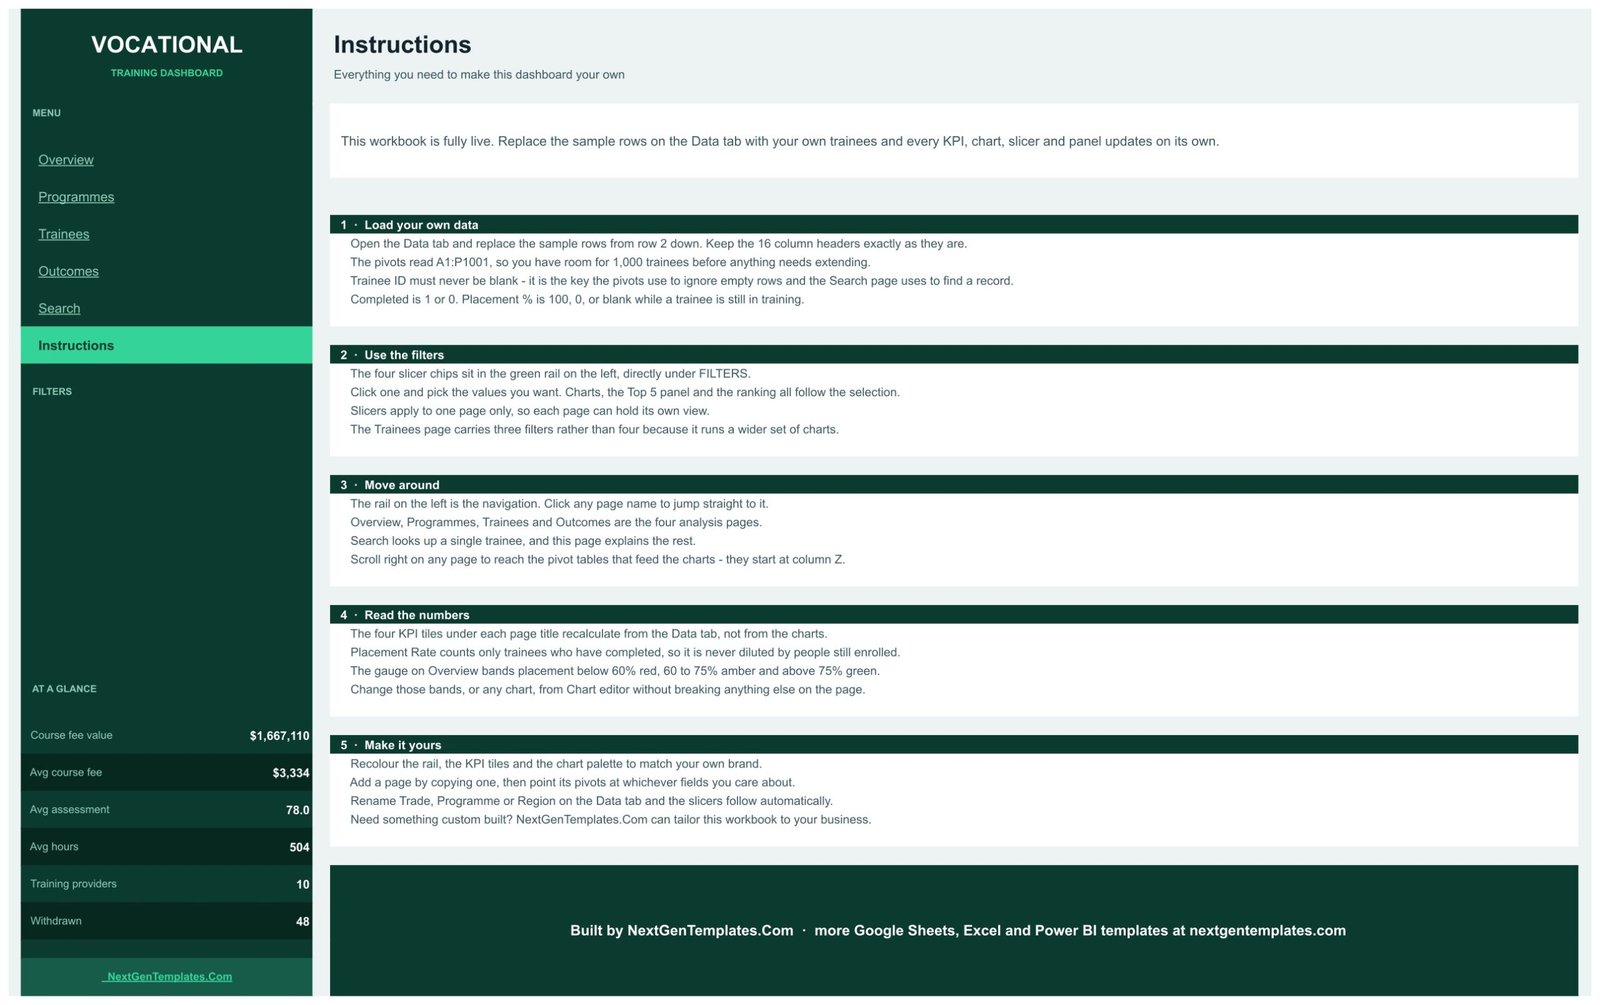
Five numbered sections: load your own data, use the filters, move around, read the numbers, make it yours. It states plainly that the pivots read A1:P1001, that Trainee ID must never be blank, and that the pivot tables feeding the charts start at column Z on every page – the detail you actually need when you start editing.
What the Data tab actually holds
Sixteen columns: Trainee ID, Enrol Date, Trade, Programme, Training Provider, Funding Source, Region, Delivery Mode, Status, Training Hours, Course Fee, Assessment Score, Completed, Placement %, Month, Count. That list is worth reading twice, because of what is not in it – no learner name, no date of birth, no address, phone or email, no employer, no funding-eligibility or benefits status, and no disciplinary record. The only identifier is a short code.
Keep it that way. A Google Sheet shared by link shows every row to whoever holds the link, so put your own internal reference in the Trainee ID column rather than a person’s name. If you need to get back to the individual, keep that mapping in your MIS where it belongs, behind proper access control.
Vocational Training Dashboard in Google Sheets vs. a Microsoft Excel build vs. a paid BI suite
| Feature | Vocational Training Dashboard in Google Sheets | Microsoft Excel dashboard build | Paid BI suite (Tableau / Power BI Pro) |
|---|---|---|---|
| Cost | $16.99 one-time (currently $9.99) ✅ | $0 if you build it yourself, plus your own hours | Per-user monthly licence, billed indefinitely |
| Platform | Google Sheets in the browser, no install ✅ | Microsoft Excel desktop | Desktop authoring plus a cloud service |
| Setup time | Under 10 minutes – paste over the sample rows ✅ | Days to model, chart and lay out from scratch | Hours to model, plus admin provisioning |
| Real-time team collaboration | Native, multiple editors at once ✅ | Co-authoring only via OneDrive/SharePoint | Yes, once every viewer is licensed ✅ |
| Mobile access | Google Sheets mobile app ✅ | Excel mobile, layout often breaks | Dedicated mobile app ✅ |
| Customisable fields | Rename any of the 16 Data columns; slicers follow ✅ | Yes, if you rewire the formulas yourself | Yes, through the semantic model |
| Share with a link | Yes – view-only or edit, no seat needed ✅ | File attachment or a cloud link | Viewer usually needs a paid seat |
| Year-1 cost at 5 users | $9.99 total ✅ | Existing Microsoft 365 seats | Five recurring licences for twelve months |
| Single-trainee record lookup | Built in on the Search page ✅ | Needs a lookup sheet you build | Drill-through, once modelled |
For training providers who want trade, provider and placement reporting on a link they can share with a manager tomorrow, the Vocational Training Dashboard in Google Sheets sits in the sweet spot.
One comparison we are deliberately not making: a student MIS or training-management system. That is a different category of software – it captures enrolments, registrations, attendance and evidence as they happen, day in and day out. This template reports on data you export from one. It is not an alternative to it, and putting the two side by side on price would be misleading.
Who Should Use This Template
Perfect for:
- Independent training providers and trade schools reporting on a few hundred to a few thousand trainees a year
- Apprenticeship and traineeship coordinators who need completion and placement split by trade, provider and funding source
- Skills programme managers rebuilding the same monthly board pack by hand
- Anyone who has to hand a manager a link rather than a file
Not a fit if:
- You need a learner record system, an e-portfolio or an assessment platform. This is a reporting workbook, not a system of record.
- You are preparing an awarding-body, regulator or funding-audit submission. This template makes no claim of compliance with any awarding organisation, regulator or funding body, and nothing in it is audit evidence.
- You want a live feed. It is static, with no connection to any MIS, enrolment portal or funding system – you refresh it by pasting a fresh export.
- You need row-level permissions, audit logs or SSO. Google Sheets sharing is all-or-nothing per file.
Real-World Use Cases
Marcus runs a 900-trainee trade school with four campuses. Each month he exports enrolments to CSV, pastes them over the Data tab and screenshots the Outcomes page for his board. Completions by Month, Placement Rate % by Region and the Top 5 Trades by Completions table answer the three questions the board always asks – he does not touch a chart.
Priya coordinates apprenticeships for a regional skills partnership. She sets the Outcomes page’s Training Provider slicer to one provider at a time and sends each of them a view-only link to their own numbers. The conversation about completion rates then starts from the same figures on both sides of the table.
Tom manages employer-sponsored intakes at a polytechnic. He isolates Employer Sponsored trainees with the Funding Source slicer on Overview, reads the placement gauges by trade, then jumps to Search to pull one trainee’s full record when a sponsor asks about a specific enrolment.
Advantages of the Vocational Training Dashboard in Google Sheets
The obvious saving is time: a monthly pack that took an afternoon becomes a paste and a screenshot. The less obvious one is consistency. Because every KPI recalculates from the Data tab rather than being typed into a slide, two people reading the same file in different weeks get numbers derived the same way.
Cost is the other lever. A browser-based workbook shared read-only costs nothing per additional viewer, which matters when the audience is a board, a funding partner and eight provider contacts who each want to see one page occasionally. And because everything is native Google Sheets – pivot tables, slicers and standard chart types, no Apps Script – anyone on your team who knows Sheets can maintain it.
Opportunities for Improvement
It is worth being straight about the limits. The workbook is static: there is no live link to an enrolment system, so it is only as current as your last paste. The formulas cover 1,000 trainees out of the box, and beyond that you extend ranges yourself. Slicers apply to a single page, which is a feature when you want independent views and an annoyance when you want one filter to drive all four pages.
Google Sheets sharing is also coarse – a viewer sees every tab you share, including the Data tab. If different audiences must see different subsets, publish separate filtered copies rather than trying to hide rows. And the placement gauges use fixed bands; if your service measures placement differently, change the bands in the Chart editor before anyone reads them as a verdict.
Best Practices
- Put an internal code in Trainee ID, never a person’s name, and keep the code-to-person mapping in your MIS.
- Never leave Trainee ID blank – it is the key the pivots use to ignore empty rows and the Search page uses to find a record.
- Keep Completed strictly 1 or 0, and leave Placement % blank while a trainee is still training rather than entering 0.
- Keep one master copy and share view-only duplicates outward, so nobody edits the file you report from.
- Recolour the rail, KPI tiles and chart palette once, at the start, so every screenshot you circulate looks like your organisation’s.
- Review the gauge bands and the assessment thresholds against your own definitions before the first circulation.
Explore Relevant Templates
- Vocational Training Dashboard in Google Sheets – the template described in this post.
- Also available as: Vocational Training Dashboard in Excel and Vocational Training Dashboard in Power BI.
- Vocational Training KPI Dashboard in Google Sheets – a different product: a month-picker KPI scorecard with traffic lights and trend pages, not the analytical pages covered here.
- Education Services Dashboard in Google Sheets – the broader education-provider view.
- Primary Schools Dashboard in Google Sheets – the school-sector sibling in the same series.
- Browse the full Google Sheets Dashboards range.
Related Templates
More related walkthroughs on this blog: Training and Development Dashboard in HTML, Professional Training and Coaching Dashboard in Google Sheets and Music School Dashboard in Google Sheets. Each is a separate template with its own layout and sample data.
To learn the pivot table and chart skills behind a dashboard like this, try the Excel Pivot Tables & Dashboards course on NextGenTemplates Academy, which comes with practice files.
Get the Vocational Training Dashboard in Google Sheets
Frequently Asked Questions
What KPIs does the Vocational Training Dashboard in Google Sheets track?
The Vocational Training Dashboard in Google Sheets tracks four headline KPIs – Total Trainees, Completion Rate, Placement Rate and Training Hours – plus six standing figures in the side rail: course fee value, average course fee, average assessment score, average hours, training provider count and withdrawn count.
How long does setup take?
Under ten minutes. Open the Data tab, paste your rows from row 2 down and keep the 16 headers unchanged. The formulas in the Vocational Training Dashboard in Google Sheets already cover 1,000 trainees, so nothing needs extending before the charts redraw.
Does it store learner names or personal details?
No. The Data tab has 16 columns and none holds a name, date of birth, contact detail, employer, funding-eligibility flag or disciplinary note. Trainees appear only as a code such as TRN-0142, and we recommend keeping your own data pseudonymous in the Vocational Training Dashboard in Google Sheets the same way.
Can I use it for a funding claim or an awarding-body return?
No. The Vocational Training Dashboard in Google Sheets is a business reporting template. It is not a learner record system, an e-portfolio or a funding-claim system, and it makes no claim of compliance with any awarding organisation, regulator or funding-body requirement.
Does it connect to my student MIS?
No. The Vocational Training Dashboard in Google Sheets is a static workbook with no live connection to any system. You refresh it by pasting a fresh export over the Data tab, which keeps the file entirely under your own control.
How does this compare to a paid BI suite?
A paid BI suite charges a licence per viewer every month and needs a model built first. The Vocational Training Dashboard in Google Sheets is a one-time purchase, opens in a browser and can be shared view-only by link. For a few hundred to a few thousand trainees it does the same reporting job.
Can I add more than 500 trainees?
Yes. The pivots and Search formulas read A1:P1001, so the Vocational Training Dashboard in Google Sheets has room for 1,000 trainees out of the box. Past that, extending the ranges is an ordinary Google Sheets edit rather than a rebuild.
About the Author
Built by PK – Microsoft Certified Professional with 15+ years of Excel, Google Sheets and Power BI experience. Founder of NextGenTemplates, reaching 300K+ subscribers across YouTube channels. Every template is hand-built and tested before release.
Conclusion
If you run vocational programmes and your monthly reporting is still a manual rebuild, the Vocational Training Dashboard in Google Sheets replaces it with a paste. Six tabs, four KPIs, 17 charts, 15 slicer chips and a formula-only trainee lookup – built for reporting, honest about being static, and deliberately free of personal data columns.
Instant download · One-time payment · No subscription
Last updated: September 2026