Tracking educational performance across multiple metrics can quickly become complex—especially when data is scattered across files or reported manually. That is why the Education KPI Scorecard in Google Sheets is a powerful, ready-to-use template designed to simplify performance monitoring for schools, colleges, training institutes, and education administrators.
This scorecard brings all critical education KPIs into one interactive, easy-to-use Google Sheets solution.
What Is the Education KPI Scorecard in Google Sheets?
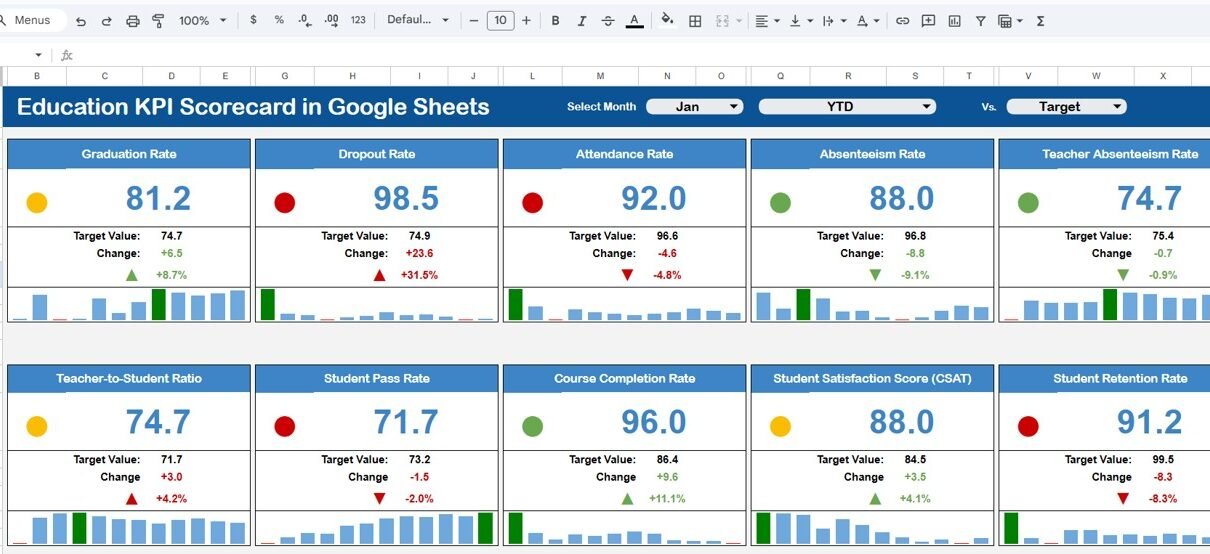
The Education KPI Scorecard in Google Sheets is a structured performance management template that tracks 10 key education KPIs using dynamic calculations, visual indicators, and trend analysis.
With a month selector at the top, you can instantly switch between months. As soon as the month changes:
-
All KPI values update automatically
-
Traffic-light colors adjust (Green / Amber / Red)
-
Up and down arrows reflect percentage changes
-
You can toggle between MTD (Month-to-Date) and YTD (Year-to-Date) views
This makes the scorecard ideal for both operational monitoring and strategic reporting.
Key Features of the Education KPI Scorecard
Click to Buy Education KPI Scorecard in Google Sheets
Education KPIs in One Scorecard
The scorecard is designed to display 10 essential KPIs such as:
-
Student enrollment performance
-
Attendance rate
-
Course completion rate
-
Assessment performance
-
Faculty utilization
-
Student satisfaction
-
Dropout ratio
-
Training effectiveness
-
Resource utilization
-
Compliance or accreditation KPIs
Monthly Selector with MTD & YTD View
-
Select any month from the dropdown at the top
-
Instantly switch between MTD and YTD performance
-
All calculations and visuals update automatically
This ensures consistent monthly and yearly performance tracking.
Traffic Lights & Trend Indicators
Each KPI includes:
-
Conditional formatting (traffic light colors)
-
Up and down arrows for percentage change
-
Clear visual signals for underperformance or improvement
Decision-makers can identify issues at a glance.
Sheet Tabs Explained
Click to Buy Education KPI Scorecard in Google Sheets
Scorecard / Dashboard Sheet
This is the main scorecard view where all 10 KPIs are displayed together with:
-
Actual values
-
Target comparison
-
Percentage variance
-
Traffic-light indicators
-
MTD and YTD toggle
Perfect for leadership reviews and performance meetings.

Click to Buy Education KPI Scorecard in Google Sheets
Trend Sheet Tab
The Trend Sheet provides detailed KPI trend analysis.
Key elements:
-
KPI selector dropdown (available in cell C3)
-
KPI Group
-
Unit of KPI
-
KPI Type (Lower the Better / Upper the Better)
This sheet helps analyze how individual KPIs perform over time.

Click to Buy Education KPI Scorecard in Google Sheets
KPI Definition Sheet Tab
This sheet acts as the foundation of the scorecard.
Here you define:
-
KPI Name
-
KPI Group
-
Unit (%, Number, Ratio, Score, etc.)
-
KPI Formula
-
KPI Definition
This ensures clarity, consistency, and governance across all KPI calculations.

Click to Buy Education KPI Scorecard in Google Sheets
Data Input Sheet Tab
The Data Input sheet is where you enter raw KPI data.
-
Input monthly actual values
-
Data feeds directly into MTD and YTD calculations
-
No formulas need to be touched
This makes the scorecard user-friendly even for non-technical users.

Click to Buy Education KPI Scorecard in Google Sheets
Colour Settings Sheet
The Colour Settings sheet allows you to:
-
Customize traffic-light thresholds
-
Adjust color logic for KPIs
-
Maintain consistent visual standards
This is especially useful when aligning with institutional performance benchmarks.

Click to Buy Education KPI Scorecard in Google Sheets
Advantages of the Education KPI Scorecard
-
Centralized education performance tracking
-
Saves time with automated calculations
-
Clear visual indicators for quick decisions
-
Easy month-to-month comparison
-
Fully cloud-based in Google Sheets
-
Suitable for administrators, principals, and academic leaders
Opportunities for Improvement
Click to Buy Education KPI Scorecard in Google Sheets
-
Add student-level drill-down dashboards
-
Set automated alerts for KPI threshold breaches
-
Integrate academic calendar-based comparisons
-
Connect with Google Forms or LMS data sources
Best Practices for Using the Scorecard
-
Update data consistently every month
-
Define KPIs clearly in the KPI Definition sheet
-
eview both MTD and YTD views in meetings
-
Use Trend Sheet for root-cause analysis
-
Align traffic-light thresholds with academic goals
Who Can Use This Template?
Click to Buy Education KPI Scorecard in Google Sheets
-
Schools & Colleges
-
Universities & Academic Departments
-
Training & Coaching Institutes
-
Education Consultants
-
EdTech Operations Teams
Any education organization that tracks performance using KPIs will benefit from this scorecard.
Final Thoughts
The Education KPI Scorecard in Google Sheets is a simple yet powerful performance management tool for the education sector. It combines structured KPI definitions, automated calculations, and intuitive visuals into one ready-to-use template.
Visit our YouTube channel to learn step-by-step video tutorials
Youtube.com/@NeotechNavigators
Watch the step-by-step video tutorial: