Employee Turnover Dashboard in HTML is a comprehensive, browser-based analytics template designed for HR professionals who want to track, analyze, and reduce employee attrition across their organization. Built with interactive charts, KPI cards, slicer filters, and a detailed data view, this HTML dashboard delivers enterprise-grade turnover analytics without requiring any software installation. Simply unzip and open in your browser to start analyzing workforce trends immediately.
This template is part of the growing collection of HTML Dashboard Templates at NextGenTemplates.com — offering plug-and-play analytics solutions for every business domain. Whether you are tracking employee retention, analyzing exit interview data, or monitoring departmental performance, this dashboard covers it all in 5 focused pages.
👉 Click here to Purchase the Employee Turnover Dashboard in HTML
Key Features of Employee Turnover Dashboard in HTML
The Employee Turnover Dashboard in HTML packs a wide range of features into a single, easy-to-use browser-based template. Here is what makes it stand out:
- 5 Interactive Dashboard Pages — Overview, Attrition Analysis, Department Insights, Workforce Demographics, and Data View provide a 360-degree view of employee turnover
- 6 High-Level KPI Cards — Total Employees, Turnover Rate, Avg Tenure (Yrs), Avg Satisfaction, Active Employees, and Avg Monthly Salary are displayed on the overview page for instant insights
- 20+ Dynamic Charts and Visualizations — From turnover by department to satisfaction score distribution, every key HR metric is covered with interactive visuals
- Multiple Slicer Filters — Filter the entire dashboard by department, gender, location, or time period to zero in on specific workforce segments
- Full Data Table with Search, Sort, and Export — The Data View page lets you browse all employee records, search by keyword, sort columns, paginate results, and export filtered data to CSV
- Zero Installation Required — Open index.html in any modern browser (Chrome, Edge, Firefox, Safari) and the dashboard is ready to use
- Easy Data Replacement — Swap the included sample dataset with your own employee records and all charts, KPIs, and tables update automatically
- Responsive and Professional Design — Clean layout with intuitive tab-based navigation for switching between dashboard pages
Dashboard Pages Explanation
The Employee Turnover Dashboard in HTML is organized into 5 distinct pages, each focusing on a different dimension of workforce turnover analytics. Let’s walk through every page in detail.
1. Overview Page
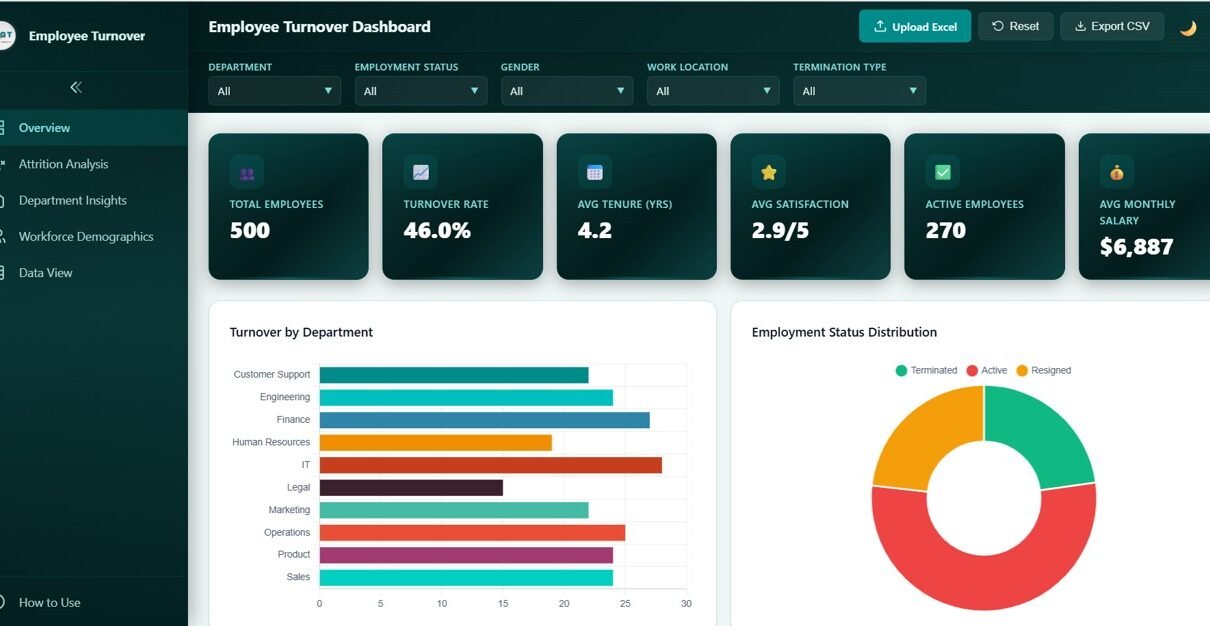
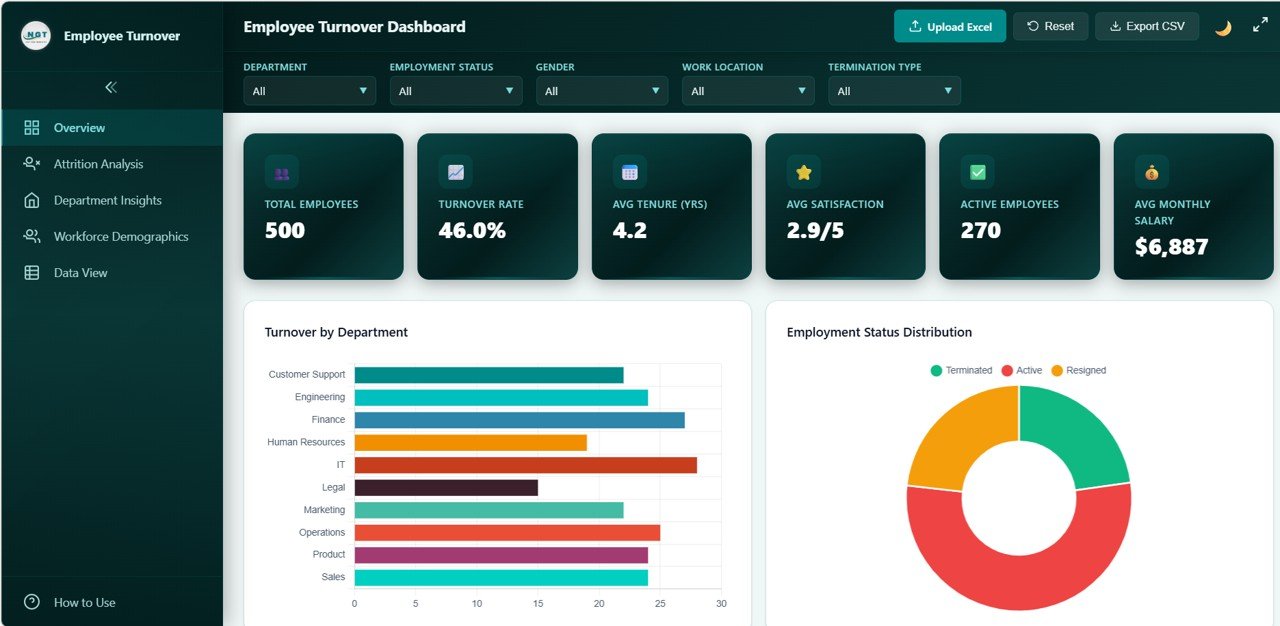
The Overview Page serves as the main landing page and provides a high-level summary of your organization’s workforce health. At the top, you will see 6 KPI cards displaying Total Employees, Turnover Rate, Avg Tenure (Yrs), Avg Satisfaction, Active Employees, and Avg Monthly Salary. These cards give you an immediate pulse check on your workforce.
Below the KPI cards, the page features several interactive charts that break down turnover patterns from multiple angles. Turnover by Department reveals which departments are losing the most employees. Employment Status Distribution shows the split between active and terminated staff. Termination Reasons Breakdown highlights the top reasons employees leave. Turnover Trend by Hire Year uncovers hiring cohort patterns over time. Gender Distribution presents the male-to-female ratio across your organization. Multiple slicer filters allow you to apply quick filters and see the dashboard update in real time.
Employee Turnover Dashboard Overview
2. Attrition Analysis
The Attrition Analysis page provides a deeper look into why and how employees are leaving your organization. This page features charts covering Termination Type by Department, which distinguishes between voluntary and involuntary exits across each team. Termination Reasons by Gender reveals whether men and women leave for different reasons. Satisfaction Score Distribution shows how satisfied departing employees were before they left. Turnover by Tenure Range identifies at what point in their career employees are most likely to quit. Attrition by Work Location compares turnover rates between on-site, remote, and hybrid workers, helping you tailor retention strategies by location.
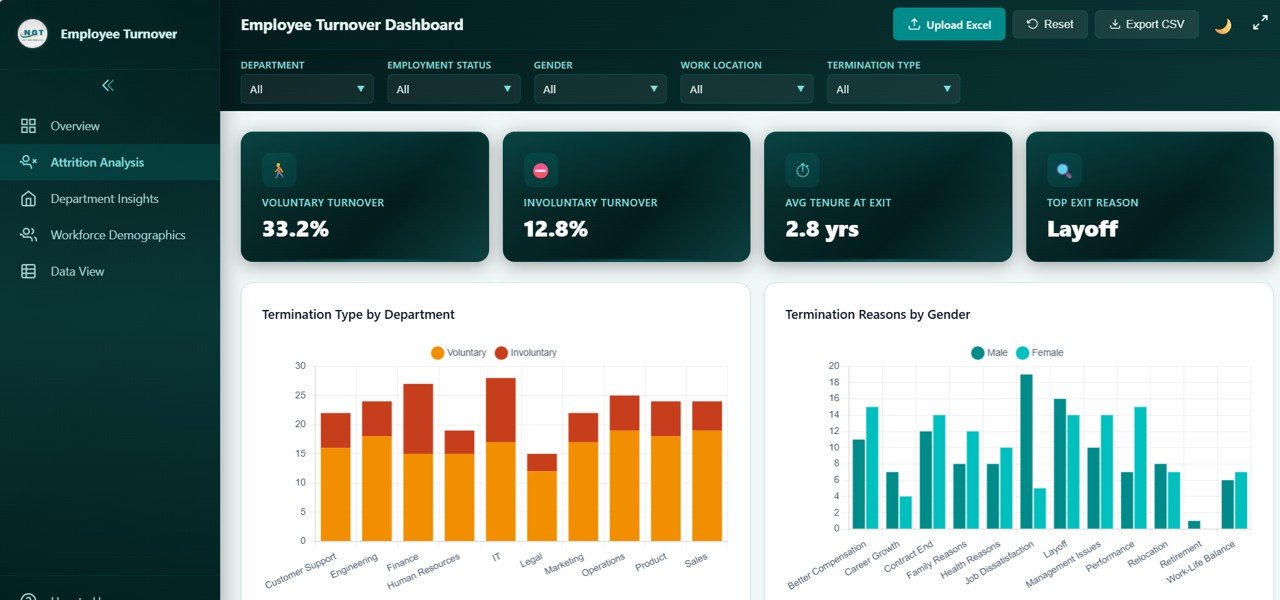
Attrition Analysis
3. Department Insights
The Department Insights page enables you to compare departments side-by-side on key workforce metrics. Department Headcount shows the size of each team. Avg Salary by Department lets you see compensation differences across the organization. Avg Satisfaction by Department surfaces which teams are happiest — and which need attention. Performance Rating by Department compares average performance scores, helping you identify high-performing and underperforming teams. Overtime Hours by Department highlights departments where employees may be overworked, which is often a leading indicator of future attrition.
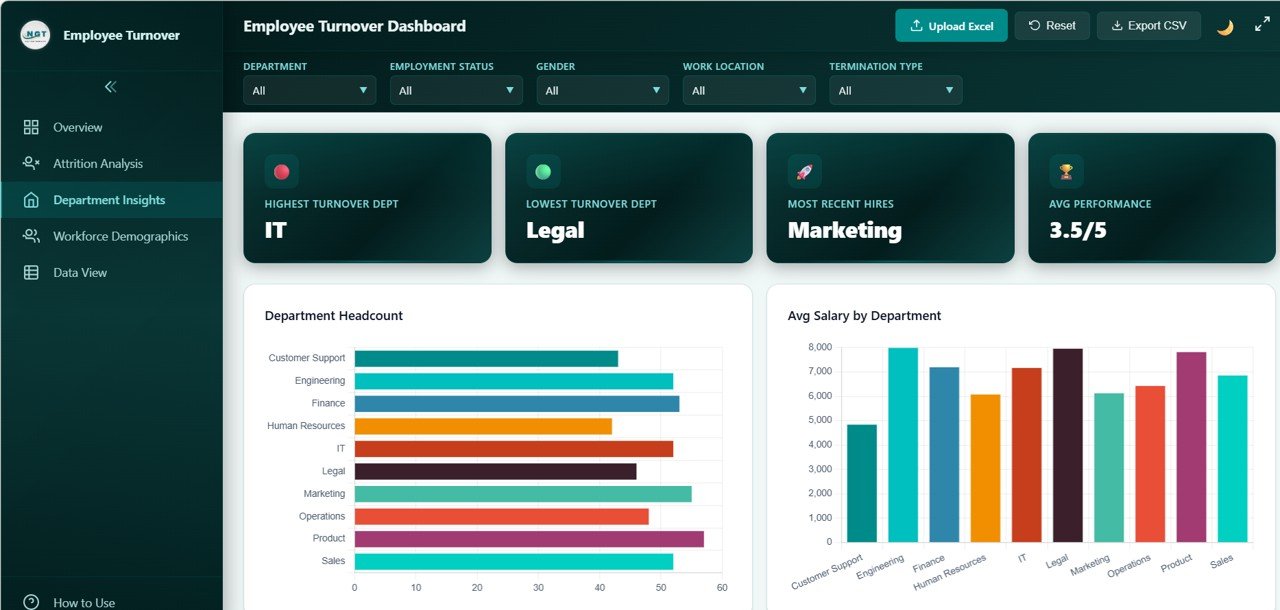
Department Insights
4. Workforce Demographics
The Workforce Demographics page gives you a comprehensive view of your employee population’s composition. Age Distribution breaks down employees by age group to help with succession planning. Education Level Distribution shows the academic qualifications across your workforce. Marital Status Distribution provides demographic context for benefits planning. Avg Salary by Education Level reveals whether compensation aligns with educational attainment. Training Hours by Department highlights which teams are investing in employee development and which may need more training resources.
👉 Click here to Purchase the Employee Turnover Dashboard in HTML
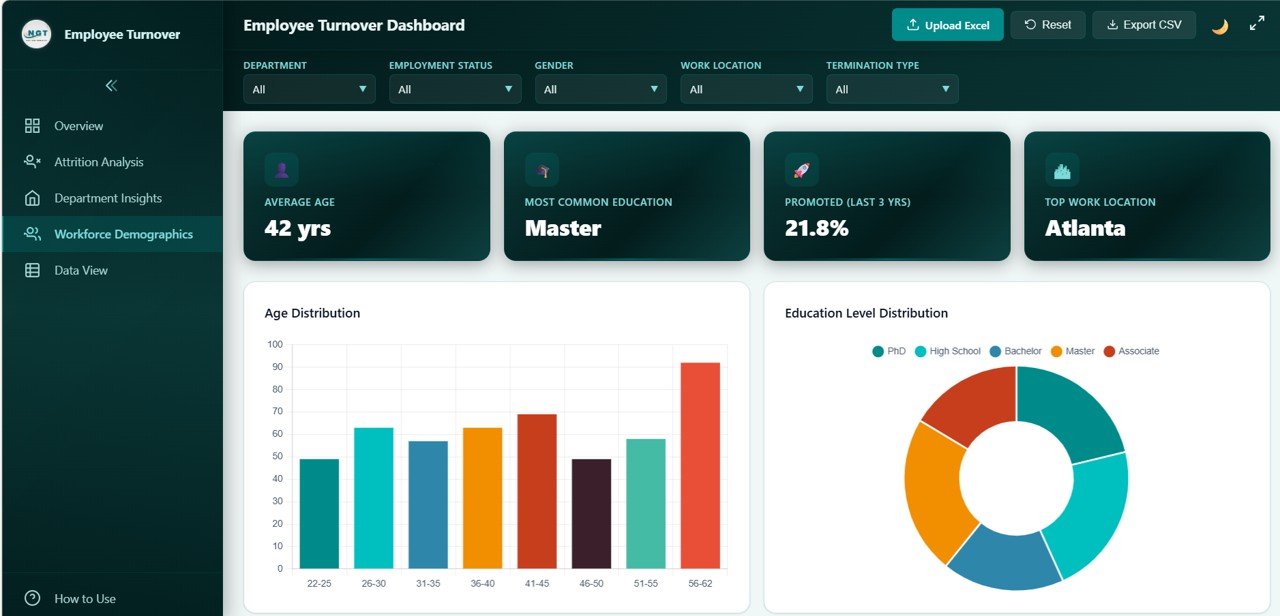
Workforce Demographics
5. Data View
The Data View page is a detailed data table where you can see all employee records at a granular level. It includes search functionality to quickly find specific employees, sortable columns for organizing data by any field, pagination for navigating through large datasets, and a CSV export button for downloading filtered data to use in Excel or other tools. This page is especially useful for audits, compliance reviews, and ad-hoc analysis when you need to drill into individual records.
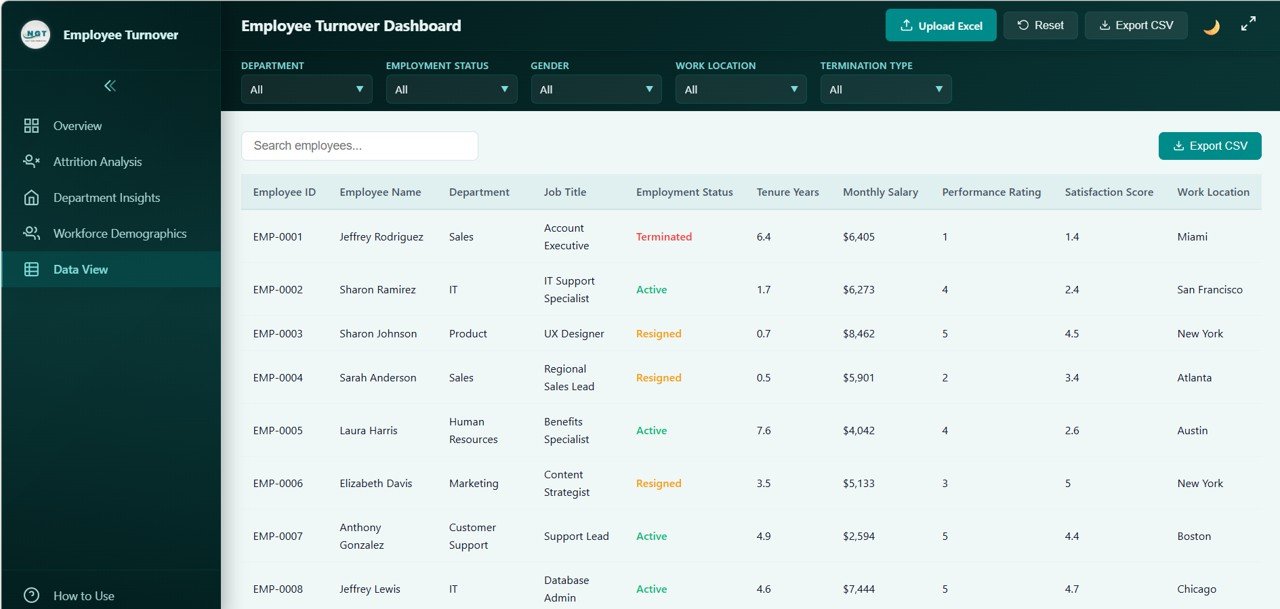
Data View
Advantages of Employee Turnover Dashboard in HTML
There are several reasons why this HTML-based turnover dashboard stands out as a valuable tool for HR teams:
- No software dependency — Unlike Excel or Power BI dashboards, this template runs in any web browser with zero installation, making it accessible to anyone in your organization
- Instant insights — With 6 KPI cards and 20+ charts across 5 pages, you get a complete picture of your turnover landscape without building anything from scratch
- Actionable analytics — By combining attrition analysis, department comparisons, and demographic breakdowns, you can pinpoint exactly where and why employees are leaving
- Data privacy — Since the dashboard runs locally in your browser, your employee data never leaves your computer or network
- Time savings — Replace sample data with your own and the entire dashboard updates automatically — no formulas to configure, no pivot tables to build
- Professional presentation — The modern, clean design makes it easy to share insights with leadership during quarterly business reviews or board presentations
Opportunities for Improvement
While this dashboard provides a robust foundation for employee turnover analytics, there are a few areas where you could enhance it further based on your specific needs:
- Predictive analytics — Adding a predictive model or risk score could help identify employees who are most likely to leave in the next quarter
- Benchmark comparisons — Incorporating industry benchmark data would allow you to compare your turnover rate against sector averages
- Time-period filters — While slicers are available, adding a date range picker for custom time windows would provide even more flexibility
- Cost of turnover — Integrating estimated replacement costs per role could quantify the financial impact of attrition for leadership
- Integration with HRIS — Connecting the dashboard to live data feeds from systems like BambooHR, Workday, or SAP would enable real-time monitoring
Best Practices for Using the Employee Turnover Dashboard
To get the maximum value from this template, follow these best practices:
- Update data regularly — Refresh your employee dataset at least monthly to ensure the dashboard reflects current trends
- Use slicer filters strategically — Combine multiple filters (e.g., department + gender) to uncover hidden patterns in your turnover data
- Share with stakeholders — Since the dashboard runs in a browser, you can easily share the file with department heads or C-suite executives for review
- Track changes over time — Save snapshots of your dashboard data each quarter to build a historical trend library for year-over-year comparisons
- Combine with exit interviews — Use the attrition analysis page alongside qualitative exit interview data for a complete picture of why employees leave
- Leverage the Data View for audits — The search, sort, and CSV export features make the Data View page ideal for compliance audits and detailed record checks
Explore Relevant Templates
If you found this Employee Turnover Dashboard useful, you might also want to explore these related templates from NextGenTemplates:
- Workforce Engagement Dashboard in Google Sheets — Track employee engagement scores, participation rates, and satisfaction metrics with an interactive Google Sheets dashboard
- Employee Retention Dashboard in Power BI — Advanced retention analytics with drill-through visuals and Power BI’s powerful data modeling capabilities
- Exit Interview KPI Dashboard in Google Sheets — Analyze exit interview feedback with KPI tracking and reason-based breakdowns
- Employee Retention KPI Dashboard in Google Sheets — Monitor retention KPIs like tenure distribution, department-level retention rates, and new hire survival curves
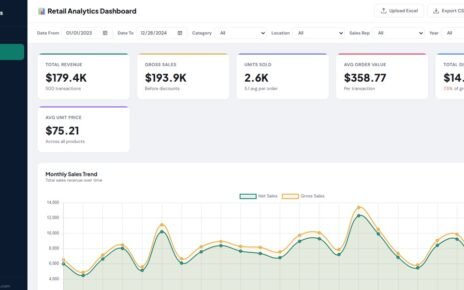
- Office Utilization Dashboard in HTML — Another powerful HTML dashboard for tracking workspace usage and facility management
Frequently Asked Questions
👉 Click here to Purchase the Employee Turnover Dashboard in HTML
What is the best HTML dashboard template for tracking employee turnover?
The Employee Turnover Dashboard in HTML from NextGenTemplates is one of the most comprehensive browser-based HR analytics tools available. It includes 5 interactive pages, 6 KPI cards, 20+ charts, slicer filters, and CSV export — covering everything from attrition analysis to workforce demographics in a single template.
How do I use the Employee Turnover Dashboard in HTML?
Simply download and unzip the file, then open index.html in any modern browser like Chrome, Firefox, Edge, or Safari. Replace the sample data file with your own employee records, and all KPI cards, charts, and tables will update automatically. No additional software is needed.
What KPIs are tracked in the Employee Turnover Dashboard?
The dashboard tracks 6 key KPIs on the overview page: Total Employees, Turnover Rate, Avg Tenure (Yrs), Avg Satisfaction, Active Employees, and Avg Monthly Salary. It also provides 20+ analytical charts across attrition analysis, department insights, and workforce demographics pages.
Can I customize this HTML turnover dashboard with my own data?
Yes. The template includes a data file with sample records. Replace this file with your own employee data — including fields like department, termination reason, satisfaction score, tenure, education level, and salary — and the entire dashboard refreshes automatically.
Who should use this Employee Turnover Dashboard?
This dashboard is designed for HR Managers, CHROs, People Analytics teams, HR Business Partners, consultants, and educators. Anyone who needs to analyze workforce turnover patterns, present attrition findings to leadership, or develop data-driven retention strategies will benefit from this template.
Is the Employee Turnover Dashboard in HTML free to download?
The Employee Turnover Dashboard in HTML is available as a premium template on NextGenTemplates.com at a regular price of $29.99 and a current sale price of $21.99. It includes 5 dashboard pages, sample data, and complete documentation.
Conclusion
The Employee Turnover Dashboard in HTML is a must-have analytics tool for any HR professional looking to understand, track, and reduce employee attrition. With 5 interactive pages, 6 KPI cards, 20+ dynamic charts, slicer filters, and a full data table with search and CSV export, it provides everything you need to make data-driven workforce decisions — all from the convenience of your web browser.
Whether you are an HR Manager preparing a quarterly turnover report, a CHRO presenting workforce insights to the board, or a People Analytics specialist digging into attrition patterns, this template gives you the power to act on your data instead of just collecting it.
👉 Click here to Purchase the Employee Turnover Dashboard in HTML
🎥 For step-by-step video tutorials on how to use this and other dashboard templates, visit our YouTube channel:
👉 Youtube.com/@NeoTechNavigators