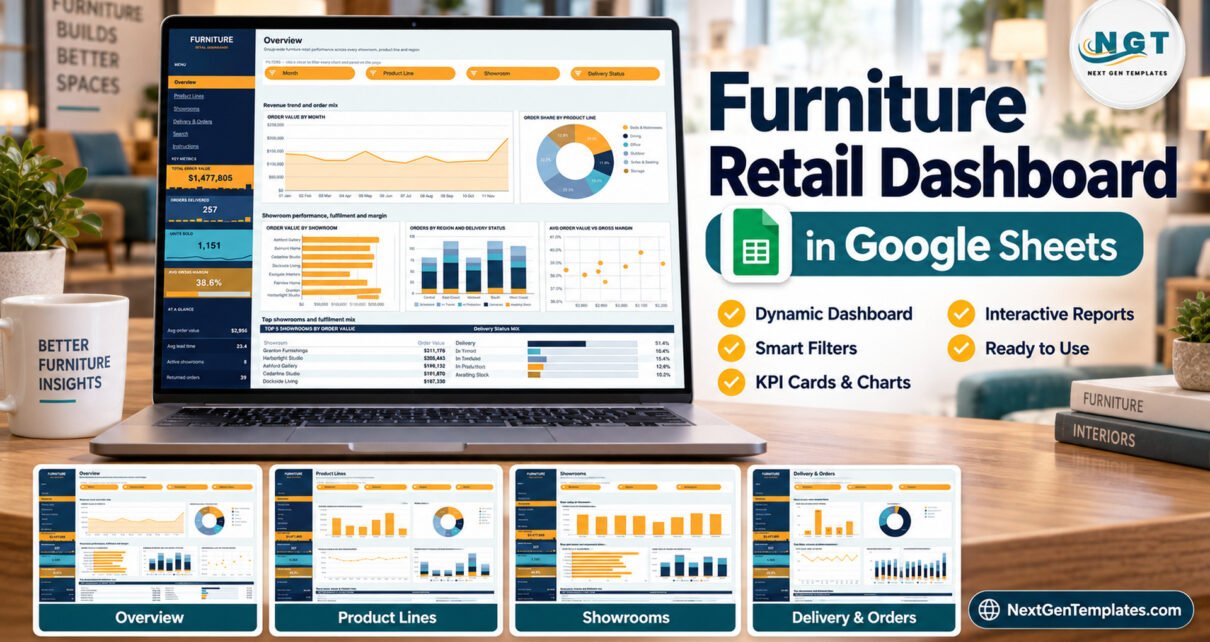
The Furniture Retail Dashboard in Google Sheets turns 500 sample orders into 6 linked pages, 18 pivot-backed charts and 15 slicers, reporting $1,477,805 of order value, 1,151 units sold, 257 delivered orders and a 38.6% average gross margin. The pivots already read 1,000 rows, so most independent retailers can paste a full year of orders in without touching a formula.
Furniture retail is unusually hard to read from a sales export. One sofa order can be worth more than forty small accessories, lead times run into weeks rather than days, and an order can sit in production long after the customer has paid. A raw order list hides all of that. This workbook puts order value, margin, delivery stage and lead time on the same screen, sliceable by showroom, salesperson, product line, material, region and month.
Get the Furniture Retail Dashboard in Google Sheets

Key Features of the Furniture Retail Dashboard in Google Sheets
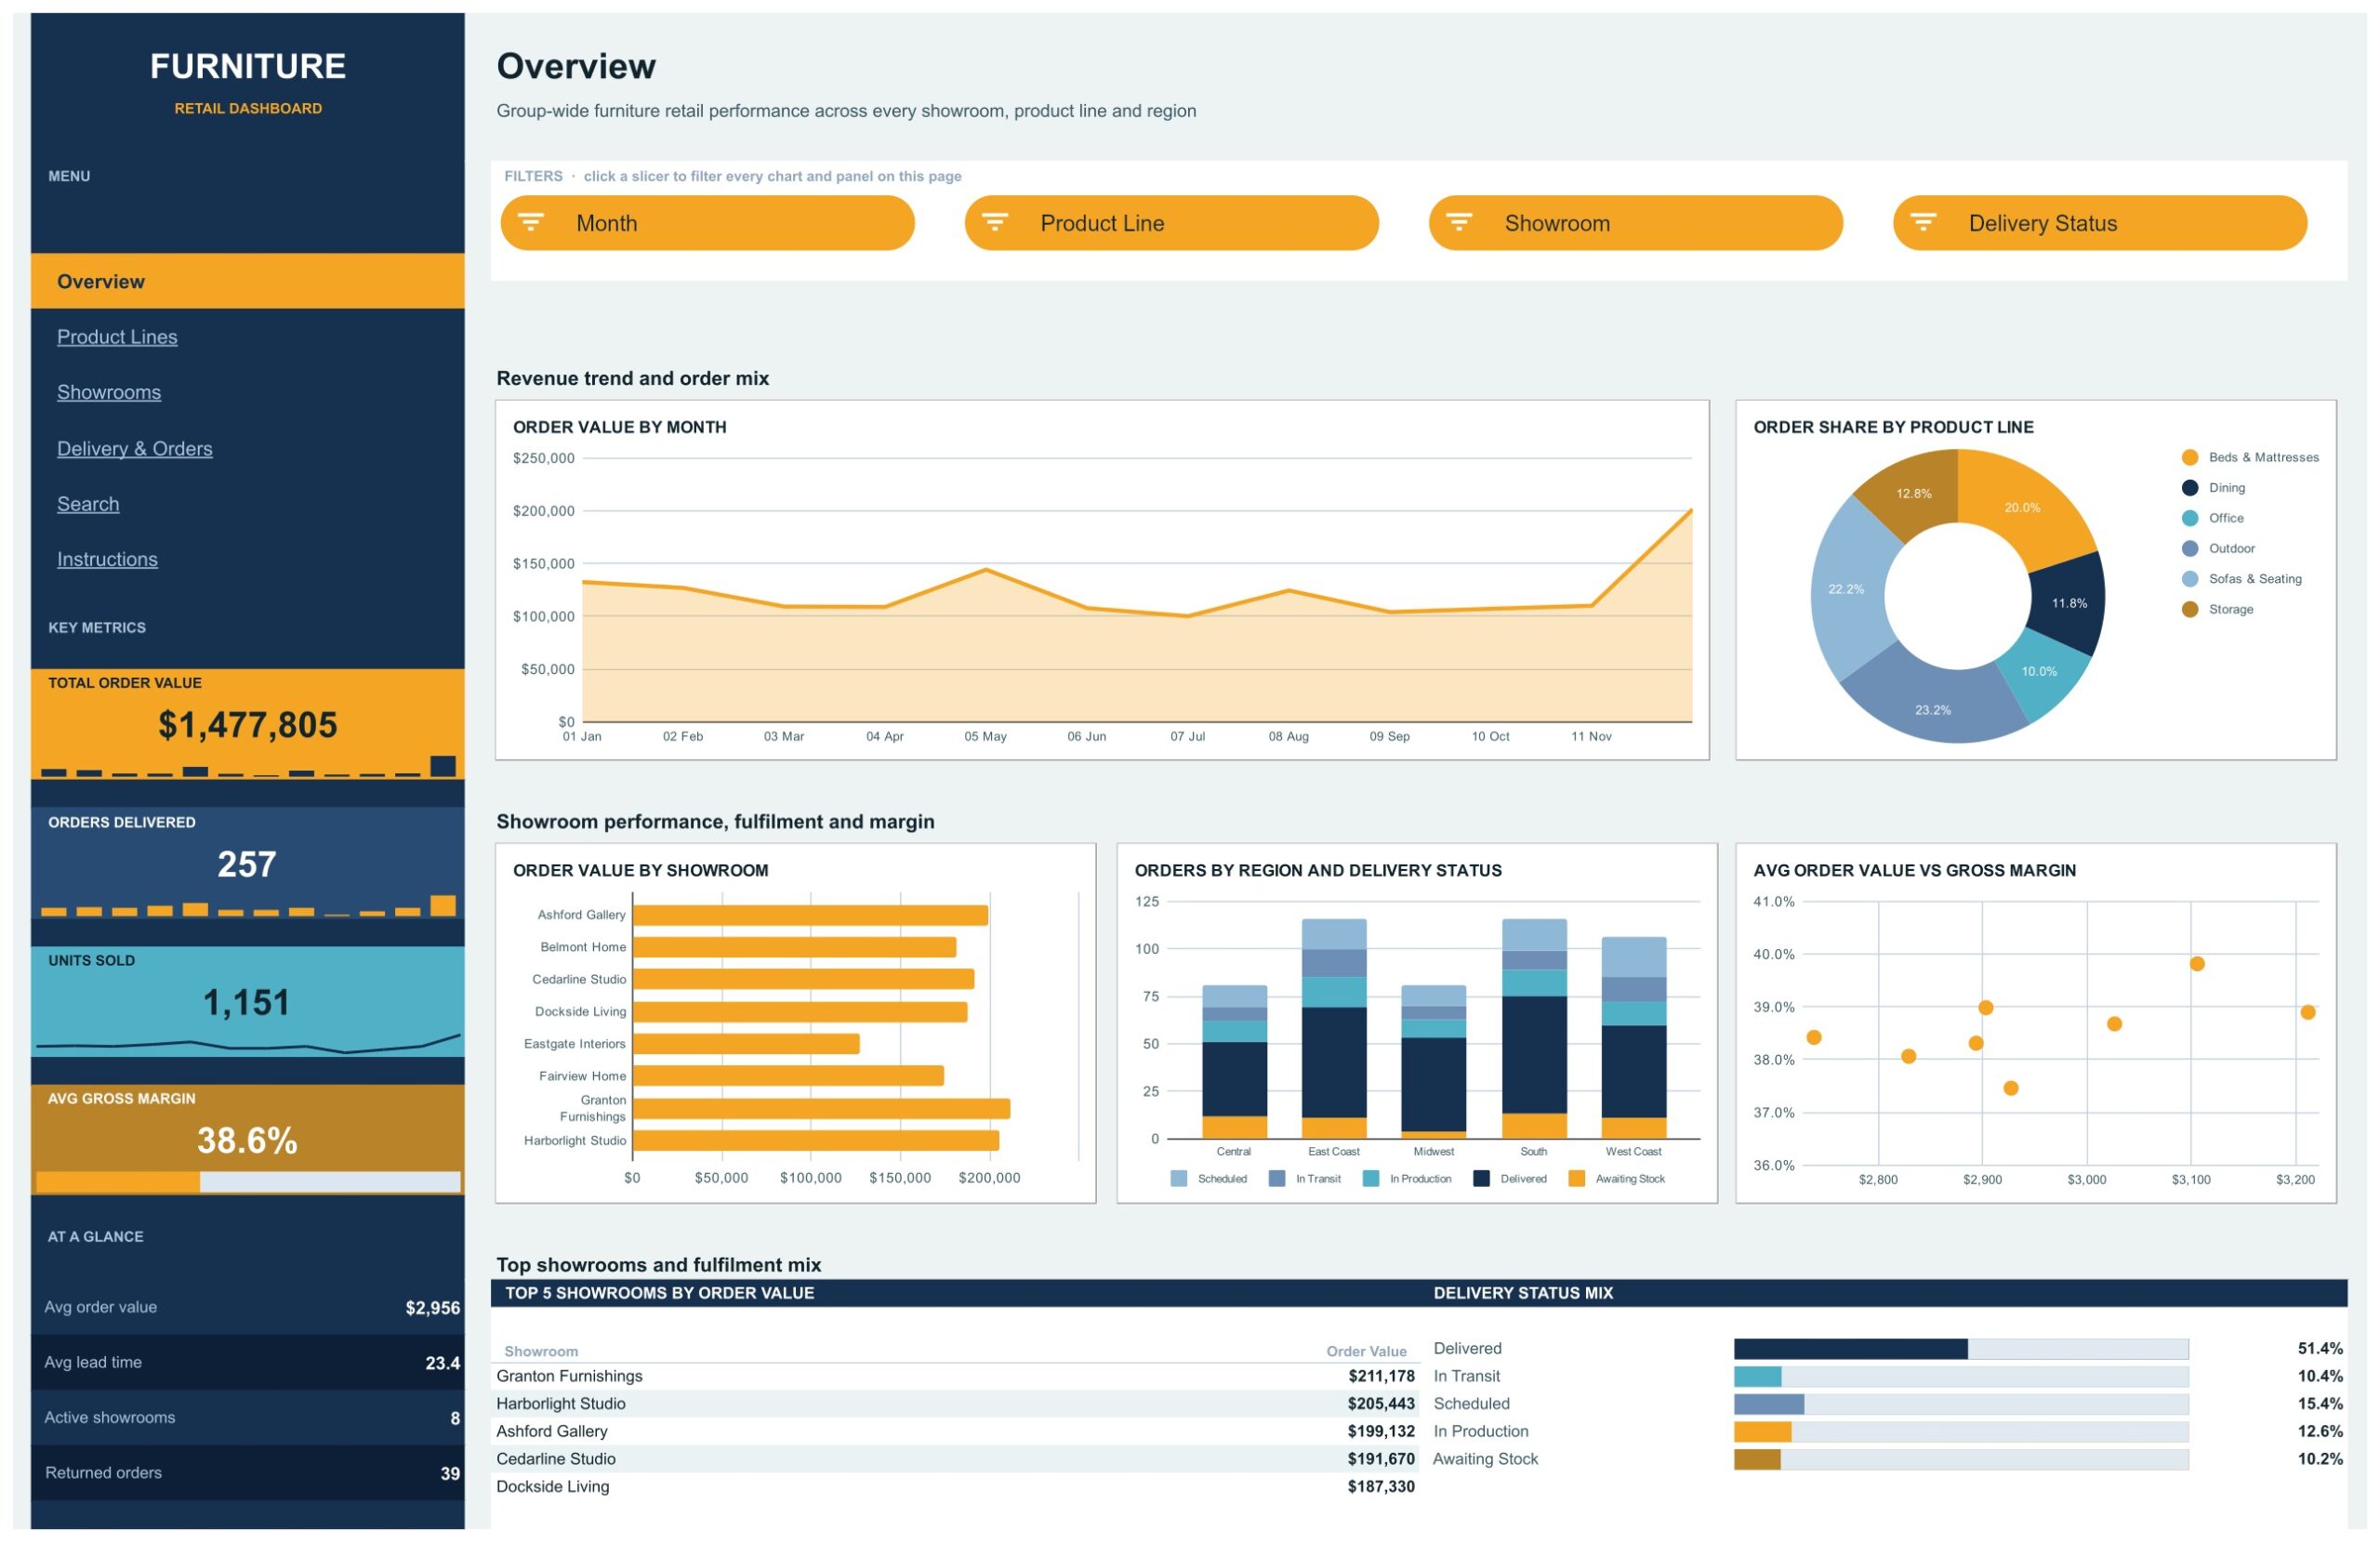
- A KPI rail that never leaves the screen. Total Order Value, Orders Delivered, Units Sold and Avg Gross Margin sit in the navy sidebar on all six pages, under an At-a-glance block showing average order value ($2,956 in the sample), average lead time (23.4 days), active showrooms (8) and returned orders (39).
- 15 slicers, page by page. Overview filters by Month, Product Line, Showroom and Delivery Status; Product Lines by Product Line, Material, Region and Month; Showrooms by Showroom, Region and Salesperson; Delivery & Orders by Delivery Status, Order Status, Region and Month. Slicers apply to one page only, so each page can hold its own view.
- 18 charts named for what they measure. Order Value by Month, Order Share by Product Line, Order Value by Showroom, Orders by Region and Delivery Status, Avg Order Value vs Gross Margin, Units Sold by Material, Avg Gross Margin by Month, Units Sold by Salesperson, Avg Lead Time by Region and more.
- Three ranking panels. Top 5 Showrooms by Order Value, Top 5 Product Lines by Order Value and Top 5 Salespeople by Order Value, each beside a Delivery Status Mix bar panel that splits Delivered, In Transit, Scheduled, In Production and Awaiting Stock.
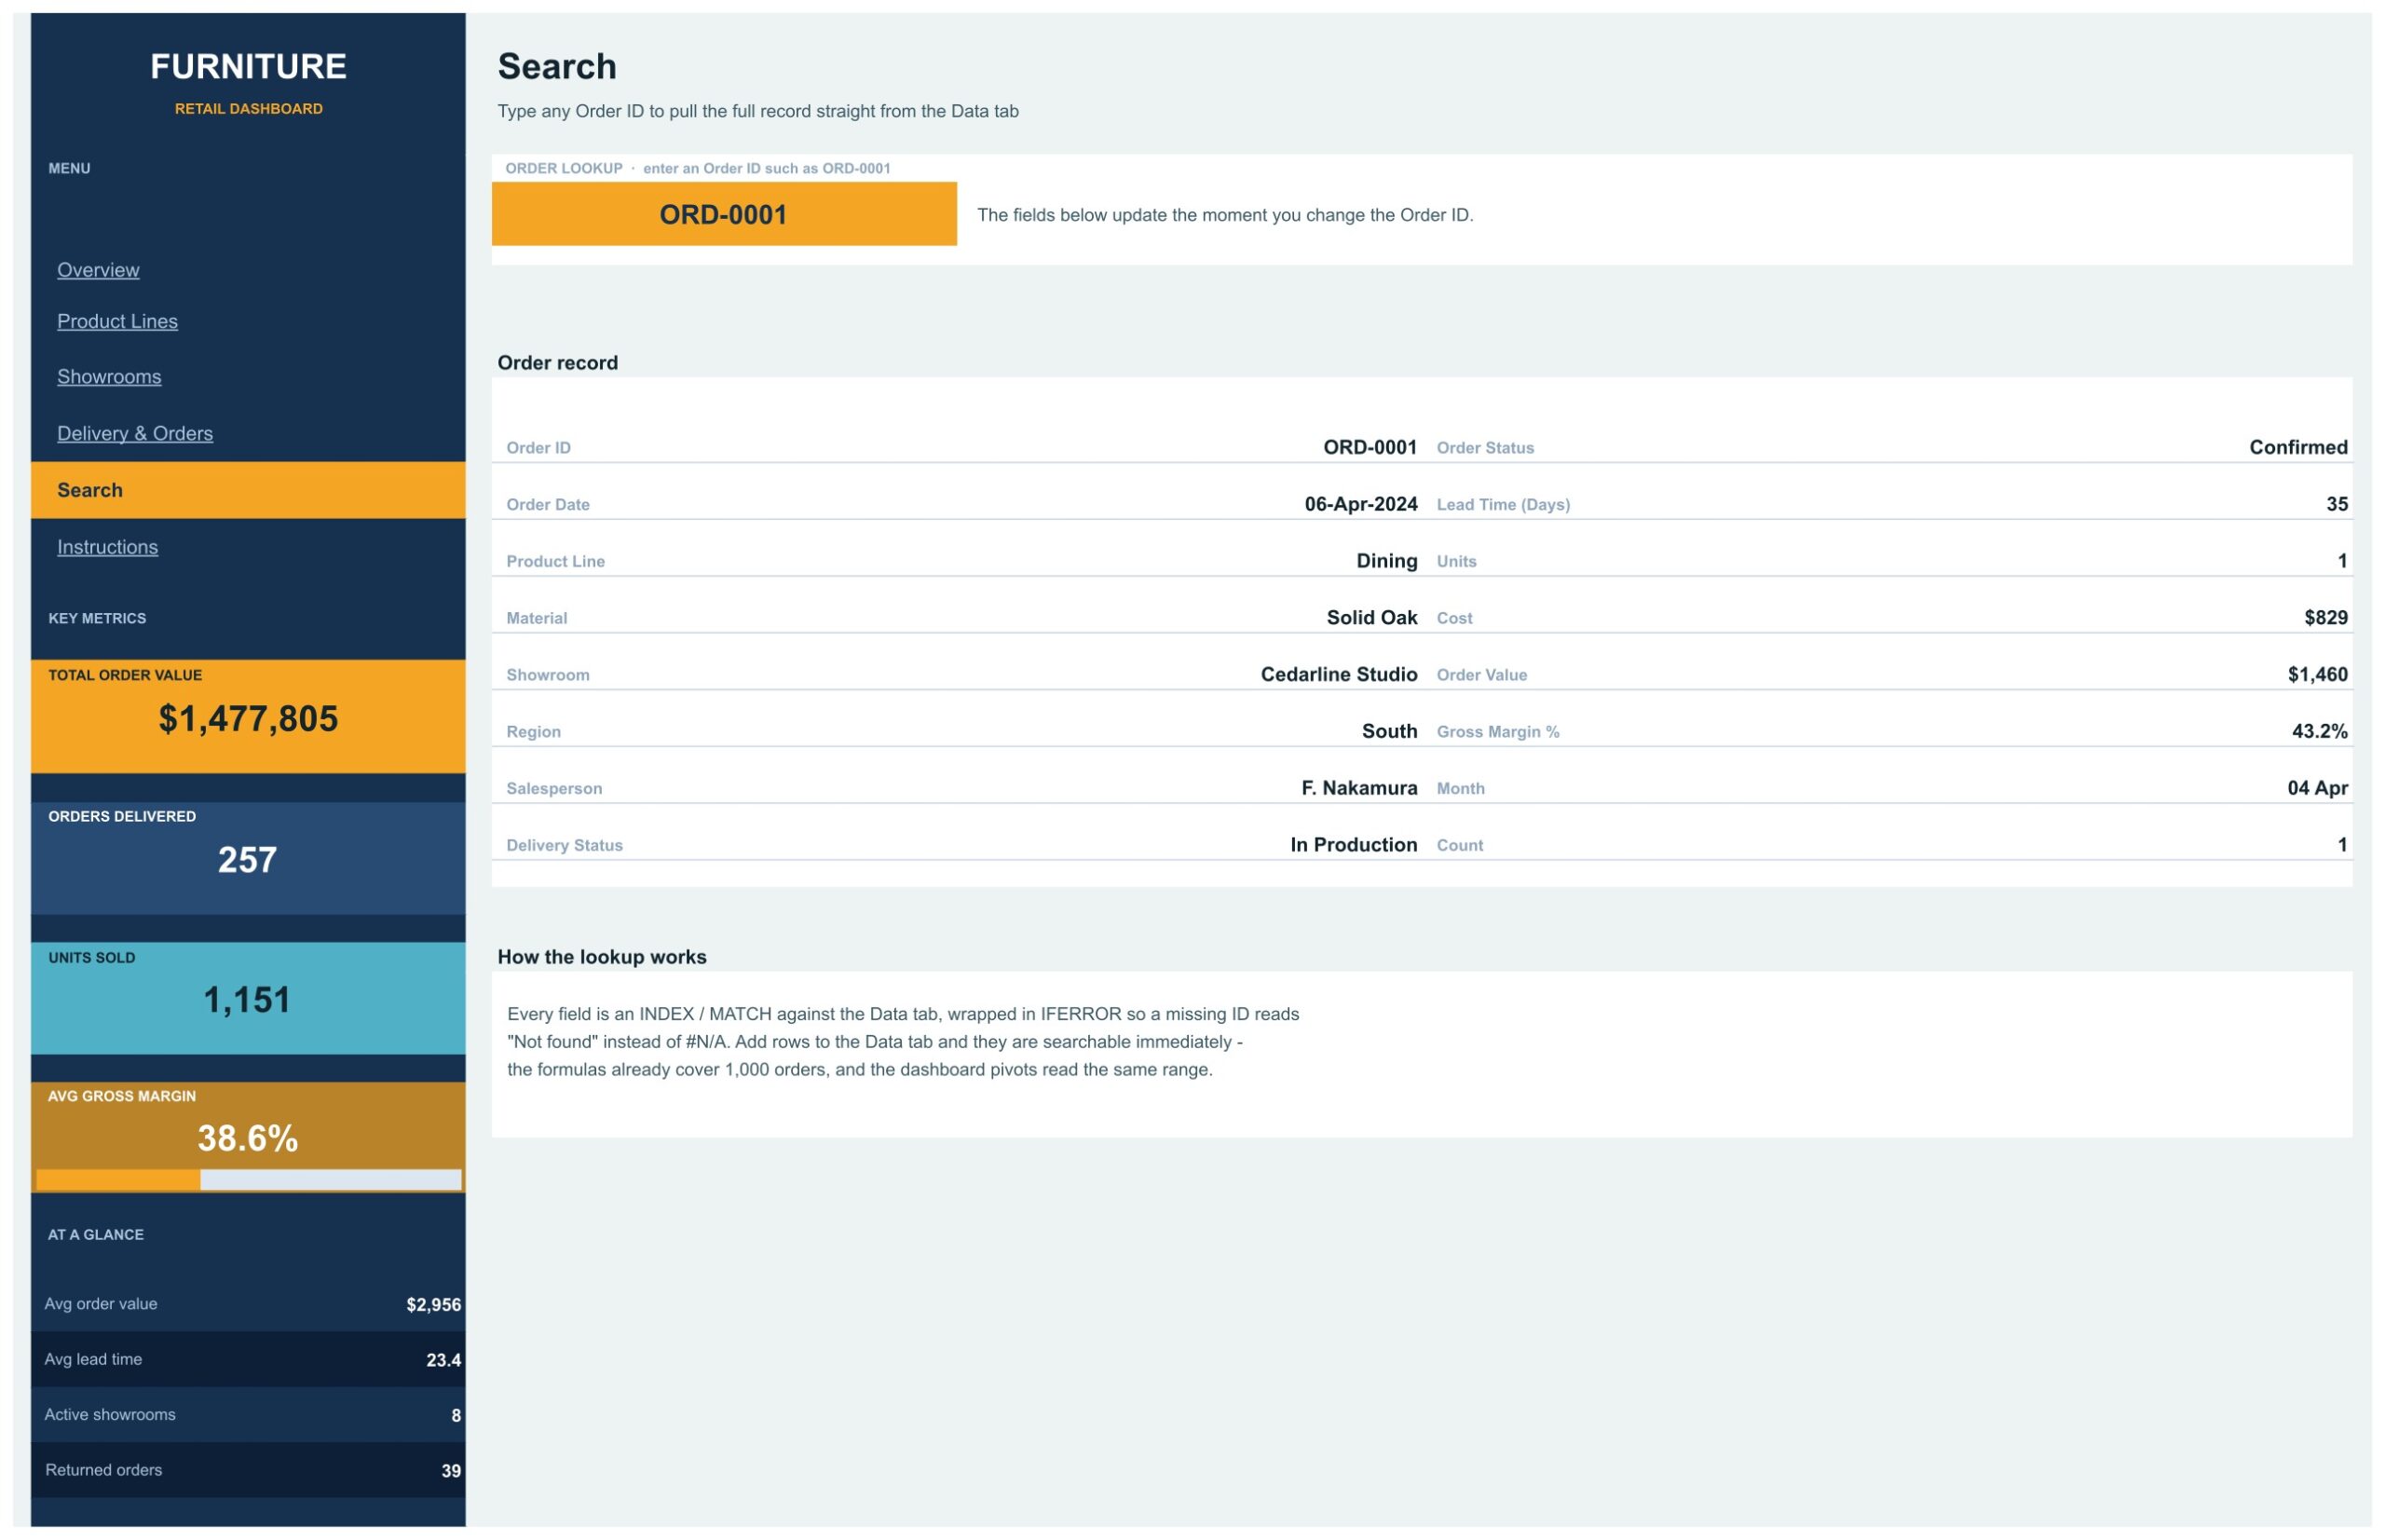
- A one-cell order lookup. The Search page returns 16 fields for any Order ID through lookup formulas — INDEX / MATCH wrapped in IFERROR, so a missing ID reads “Not found” instead of #N/A.
- No add-ons. Native pivot tables and slicers only. No macros, no Apps Script, nothing to install.
Dashboard Pages Explained
Page 1 — Overview
Group-wide performance across every showroom, product line and region. Four slicers sit above Order Value by Month, Order Share by Product Line, Order Value by Showroom, Orders by Region and Delivery Status, and a scatter of Avg Order Value vs Gross Margin, with Top 5 Showrooms by Order Value and the Delivery Status Mix closing the page.
Page 2 — Product Lines
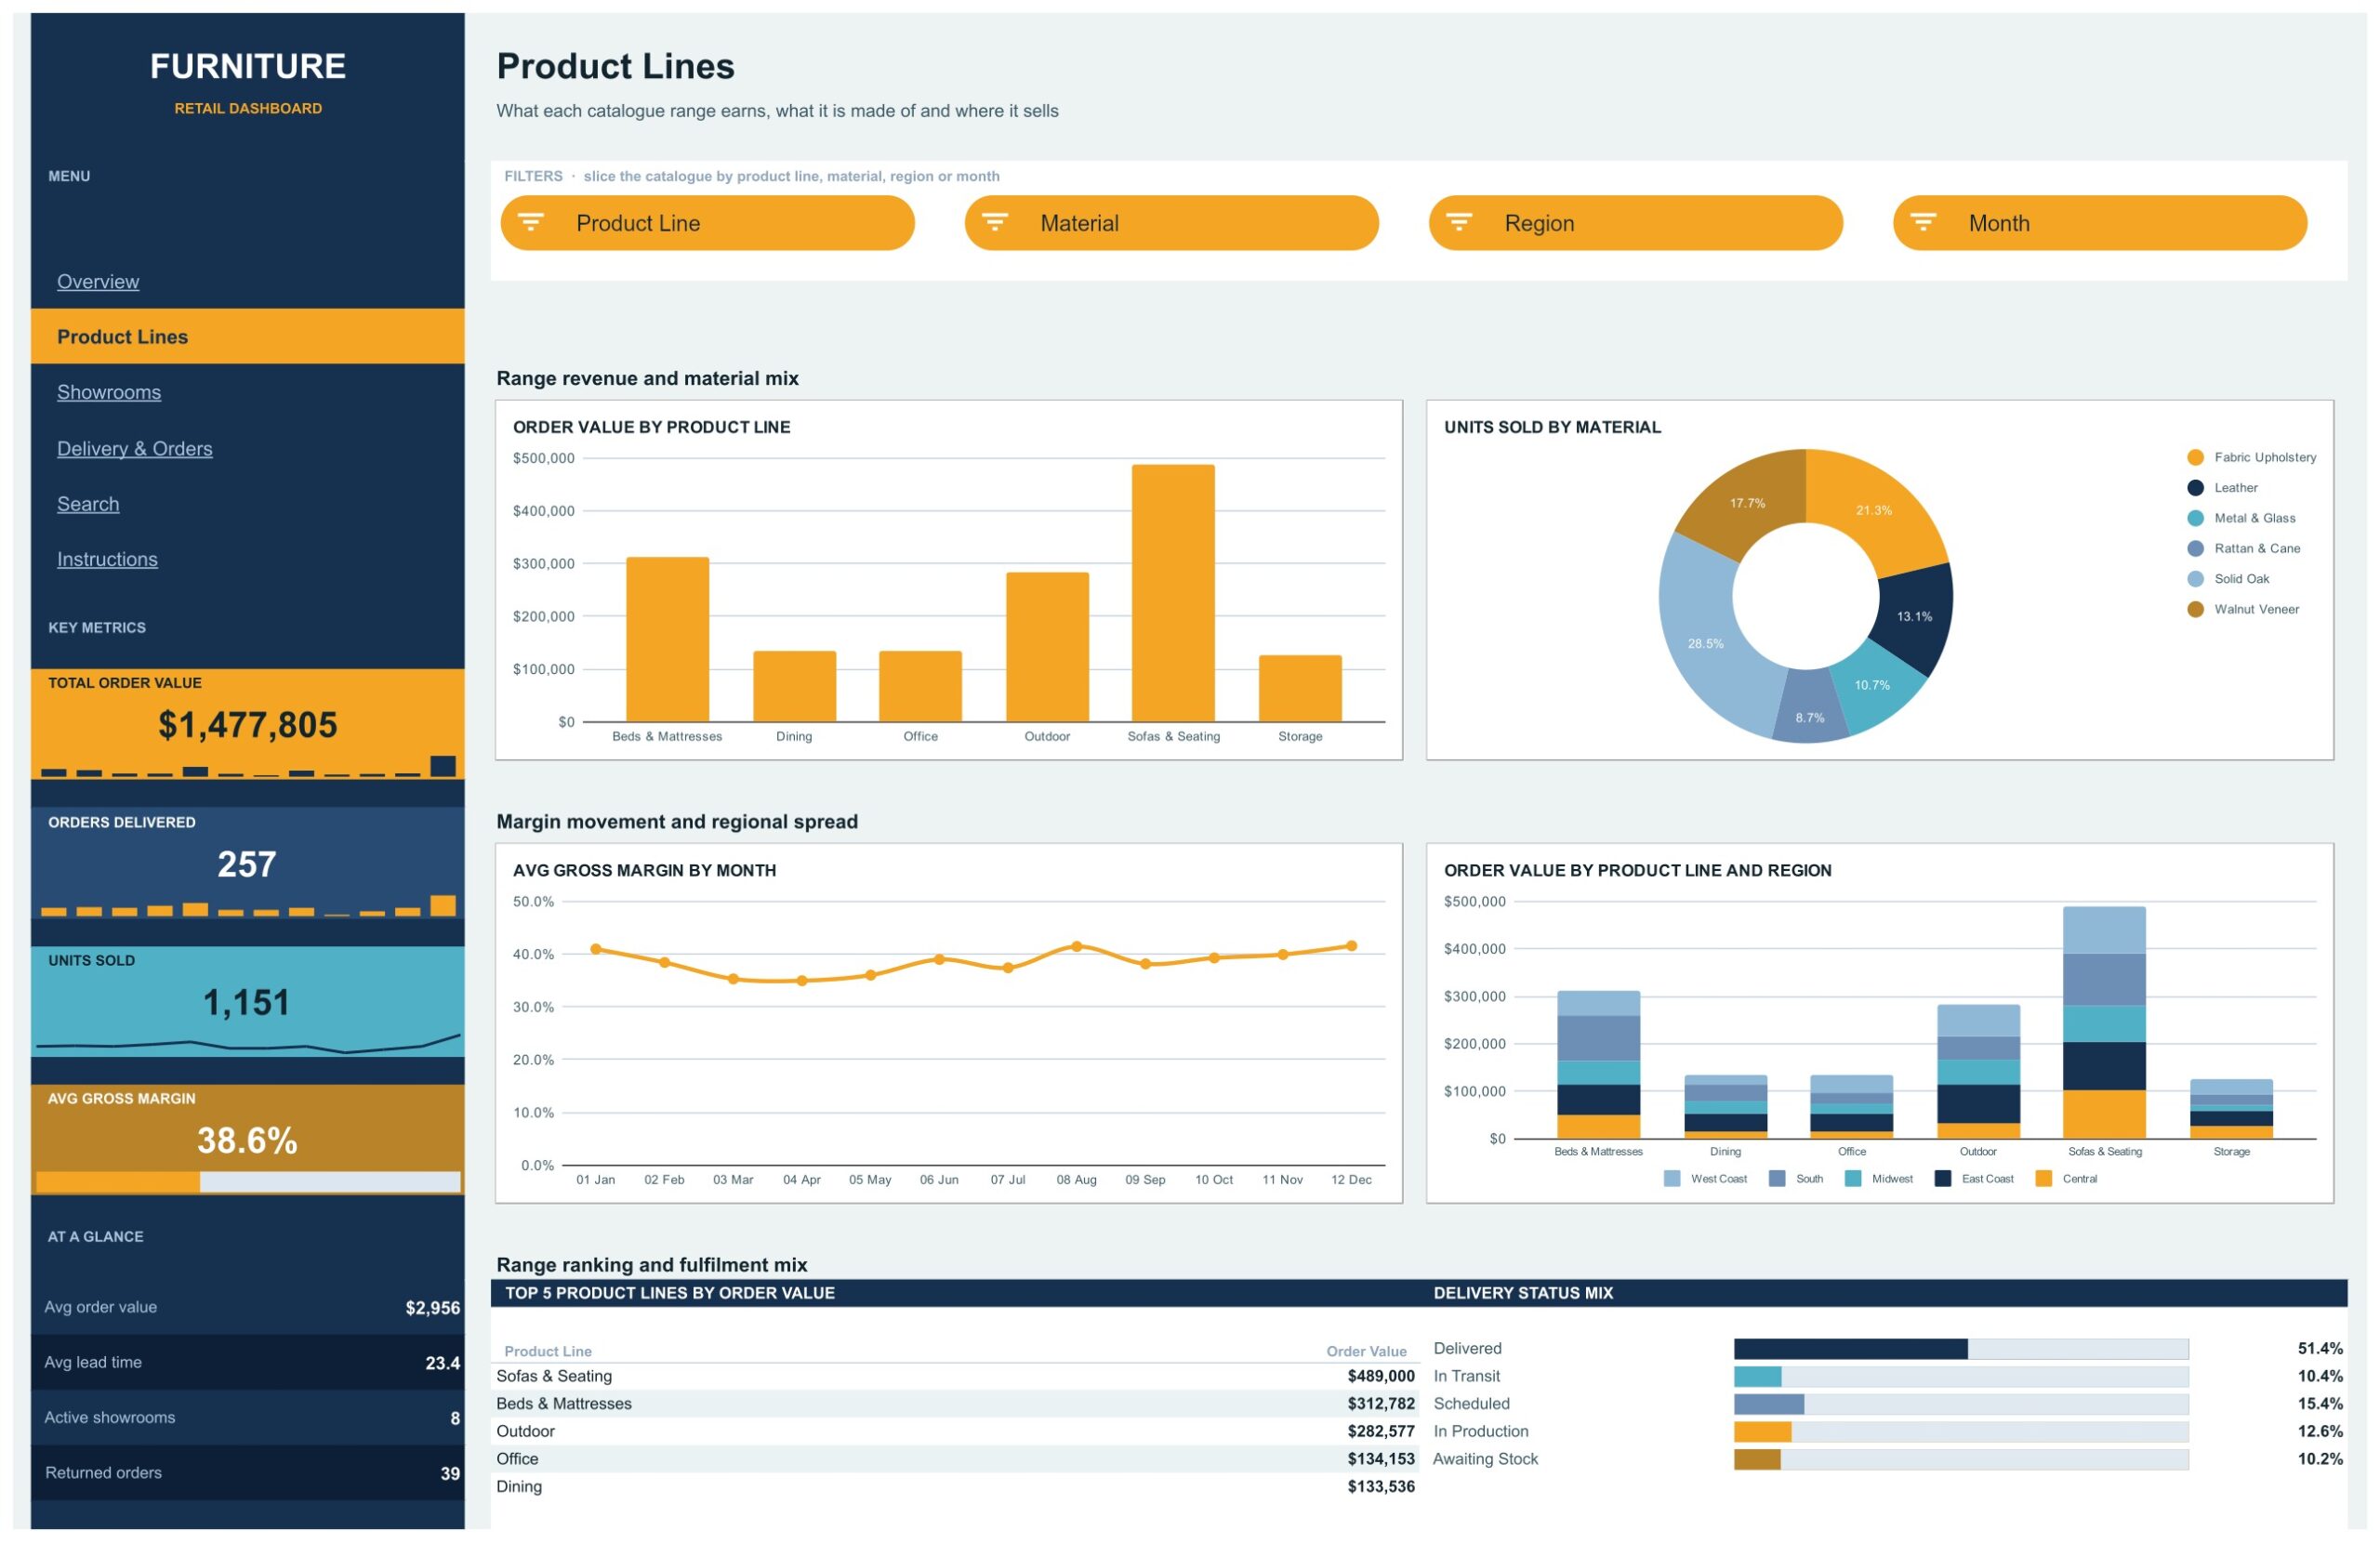
What each catalogue range earns, what it is made of and where it sells. Order Value by Product Line ranks six ranges — Beds & Mattresses, Dining, Office, Outdoor, Sofas & Seating and Storage — while Units Sold by Material splits six materials from fabric upholstery to walnut veneer. Avg Gross Margin by Month and Order Value by Product Line and Region complete the page.
Page 3 — Showrooms
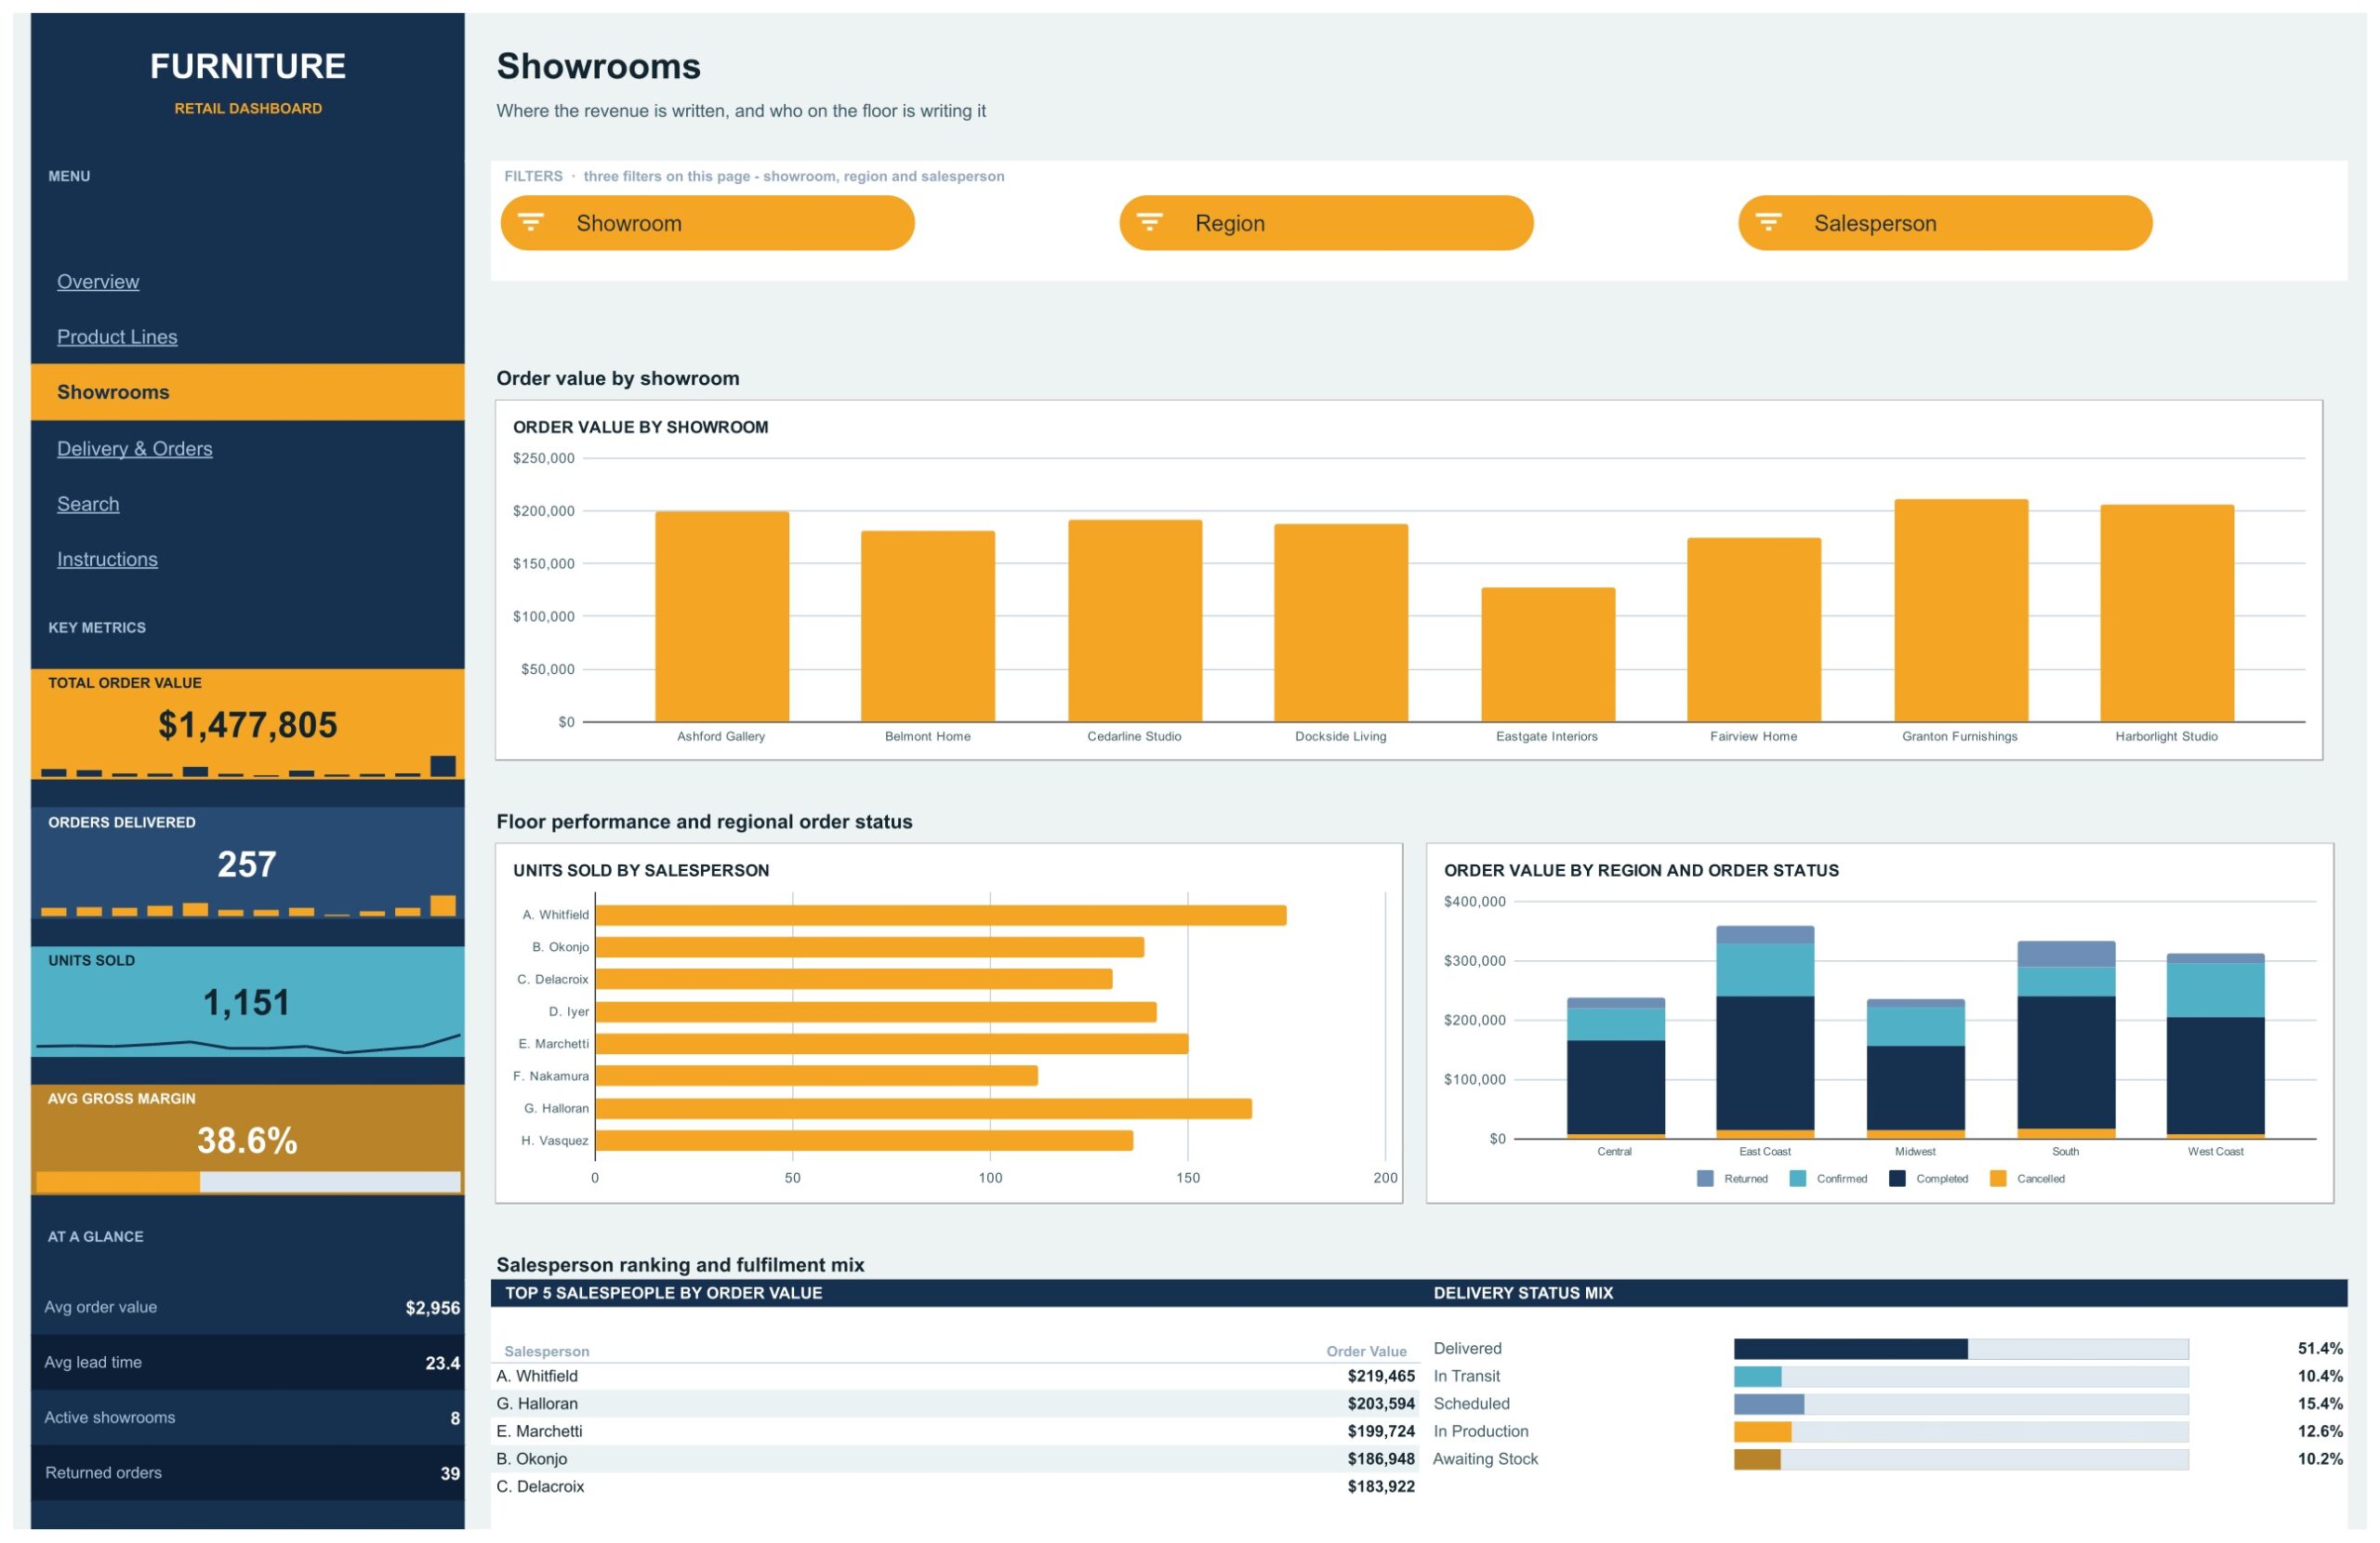
Where the revenue is written, and who on the floor is writing it. Order Value by Showroom compares all eight locations, Units Sold by Salesperson ranks eight sellers, and Order Value by Region and Order Status stacks Completed, Confirmed, Returned and Cancelled across five regions. A Top 5 Salespeople by Order Value panel sits beneath.
Page 4 — Delivery & Orders
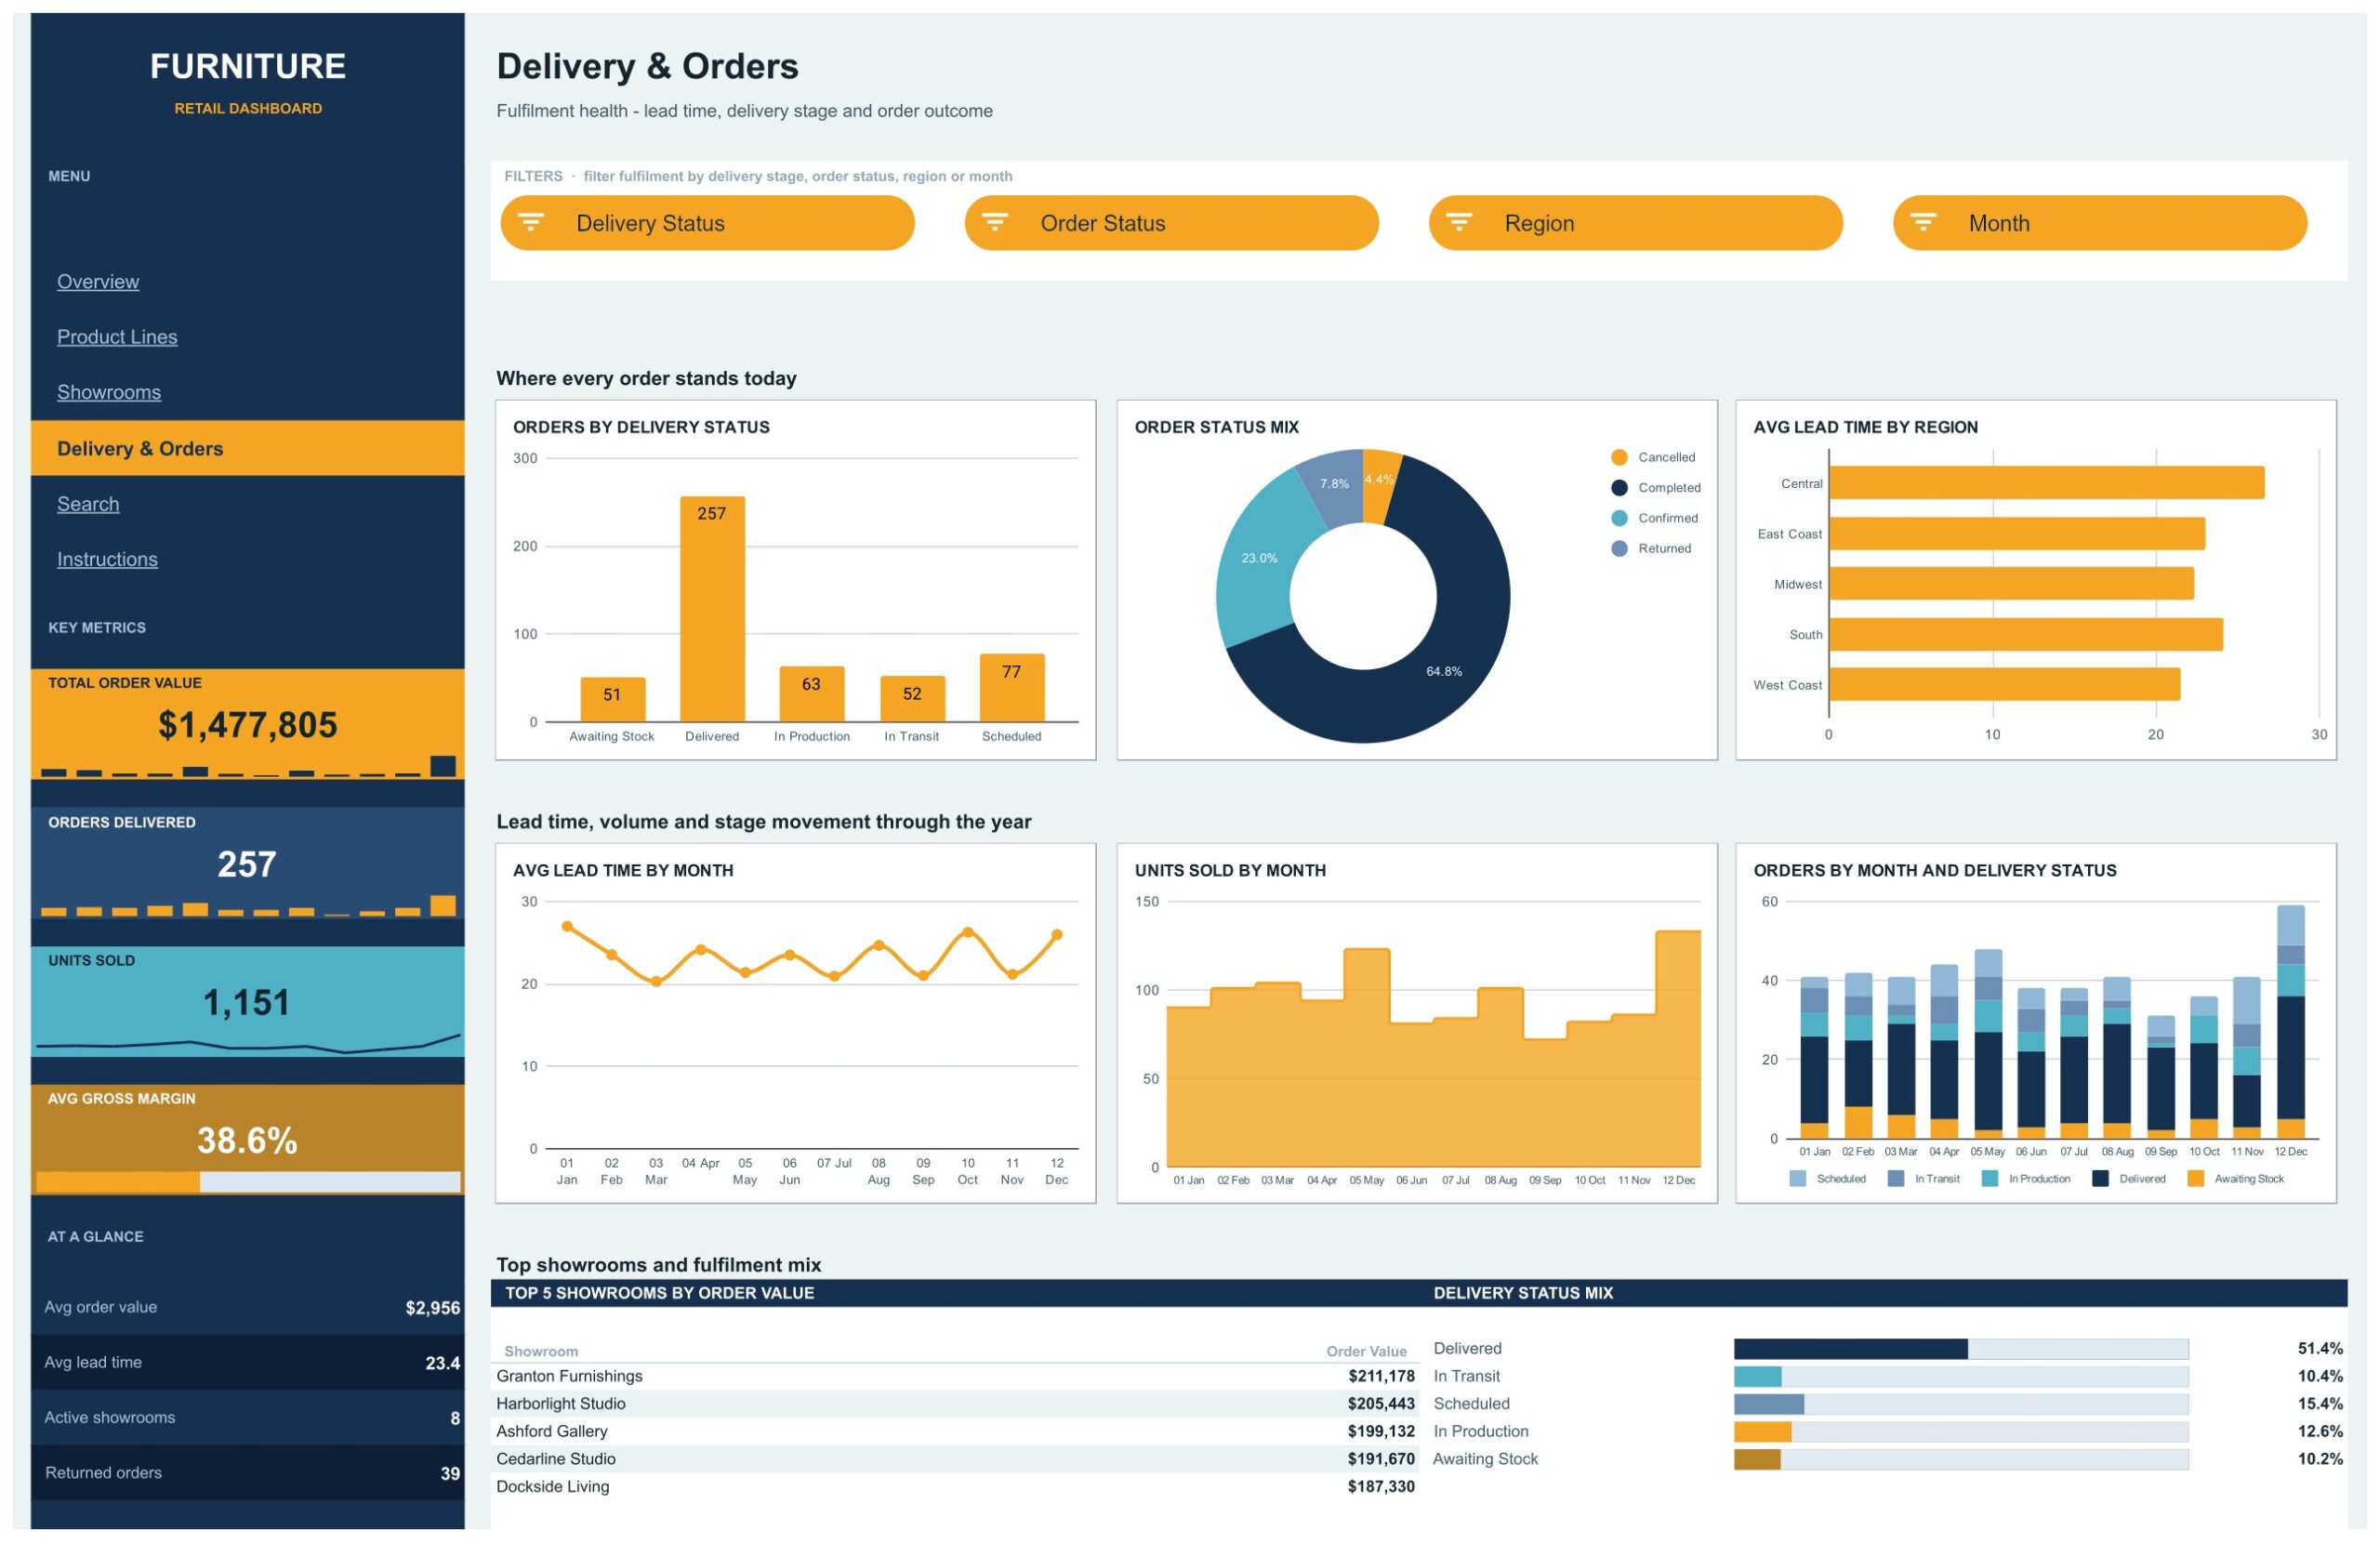
Fulfilment health in six charts: Orders by Delivery Status, Order Status Mix, Avg Lead Time by Region, Avg Lead Time by Month, Units Sold by Month and Orders by Month and Delivery Status. In the sample data 51.4% of orders are delivered, 15.4% scheduled, 12.6% in production, 10.4% in transit and 10.2% awaiting stock.
Page 5 — Search
Type an Order ID such as ORD-0001 and the record fills in beneath: order date, product line, material, showroom, region, salesperson, delivery status, order status, lead time in days, units, cost, order value, gross margin percentage and month. The page explains its own formulas, so extending them is straightforward.
Page 6 — Instructions
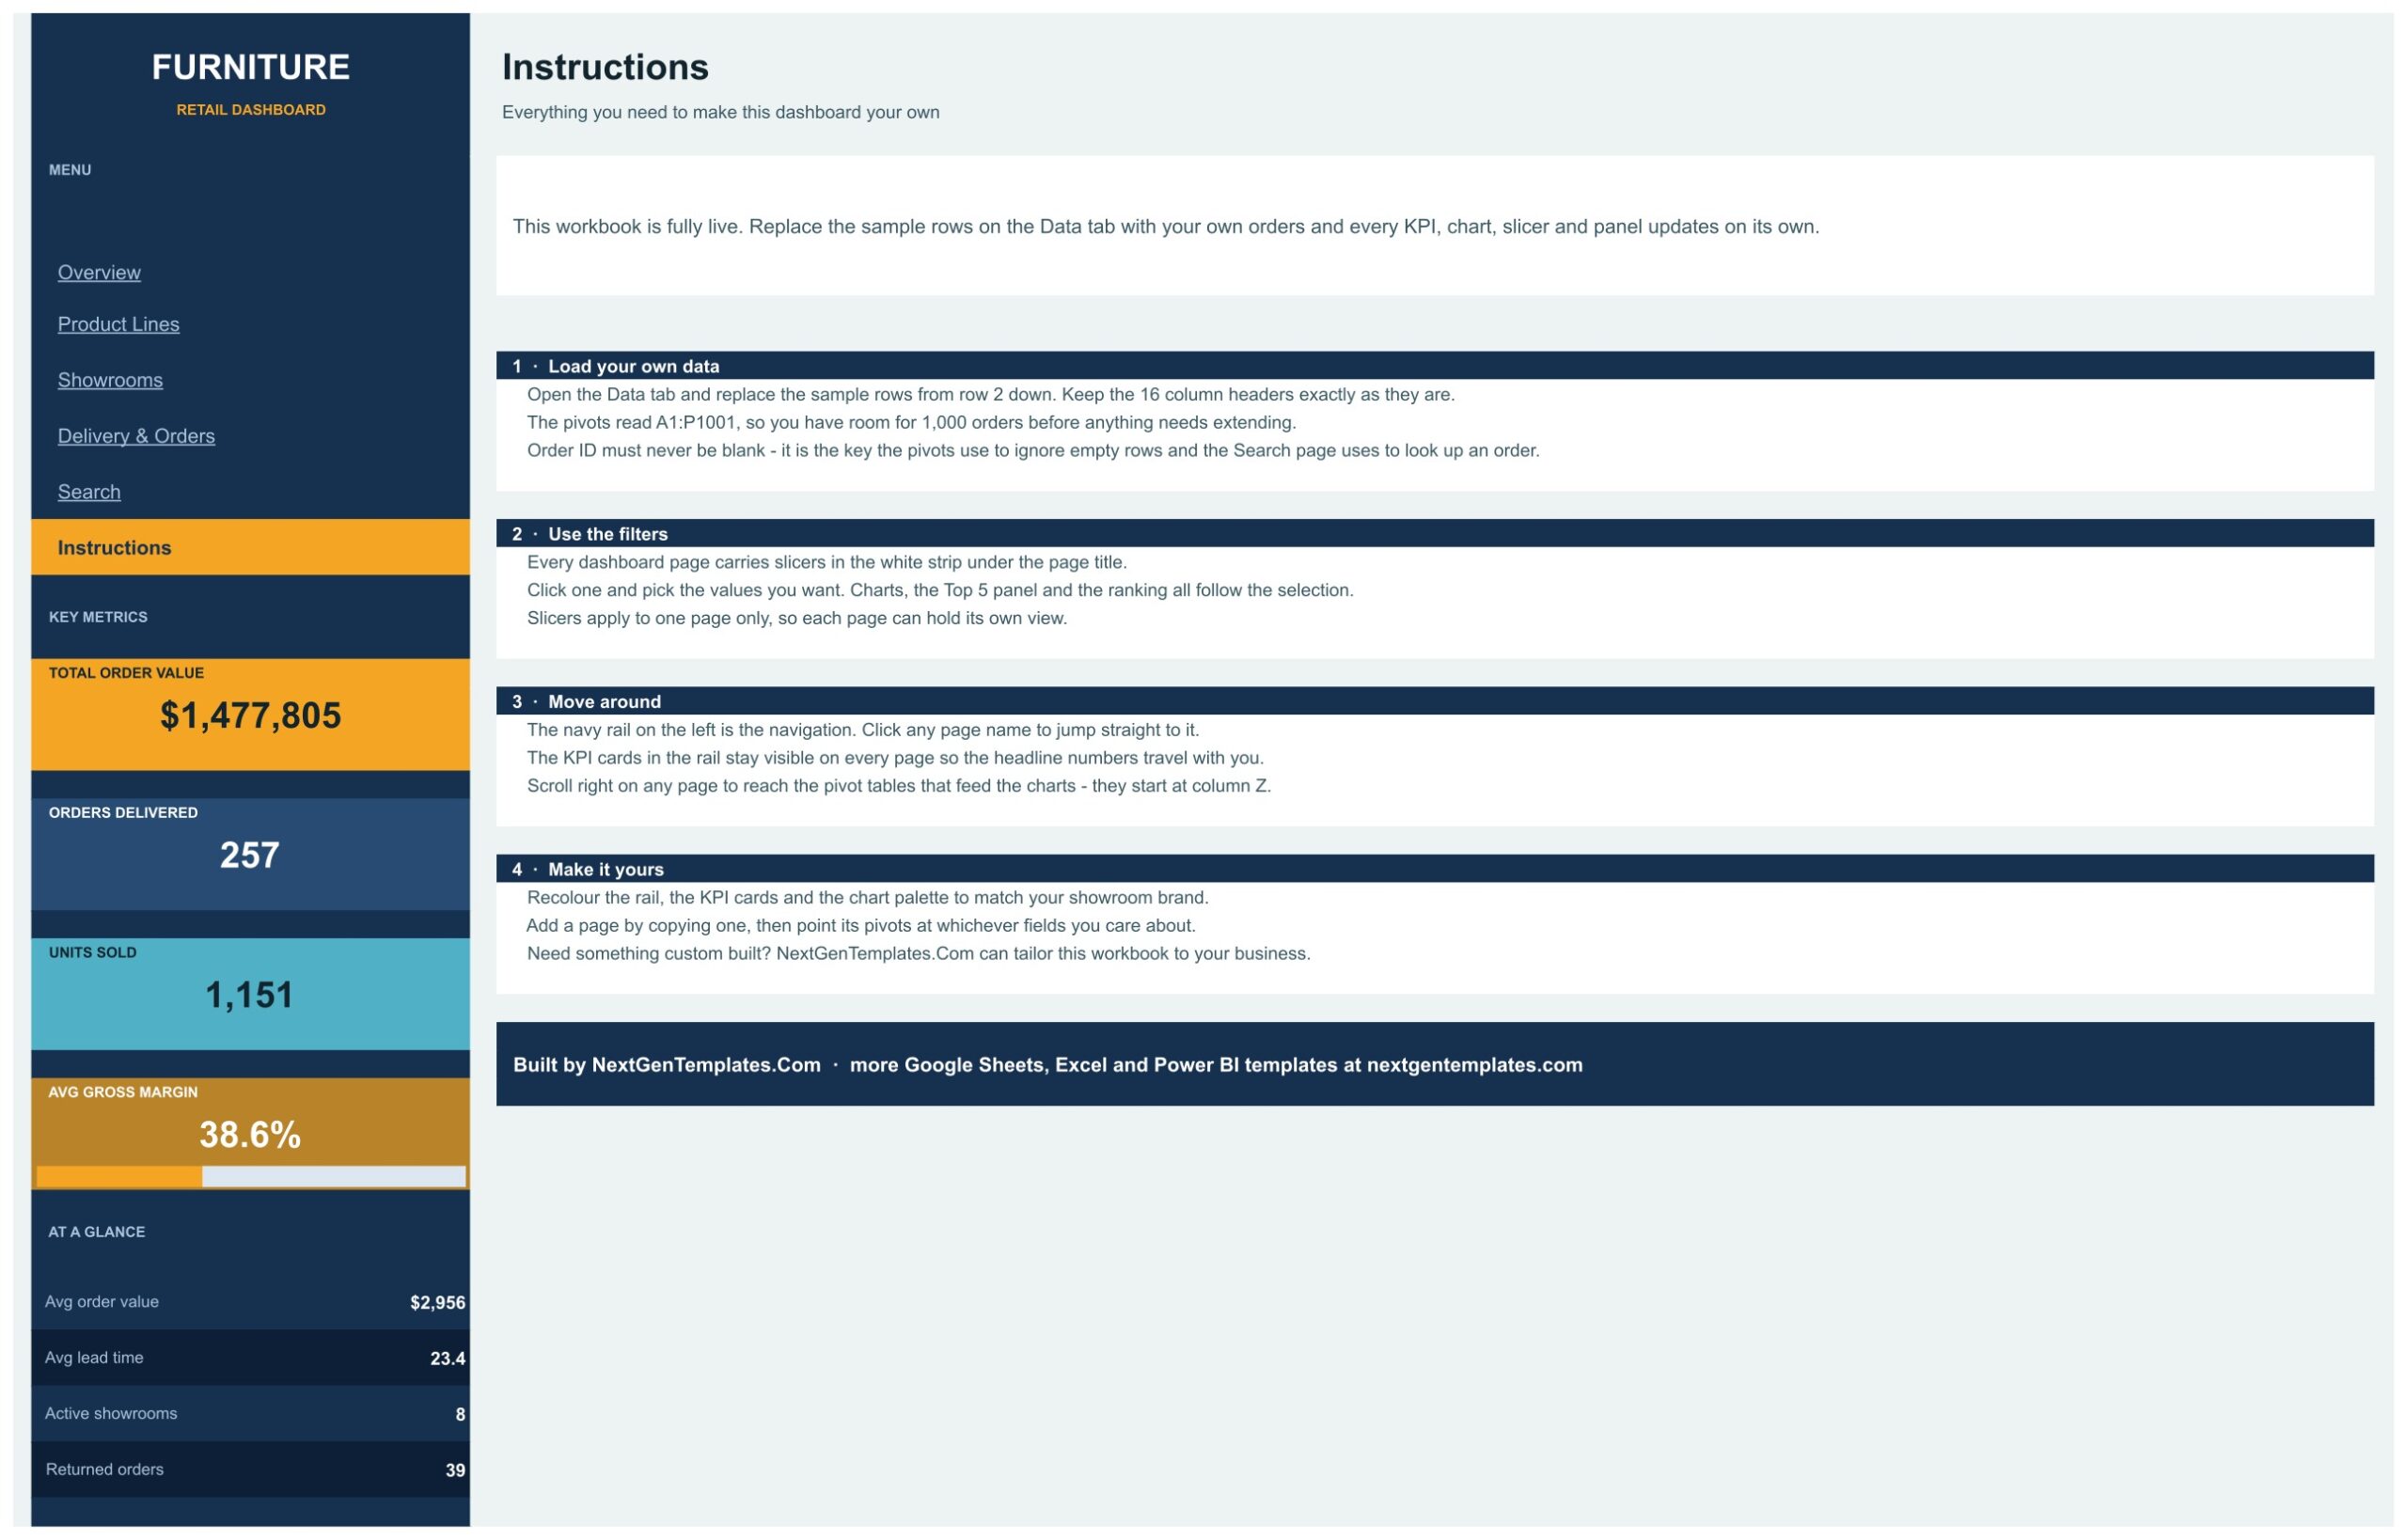
Four numbered steps: load your own data, use the filters, move around the workbook, and make it yours. It also notes that the pivot tables feeding the charts start at column Z on each page, which is where you go if you want to change what a chart measures.
The Data tab
Sixteen columns, 500 sample rows, pivots reading A1:P1001. Order ID is the key column — leave it blank and the pivots skip the row and the Search page cannot find it.
Furniture Retail Dashboard vs. Excel vs. Paid Retail BI — Feature Comparison
| Feature | Furniture Retail Dashboard (Google Sheets) | Microsoft Excel dashboard | Retail BI SaaS (Lightspeed Insights / Tableau) |
|---|---|---|---|
| Cost | One-time purchase ✅ | One-time purchase | $35–150 / user / month |
| Platform | Any browser, no install ✅ | Desktop Excel | Vendor cloud only |
| Setup time | Under 10 minutes ✅ | Under 15 minutes | 2–6 weeks with onboarding |
| Real-time collaboration | Built in ✅ | Needs OneDrive co-authoring | Built in |
| Mobile access | Google Sheets app ✅ | Limited on mobile Excel | Vendor app |
| Editable data model | All 16 columns are yours ✅ | Fully editable | Fixed schema |
| Share with a link | Yes, view or edit ✅ | File must be sent | Paid seat required |
| Showroom & salesperson ranking | Three Top 5 panels ✅ | Depends on build | Usually an add-on report |
| Year-1 cost at 5 users | Price of one template ✅ | Price of one template | $2,100–9,000 |
For furniture groups that want showroom-level visibility without a per-seat BI contract, this workbook sits in the sweet spot.
Who Should Use This Template
Perfect for:
- Independent furniture retailers and showroom groups running roughly 3–15 locations
- Retail operations managers who need a furniture store sales dashboard without a BI budget
- Sales managers comparing order value and units per salesperson across regions
- Fulfilment leads tracking lead time and delivery stage month by month
- Buyers deciding which ranges and materials actually carry the margin
Not a fit if:
- You need a live feed. The Furniture Retail Dashboard in Google Sheets connects to no POS, ERP or e-commerce platform and ships with sample data only — you paste or import your own orders.
- You carry more than 1,000 orders and do not want to extend the pivot ranges yourself.
- You need stock-on-hand, purchase orders or supplier costing. Those fields are not in the data model.
- You need audited statutory reporting rather than internal management reporting.
Real-World Use Cases
Priya runs eight showrooms across two regions. Every Monday she opens the Showrooms page, filters to her region and reads Order Value by Showroom plus the Top 5 Salespeople panel before her floor-manager call. The report used to be a manual rebuild each week; now it is a slicer click.
Daniel heads fulfilment for a mid-sized retailer. He watches Avg Lead Time by Region and Orders by Delivery Status on the Delivery & Orders page. When one region’s bar creeps past the others he chases the supplier before customers start calling about undelivered sofas.
Lena buys for the catalogue. She filters Product Lines by Material to see whether solid oak or fabric upholstery is carrying the margin, then checks Order Value by Product Line and Region before committing to next season’s range.
Advantages of the Furniture Retail Dashboard in Google Sheets
The obvious saving for a furniture retail analytics template like this one is licence cost, but the practical saving is distribution. A Google Sheet is a link. Your regional manager opens it on a phone between showroom visits without installing anything or being added as a paid seat. Because the charts read pivot tables rather than hard-coded ranges, adding a showroom or a new product line does not break anything — the pivots pick it up on the next refresh.
The second advantage is margin visibility at the right grain. Gross margin sits on the KPI rail as a headline, on Page 2 as a monthly trend, and on Page 1 as a scatter against average order value — so you can see whether the showroom writing the biggest tickets is also the one writing the most profitable ones. That combination is what most exported order reports leave out.
Opportunities for Improvement
Honest limitations are worth stating. The pivot ranges stop at 1,000 rows, so a high-volume chain has to extend them once by hand. There is no inventory or purchase-order side to the model, so it reports what sold, not what is sitting in the warehouse. Slicers apply per page rather than globally, which is flexible but means a filter set on Overview does not carry to Showrooms. And because everything is native Sheets, very large datasets will feel slower than the same build in Power BI.
Best Practices
- Keep Order ID unique and never blank — it is the key both the pivots and the Search page rely on.
- Keep the 16 column headers exactly as shipped; renaming one silently detaches a chart’s pivot field.
- Load a full 12 months before reading the monthly trends, or Avg Gross Margin by Month will look noisier than it is.
- Recolour the rail and chart palette to your brand first — teams trust a dashboard that looks like theirs.
- Share view-only with the floor and keep edit rights with whoever maintains the Data tab.
Explore Relevant Templates
- Supermarkets Dashboard in Google Sheets — the same multi-page, slicer-driven build applied to grocery retail.
- Convenience Stores Dashboard in Google Sheets — store-level sales analysis for smaller-format retail.
- Office Furniture Inventory Dashboard in Google Sheets — asset tracking rather than sales reporting.
- Also available as: Furniture Retail Dashboard in Excel and Furniture Retail Dashboard in Power BI — each built natively for its platform, so the pages and charts differ.
Learning to build reports like this yourself? The Excel Pivot Tables & Dashboards course on NextGenTemplates Academy covers the pivot and chart techniques with downloadable practice files.
Get the Furniture Retail Dashboard in Google Sheets
Frequently Asked Questions
What does the Furniture Retail Dashboard in Google Sheets track?
It tracks total order value, orders delivered, units sold and average gross margin, plus average order value, average lead time, active showrooms and returned orders. The analysis pages break those down by product line, material, showroom, salesperson, region, delivery status, order status and month.
Does it connect to my POS or online store?
No. This furniture retail dashboard is a self-contained Google Sheets workbook with no connector to any POS, ERP or e-commerce platform. It ships with sample data; you paste or import your own orders onto the Data tab and every chart recalculates.
How many orders can it handle?
The pivot tables and Search formulas already read A1:P1001, so 1,000 orders work with no changes at all. Beyond that you extend the pivot source ranges once and the charts, rankings and lookup follow automatically.
How long does setup take?
Under 10 minutes. Make your own copy from the link in the download, paste your orders onto the Data tab keeping the 16 headers intact, and the KPI cards, charts, slicers and ranking panels all update on their own.
How does it compare to a paid retail BI platform?
Retail BI suites typically start around $35 per user per month and take weeks to onboard. This furniture showroom sales dashboard is a one-time purchase you own outright, opens in any browser, and can be shared by link with the whole floor team at no extra cost per seat.
Do I need macros or add-ons?
No. Everything runs on native Google Sheets features — pivot tables, slicers, INDEX / MATCH and standard formulas. There is no Apps Script, no macro and no third-party add-on, so it opens and works on any account.
Can I add my own pages or KPIs?
Yes. Copy an existing page and point its pivot tables at whichever fields you care about; the pivots live from column Z rightwards on each page. Recolouring the rail, cards and chart palette needs no formula changes at all.
About the Author
Built by PK — Microsoft Certified Professional with 15+ years of Excel, Google Sheets and Power BI experience. Founder of NextGenTemplates, reaching 300K+ subscribers across YouTube channels. Every template is hand-built and tested before release.
Conclusion
If you sell furniture out of more than one showroom, the reporting problem is rarely a lack of data — it is that order value, margin, lead time and delivery stage all live in different places. The Furniture Retail Dashboard in Google Sheets puts them on one screen, sliceable six ways, with a lookup page for the single order a customer is calling about.
Instant download · One-time payment · No subscription
Last updated: September 2026