Private equity firms operate in a highly competitive and performance-driven environment. Investors expect clear visibility into portfolio growth, returns, operational efficiency, and fund performance. However, many firms still track performance using scattered spreadsheets or manual reports. As a result, managers struggle to analyze investment performance quickly and accurately.
A Private Equity KPI Scorecard in Google Sheets provides a structured solution. It transforms complex investment data into a clear, interactive scorecard that monitors key performance indicators (KPIs). Therefore, private equity managers can evaluate fund performance, portfolio growth, and investment efficiency in real time.
This ready-to-use scorecard is built inside Google Sheets and tracks 10 critical KPIs that measure financial performance and investment outcomes.
What Is a Private Equity KPI Scorecard in Google Sheets?
A Private Equity KPI Scorecard in Google Sheets is a performance monitoring dashboard designed for private equity firms, investment managers, and fund analysts.
Instead of reviewing multiple reports, the scorecard provides a centralized view of investment performance. It tracks monthly and yearly KPI performance using interactive elements such as:
- Month selection dropdown
- Traffic light performance indicators
- Up and down arrows showing percentage change
- MTD (Month-to-Date) and YTD (Year-to-Date) views
Because the dashboard updates automatically when users change the selected month, managers can instantly evaluate performance trends.
Key Features of Private Equity KPI Scorecard in Google Sheets
Click to Buy Private Equity KPI Scorecard in Google Sheets
This scorecard template contains several structured worksheets that organize KPI data effectively.
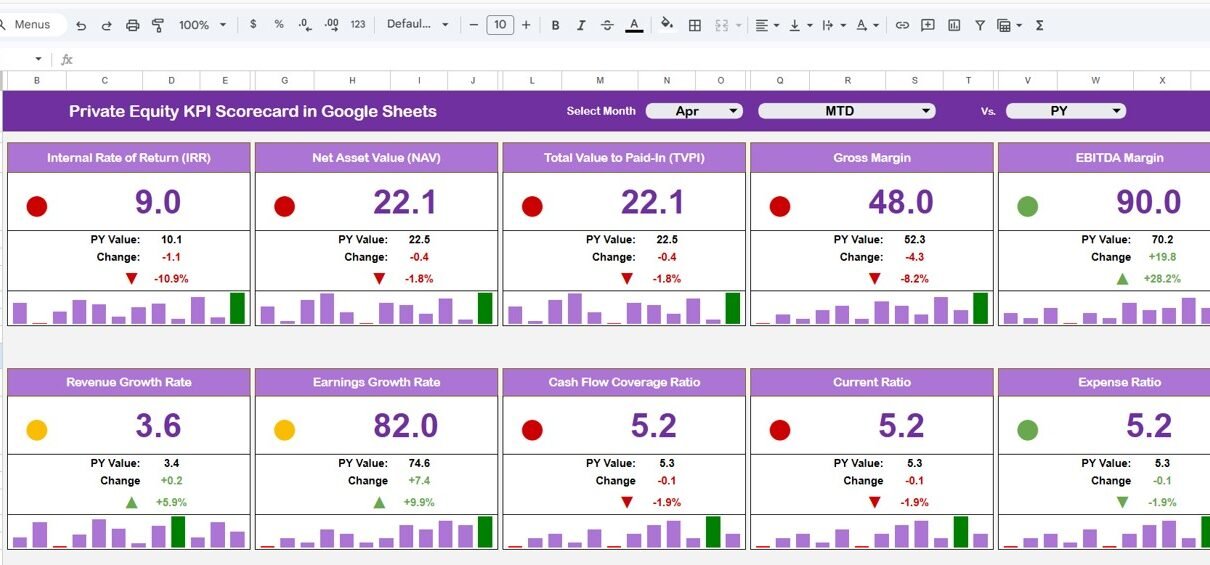
KPI Scorecard Dashboard
The Scorecard Dashboard acts as the main reporting interface.
At the top of the dashboard, users can select a month from the dropdown menu. Once a month is selected, the dashboard automatically updates all KPI values.
Performance Metrics Displayed
The dashboard displays:
- KPI Actual Value
- KPI Target Value
- KPI Previous Month Value
- Percentage Change
Additionally, the scorecard includes:
- Traffic light indicators (Green, Yellow, Red)
- Up and down arrows to show KPI movement
These indicators help managers understand KPI performance quickly.
MTD and YTD View
The dashboard includes two performance views.
MTD (Month-to-Date)
Displays performance metrics for the selected month.
YTD (Year-to-Date)
Displays cumulative performance from the start of the year.
Users simply click MTD or YTD to switch between views.

Click to Buy Private Equity KPI Scorecard in Google Sheets
KPI Trend Sheet
The KPI Trend Sheet provides detailed KPI analysis.
Users select a KPI from the dropdown in cell C3.
The sheet then displays:
- KPI Group
- KPI Unit
- KPI Type
- KPI Performance Type (Lower the better / Upper the better)
- KPI Formula
- KPI Definition
Additionally, the sheet visualizes KPI performance trends over time.
This allows investment managers to monitor KPI growth patterns.

Click to Buy Private Equity KPI Scorecard in Google Sheets
Data Input Sheet
The Data Input Sheet captures the raw data used in the scorecard.
Users enter KPI values for:
- Monthly performance
- Year-to-date performance
This sheet acts as the primary data source for the dashboard.
Because the dashboard references this sheet automatically, updates instantly appear in the scorecard.

Click to Buy Private Equity KPI Scorecard in Google Sheets
KPI Definition Sheet
The KPI Definition Sheet documents the logic behind each KPI.
The sheet includes:
- KPI Name
- KPI Group
- Unit of Measurement
- KPI Formula
- KPI Definition
This documentation ensures that all users understand the meaning and calculation of each KPI.

Click to Buy Private Equity KPI Scorecard in Google Sheets
Color Settings Sheet
The Color Settings Sheet controls visual indicators in the dashboard.
It defines rules for:
- Traffic light colors
- KPI performance thresholds
- Arrow indicators
For example:
- Green = KPI meets or exceeds target
- Yellow = KPI close to target
- Red = KPI below acceptable performance
This visual system makes KPI interpretation quick and intuitive.

Click to Buy Private Equity KPI Scorecard in Google Sheets
Advantages of Private Equity KPI Scorecard in Google Sheets
Using this KPI scorecard provides several benefits.
1. Clear Investment Performance Monitoring
Managers can track multiple KPIs from one centralized dashboard.
2. Interactive KPI Analysis
Dropdown filters allow users to analyze different months easily.
3. Visual Performance Indicators
Traffic lights and arrows make performance interpretation simple.
4. Improved Investment Decision Making
Managers identify underperforming investments quickly.
5. Structured KPI Documentation
Definitions and formulas ensure KPI transparency.
6. Cost-Effective Reporting Tool
Google Sheets provides a free and flexible reporting environment.
Best Practices for Managing Private Equity KPIs
Click to Buy Private Equity KPI Scorecard in Google Sheets
To maximize the value of the KPI scorecard, follow these best practices.
1. Define Clear Investment KPIs
Each KPI should have a clear formula and business purpose.
2. Update Data Regularly
Enter monthly investment performance data consistently.
3. Monitor Trends Over Time
Use the KPI Trend sheet to detect long-term performance patterns.
4. Align KPIs with Investment Strategy
Ensure KPIs reflect the firm’s investment objectives.
5. Review Performance Variances
Investigate large deviations between target and actual performance.
Who Should Use This KPI Scorecard?
Click to Buy Private Equity KPI Scorecard in Google Sheets
This template is valuable for several financial roles.
Private Equity Firms
Track portfolio performance and fund returns.
Investment Managers
Evaluate deal performance and investment outcomes.
Financial Analysts
Analyze portfolio growth and operational efficiency.
Fund Managers
Monitor investment returns and fund performance.
Corporate Finance Teams
Track strategic investment metrics.
Conclusion
Private equity firms require strong performance monitoring systems to manage investments effectively. Without structured analytics, it becomes difficult to evaluate fund performance and portfolio growth.
The Private Equity KPI Scorecard in Google Sheets offers a simple yet powerful solution. It combines KPI tracking, trend analysis, performance indicators, and investment analytics into one interactive dashboard.
Because the scorecard automatically updates based on the selected month and displays performance using visual indicators, managers can quickly assess investment outcomes and make better strategic decisions.
Frequently Asked Questions (FAQs)
Click to Buy Private Equity KPI Scorecard in Google Sheets
1. What is a Private Equity KPI Scorecard?
It is a dashboard that tracks investment performance metrics for private equity funds and portfolios.
2. What is the difference between MTD and YTD performance?
-
MTD (Month-to-Date) shows KPI performance for the selected month.
-
YTD (Year-to-Date) shows cumulative performance from the beginning of the year.
3. Can I customize KPIs in this scorecard?
Yes. Users can add or modify KPIs in the KPI Definition sheet.
4. How do traffic lights work in the dashboard?
Traffic lights indicate KPI performance:
- Green = good performance
- Yellow = moderate performance
- Red = poor performance
5. Is Google Sheets suitable for KPI dashboards?
Yes. Google Sheets supports formulas, charts, conditional formatting, and dashboards.
Visit our YouTube channel to learn step-by-step video tutorials
Youtube.com/@NeotechNavigators
Watch the step-by-step video tutorial: