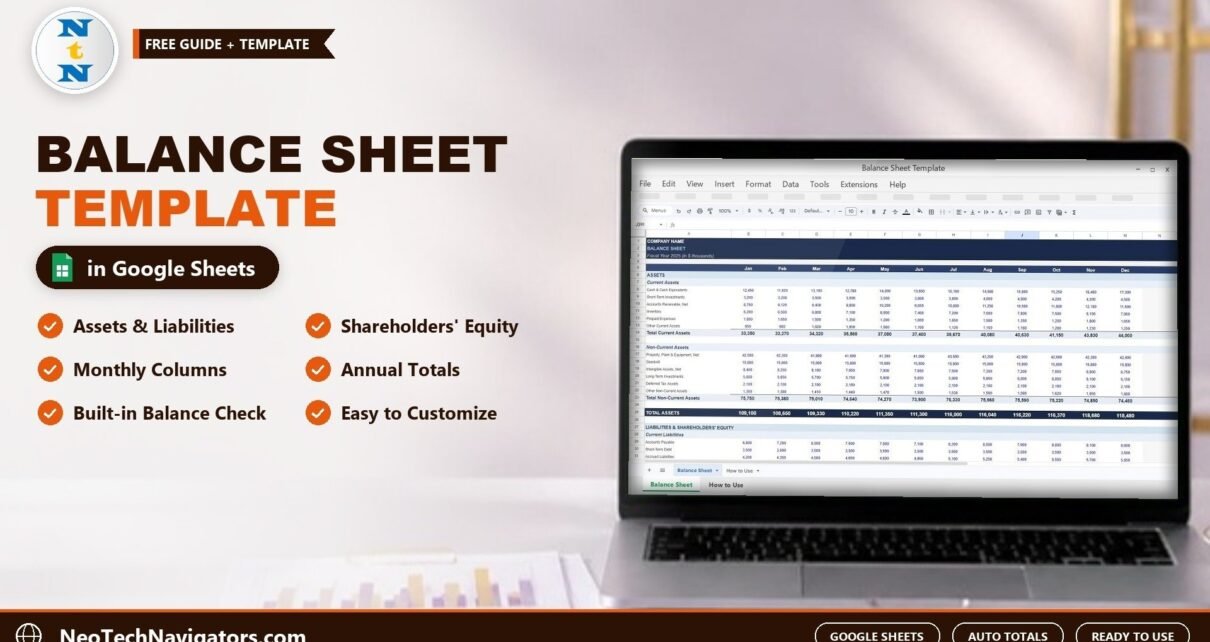
The Balance Sheet Template in Google Sheets gives small businesses, accountants and finance managers a clean, ready-made structure for monthly balance sheets. You enter balances for assets, liabilities and shareholders’ equity, and the template calculates every subtotal, an annual column and a Balance Check that confirms Assets = Liabilities + Shareholders’ Equity.
It suits owners who want to understand their financial position without accounting software, bookkeepers preparing month-end statements for clients, and startups that need a simple balance sheet for investors or lenders. The main Balance Sheet tab has Company Name and Fiscal Year fields at the top, monthly columns from January to December and an annual summary column.
Below you will learn what each section contains, how to read the numbers with a worked example, the key ratios you can calculate from it and how to fill it in correctly.
🎥 Watch the Video Tutorial
Get the Balance Sheet Template
What Is a Balance Sheet and Why Track It Monthly?
A balance sheet is a snapshot of what a business owns (assets), what it owes (liabilities) and what belongs to the owners (equity) on a specific date. It always follows one rule:
Total Assets = Total Liabilities + Shareholders' EquityMost small businesses only produce a balance sheet once a year for tax. Tracking it monthly is far more useful: you see cash falling before it becomes a crisis, notice receivables piling up, and can show a lender a clear trend instead of a single year-end number.
The balance sheet works alongside two other statements. The profit and loss template in Google Sheets shows whether you made money in a period, and the cash flow template in Google Sheets shows how cash moved. The balance sheet shows where you stand at the end of it.
What Is Inside the Balance Sheet Template in Google Sheets
The template follows the standard accounting layout, top to bottom.
Current Assets
Resources expected to turn into cash within a year: Cash & Cash Equivalents, Short-Term Investments, Accounts Receivable, Inventory, Prepaid Expenses and Other Current Assets. The sheet calculates Total Current Assets.
Non-Current Assets
Long-term resources: Property, Plant & Equipment, Goodwill, Intangible Assets, Long-Term Investments, Deferred Tax Assets and Other Non-Current Assets, totalled as Total Non-Current Assets. Current and non-current totals combine into Total Assets.
Current Liabilities
Obligations due within a year: Accounts Payable, Short-Term Debt, Accrued Liabilities, Deferred Revenue and Current Portion of Long-Term Debt, totalled as Total Current Liabilities.
Long-Term Liabilities
Obligations due after a year: Long-Term Loans, Bonds Payable and Lease Liabilities. These roll up with current liabilities into Total Liabilities.
Shareholders’ Equity
The owners’ stake: Share Capital, Retained Earnings and Treasury Stock (which reduces equity), totalled as Total Shareholders’ Equity.
Balance Check
The final row compares Total Assets with Total Liabilities plus Shareholders’ Equity for every month. When the two match, the month balances. When they do not, you know a figure is missing or misclassified before the report goes anywhere.

Template Structure Summary
| Section | Line items | Calculated total |
|---|---|---|
| Current Assets | Cash, Short-Term Investments, Receivables, Inventory, Prepaid, Other | Total Current Assets |
| Non-Current Assets | PP&E, Goodwill, Intangibles, Long-Term Investments, Deferred Tax Assets, Other | Total Non-Current Assets |
| Current Liabilities | Payables, Short-Term Debt, Accrued, Deferred Revenue, Current Portion of LTD | Total Current Liabilities |
| Long-Term Liabilities | Long-Term Loans, Bonds Payable, Lease Liabilities | Total Liabilities |
| Shareholders’ Equity | Share Capital, Retained Earnings, Treasury Stock | Total Shareholders’ Equity |
| Validation | Balance Check | Assets vs Liabilities + Equity |
Worked Example: Reading One Month
Suppose March shows these totals for a small trading business:
- Total Current Assets: $180,000 (including $45,000 cash and $70,000 receivables)
- Total Non-Current Assets: $220,000
- Total Current Liabilities: $100,000
- Long-Term Liabilities: $120,000
- Total Shareholders’ Equity: $180,000
Total Assets = 180,000 + 220,000 = $400,000. Total Liabilities = 100,000 + 120,000 = $220,000, and adding equity gives 220,000 + 180,000 = $400,000. The Balance Check passes.
If you are curious how a check like this is written, the logic in Google Sheets is a simple comparison (illustrative cell names):
Total Assets  = Total_Current_Assets + Total_NonCurrent_Assets
Balance Check = IF(ROUND(Total_Assets - (Total_Liabilities + Total_Equity), 2) = 0, "Balanced", "Check entries")
Key Ratios You Can Calculate From It
The template gives you the inputs for the most common balance sheet ratios. Using the March example:
| Ratio | What it measures | Formula | March result | Better when |
|---|---|---|---|---|
| Current Ratio | Ability to pay short-term obligations | Current Assets ÷ Current Liabilities | 180,000 ÷ 100,000 = 1.8 | Higher (roughly 1.5–2 is comfortable for many businesses) |
| Quick Ratio | Short-term liquidity without inventory | (Current Assets − Inventory) ÷ Current Liabilities | Depends on inventory | Higher |
| Debt-to-Equity | How much the business relies on borrowing | Total Liabilities ÷ Total Equity | 220,000 ÷ 180,000 = 1.22 | Lower |
| Working Capital | Short-term cushion in money terms | Current Assets − Current Liabilities | $80,000 | Higher |
Healthy ranges vary by industry, so compare your ratios with your own past months and with businesses like yours rather than relying on a single rule.
How to Fill It In With Your Own Numbers
- Make a copy with File > Make a copy and enter your Company Name and Fiscal Year.
- Use month-end balances. Take each figure from your bank statements, ledger or trial balance as at the last day of the month, not activity during the month.
- Enter assets first, then liabilities, then equity, working down one monthly column at a time.
- Enter Treasury Stock correctly. It reduces equity, so follow the sign convention already used in the template.
- Check the Balance Check row. If a month does not balance, the most common causes are a missing retained earnings update, a loan entered in the wrong section or a typo.
- Review the annual column at year end and compare month-to-month movements in cash, receivables and debt.
- Customise lines if needed. You can rename or add accounts, but make sure any new row is included in its section total.
Real-World Use Cases
Small business owner preparing for a loan
A shop owner fills in twelve months of balances, shows the lender a steady current ratio and falling debt-to-equity, and has a much easier conversation than with a single year-end figure.
Bookkeeper handling several clients
A freelance bookkeeper keeps one copy per client and updates it at month end from each trial balance. The Balance Check catches posting errors before reports are sent.
Startup reporting to investors
A seed-stage startup shares a view-only link with investors each month. Combined with the cash flow dashboard in Google Sheets, it gives a clear picture of runway and obligations.
Best Practices
- Update monthly, on the same day. Consistent timing makes month-to-month comparisons valid.
- Reconcile cash first. Cash is the easiest figure to verify and anchors the rest of the sheet.
- Keep categories consistent. Moving an item between sections mid-year distorts trends.
- Protect formula cells. Use Data > Protect sheets and ranges so totals and the Balance Check cannot be overwritten.
- Document unusual movements. Add a cell note when a balance jumps, such as a new loan or asset purchase.
Limitations and Who Should Not Use It
- It is not bookkeeping software. It does not record transactions or post journals; it presents balances you already have.
- No automatic link to a P&L. Retained earnings must be updated from your profit figures yourself.
- Not a substitute for an accountant. For audited or statutory accounts, work with a qualified professional and your local reporting standards.
- Personal finances. Individuals tracking their own net worth will find the annual personal financial statement template a better fit.
If you work mainly in Excel, there is also a Balance Sheet Template in Excel with the same structure.
To get more confident with the formulas behind financial templates like this, from SUM and IF checks to lookups that pull figures from a trial balance, the Excel AI Mastery: 100 Formulas course on NextGenTemplates Academy is a practical next step.
Get the Google Sheets Balance Sheet Template
Frequently Asked Questions
How do I make a balance sheet in Google Sheets?
List current and non-current assets, current and long-term liabilities and equity, total each section, then check that total assets equal liabilities plus equity. The Balance Sheet Template in Google Sheets has this structure and the formulas ready, so you only enter balances.
Why doesn’t my balance sheet balance?
Usually because retained earnings were not updated for the period’s profit or loss, a liability was entered as an asset, or a figure is missing. Compare each section with your trial balance.
Can small businesses use this template?
Yes. It is designed for small businesses, startups and consultants who need clear monthly balance sheets without accounting software.
Does it calculate totals automatically?
Yes. Section totals, Total Assets, Total Liabilities, Total Equity, the annual column and the Balance Check are all formula-driven.
Can I add my own accounts?
Yes. Rename existing lines or insert new ones inside a section, then confirm the section total includes the new row.
What is the difference between a balance sheet and a profit and loss statement?
A balance sheet shows financial position at a point in time. A profit and loss statement shows income and expenses over a period. You need both to understand a business.
Wrapping Up
A monthly balance sheet is one of the simplest ways to see whether a business is getting stronger or weaker. The Balance Sheet Template in Google Sheets handles the structure, totals and validation, so you can focus on reading the trend. Enter last month’s closing balances today, confirm the Balance Check passes and calculate your current ratio. For a broader financial overview, the small business CFO dashboard in HTML is worth a look.
📅 Last updated: October 2026