In the fast-paced world of property sales, having clear insights into performance metrics is vital for success. The Real Estate Sales Performance Dashboard in Google Sheets helps real estate professionals, developers, and agencies track property sales, costs, area utilization, client types, and regional performance—all in one interactive, easy-to-use platform.Real Estate Sales Performance Dashboard in Google Sheets
This ready-to-use dashboard offers real-time visibility into sales performance using cards, charts, and automated analytics that update instantly when new data is entered.Real Estate Sales Performance Dashboard in Google Sheets
What Is the Real Estate Sales Performance Dashboard in Google Sheets?
The Real Estate Sales Performance Dashboard is a data visualization tool built in Google Sheets that allows real estate businesses to measure and monitor their key metrics—like total cost, total area sold, property count, and client segmentation.
It simplifies tracking by aggregating sales and property data automatically while offering deep insights through charts categorized by status, region, lead source, property type, and client type.Real Estate Sales Performance Dashboard in Google Sheets
Whether you are managing residential or commercial projects, this dashboard provides a comprehensive view of your business performance.
Click to Buy Real Estate Sales Performance Dashboard in Google Sheets
Dashboard Structure
This Google Sheets dashboard includes three main sections:
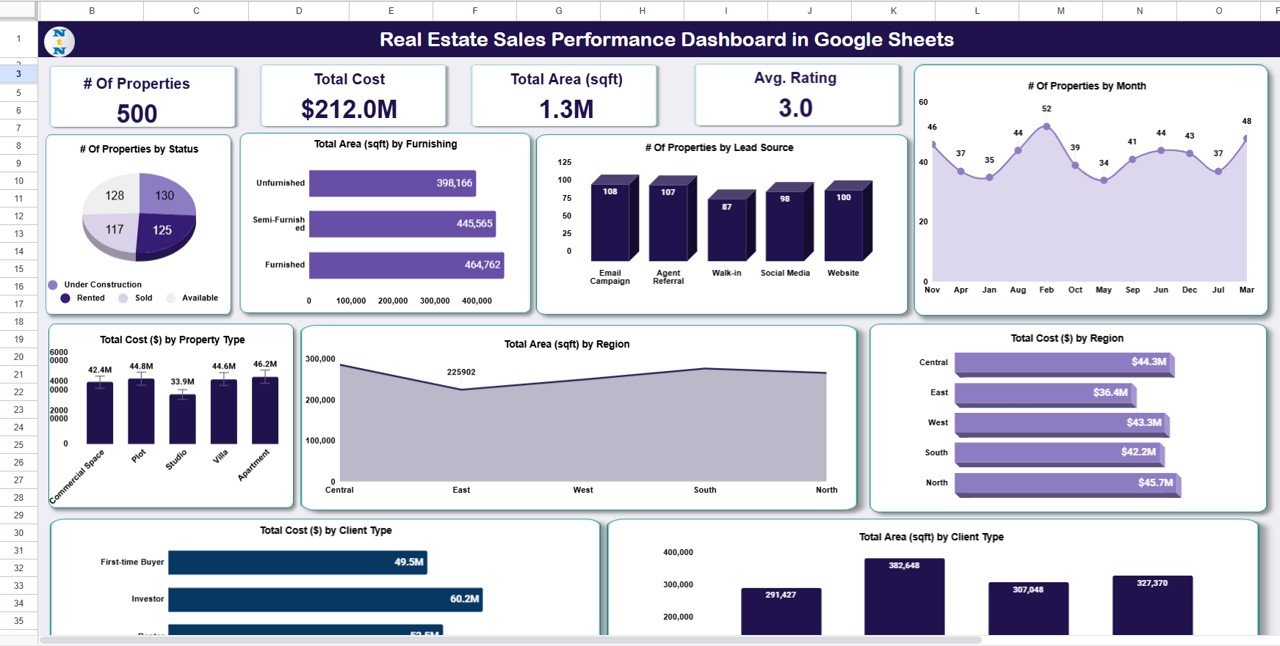
Dashboard Sheet Tab
This is the core analytics and visualization page of the template.
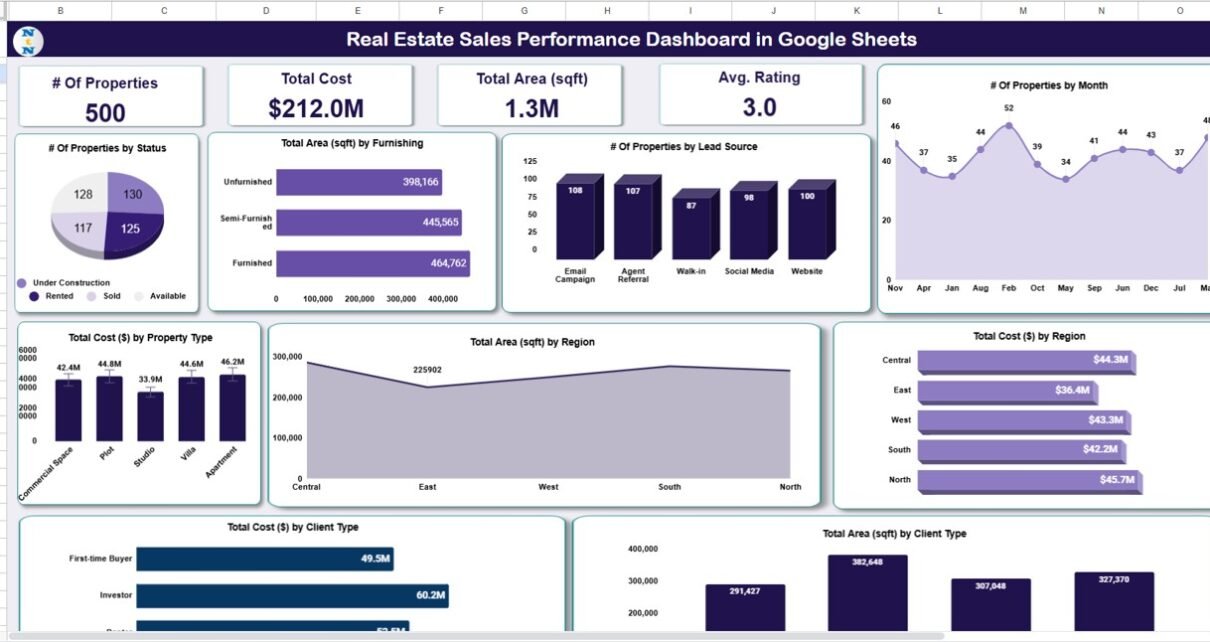
It displays key performance indicators (KPIs) at the top, along with detailed interactive charts below.
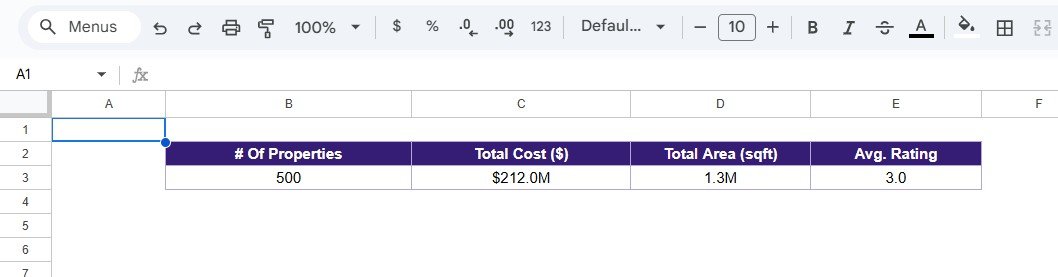
Cards Displayed:
-
# of Properties: Total number of properties tracked in the system.
-
Total Cost ($): Total sales or valuation of all properties combined.
-
Total Area (sqft): Aggregate area of all listed or sold properties.
-
Average Rating: Average customer or property rating for quality and satisfaction.
Charts Displayed:
- of Properties by Status
- Total Area (sqft) by Furnishing
- of Properties by Lead Source
- of Properties by Month
- Total Cost ($) by Region
- Total Area (sqft) by Region
- Total Cost ($) by Property Type
- Total Area (sqft) by Client Type
- Total Cost ($) by Client Type
Each chart dynamically updates when you change filters or enter new data.
Click to Buy Real Estate Sales Performance Dashboard in Google Sheets
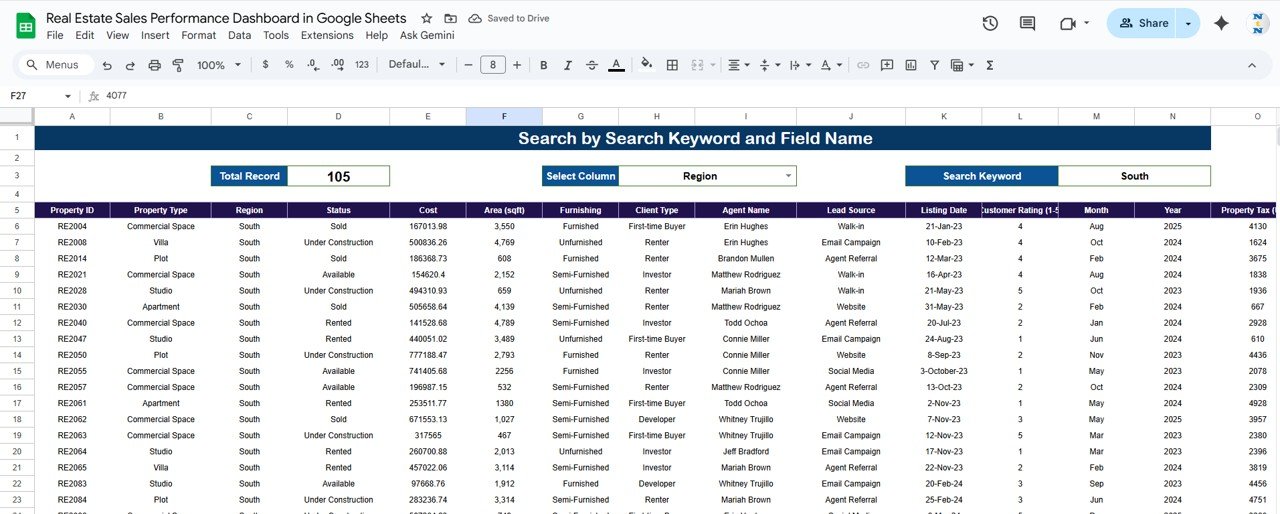
Search Sheet Tab
This tab allows users to search specific records using keywords or field names.
For example:
-
Search for “Region = East” to filter properties in the eastern zone.
-
Search for “Status = Sold” to see all completed transactions.
This feature saves time and simplifies data management.
Click to Buy Real Estate Sales Performance Dashboard in Google Sheets
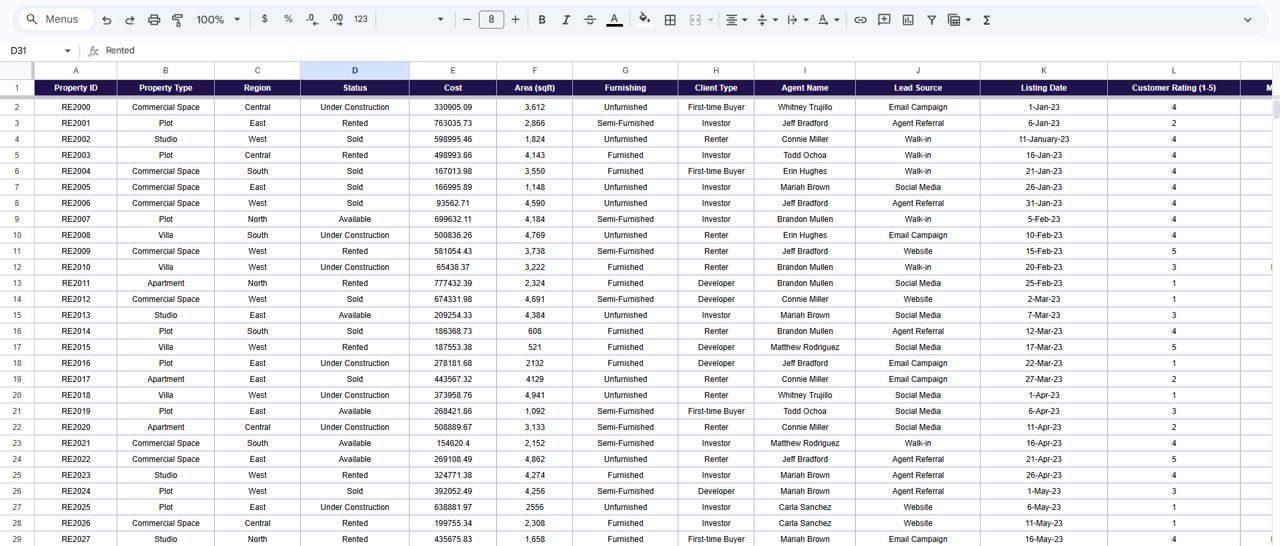
Data Sheet Tab
The Data Sheet Tab is the backbone of the dashboard where you input raw data.
The dashboard automatically aggregates this information into summaries and visuals.
Support Sheet Tab
This sheet contains the backend formulas, dropdown lists, and data validation settings that power the entire dashboard.
Users should avoid altering this sheet to maintain dashboard integrity.
Click to Buy Real Estate Sales Performance Dashboard in Google Sheets
Advantages
-
Instant Performance Overview: Provides a real-time snapshot of sales data.
-
Regional Insights: Understand which regions perform best in revenue and area sold.
-
Client Segmentation: Helps track sales by client type and lead source.
-
Automated Charts: Visual indicators show performance by category.
-
Cloud-Based: Google Sheets enables multi-user access and collaboration.
Opportunities for Improvement
Click to Buy Real Estate Sales Performance Dashboard in Google Sheets
-
Integrate Google Forms to collect new property leads automatically.
-
Add trend indicators for month-over-month cost growth.
-
Include a profit margin KPI for each property.
-
Connect the dashboard to Google Data Studio for enhanced visualization.
-
Automate alerts for low-performing regions or statuses.
Best Practices
-
Keep data updated weekly for accuracy.
-
Protect formula cells and dashboard visuals.
-
Use consistent region and furnishing names for clean analytics.
-
Validate property IDs to prevent duplicates.
-
Track month-on-month performance using pivot trends.
Conclusion
Click to Buy Real Estate Sales Performance Dashboard in Google Sheets
The Real Estate Sales Performance Dashboard in Google Sheets is a must-have tool for property managers and agencies aiming to make informed, data-backed decisions.
By combining sales, area, client, and regional analytics, it provides a unified view of your real estate business performance. Its automated charts, KPI cards, and searchable interface make it both powerful and user-friendly — perfect for professionals who want to grow smarter and faster.
Visit our YouTube channel to learn step-by-step video tutorials
Youtube.com/@NeotechNavigators
Watch the step-by-step video Demo:
Click to Buy Real Estate Sales Performance Dashboard in Google Sheets