KPI Dashboard

Broadcasting KPI Scorecard In Google Sheets

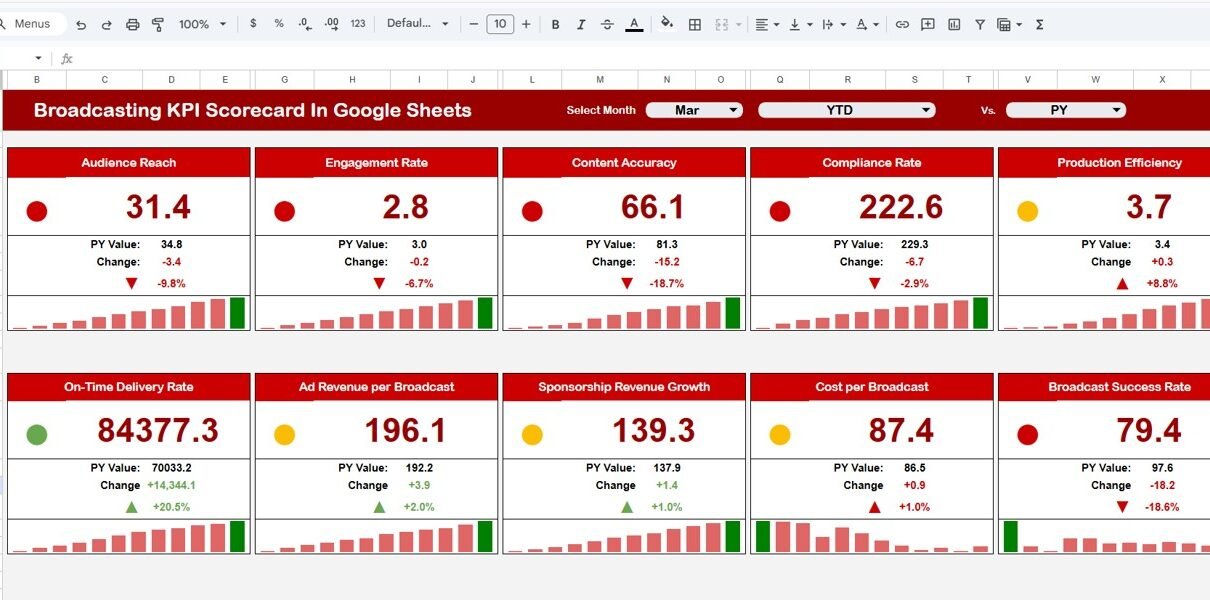
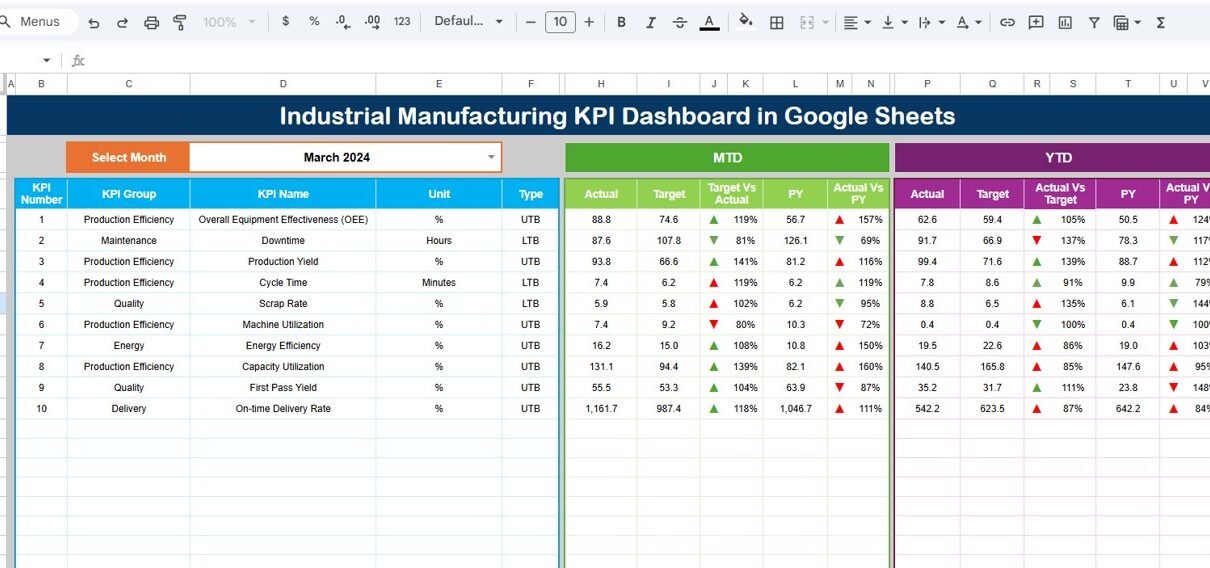
Introduction Broadcasting KPI Scorecard in Google Sheets is a ready-to-use template designed to help you efficiently track and analyze key performance indicators (KPIs) specific to the broadcasting industry. With its user-friendly interface and comprehensive data visualization, this scorecard enables quick insights into your broadcasting operations’ performance on a monthly, MTD, and YTD basis. Key Features […]

KPI Dashboard

Customer Churn KPI Dashboard in Google Sheets

Introduction Customer churn is a critical metric for businesses aiming to retain customers and grow sustainably. Monitoring churn rates effectively can guide strategic decisions and operational improvements. This article presents a detailed overview of a Customer Churn KPI Dashboard in Google Sheets, a ready-to-use template designed to help businesses track and analyze their churn metrics […]

KPI Dashboard

Mass Media KPI Scorecard in Google Sheets

In today’s fast-paced media industry, tracking performance is more important than ever. Whether you manage digital campaigns, television broadcasting, radio channels, or online media platforms, you deal with massive amounts of performance data daily. However, when this data is scattered across multiple sheets, it becomes difficult to analyze trends and make informed decisions.Mass Media KPI […]

KPI Dashboard

Water Supply KPI Scorecard in Google Sheets

In today’s fast-growing urban environment, managing water supply efficiently becomes more important than ever. Municipal authorities, utility companies, and infrastructure teams handle massive amounts of operational data daily. However, when this data remains scattered, it becomes difficult to track performance and make timely decisions.Water Supply KPI Scorecard in Google Sheets So, how can water supply […]

KPI Dashboard

Network Performance KPI Dashboard in Google Sheets

In today’s digital world, network performance plays a critical role in business success. Whether you manage IT infrastructure, telecom systems, or cloud networks, you must track performance continuously. However, when network data spreads across multiple files and tools, it becomes difficult to monitor KPIs effectively.Network Performance KPI Dashboard in Google Sheets So, how can IT […]

KPI Dashboard

Agile Sprint KPI Dashboard in Google Sheets

In today’s fast-paced software development world, Agile teams work in short sprints to deliver value quickly. However, tracking sprint performance, team productivity, and delivery efficiency becomes challenging without proper tools. Many teams still rely on scattered spreadsheets. As a result, they struggle to monitor KPIs, compare targets, and improve performance. Therefore, organizations now adopt smart […]

KPI Dashboard

Private Equity KPI Scorecard in Google Sheets

Private equity firms operate in a highly competitive and performance-driven environment. Investors expect clear visibility into portfolio growth, returns, operational efficiency, and fund performance. However, many firms still track performance using scattered spreadsheets or manual reports. As a result, managers struggle to analyze investment performance quickly and accurately. A Private Equity KPI Scorecard in Google […]

KPI Dashboard

Dealer Network KPI Dashboard in Google Sheets

Managing a dealer network without clear performance metrics creates confusion and slow decision-making. Sales managers often struggle to track dealer productivity, market coverage, sales performance, and growth trends. As a result, they miss opportunities to improve dealer performance and expand market reach. However, a Dealer Network KPI Dashboard in Google Sheets solves this problem effectively. […]

KPI Dashboard

Industrial Manufacturing KPI Dashboard in Google Sheets

Industrial manufacturing organizations operate in a highly competitive and efficiency-driven environment. Production targets, quality standards, costs, safety, and delivery timelines must stay under constant control. However, many manufacturing teams still rely on manual spreadsheets and disconnected reports. As a result, visibility drops and decision-making slows down. That is exactly where an Industrial Manufacturing KPI Dashboard […]

KPI Dashboard

Crisis Response KPI Dashboard in Google Sheets

During emergencies, incidents, or unexpected disruptions, organizations must respond quickly, accurately, and efficiently. Whether it is a natural disaster, IT outage, security incident, health emergency, or operational crisis, decision-makers need real-time visibility into response performance. However, many teams still rely on manual reports, scattered spreadsheets, or delayed updates, which slow down critical actions. That is […]