Managing a vacation rental business requires constant monitoring of occupancy, revenue, costs, guest satisfaction, and operational efficiency. However, many property owners and managers still rely on multiple spreadsheets or manual reports. As a result, performance gaps remain hidden and decisions become reactive.Vacation Rental KPI Dashboard in Google Sheets
That is exactly why a Vacation Rental KPI Dashboard in Google Sheets becomes an essential performance tracking tool.
This ready-to-use KPI dashboard helps vacation rental owners, property managers, and hospitality teams track key performance indicators using a structured, visual, and easy-to-use Google Sheets dashboard.Vacation Rental KPI Dashboard in Google Sheets
In this article, we explain the dashboard structure, worksheets, KPIs, advantages, best practices, and frequently asked questions.Vacation Rental KPI Dashboard in Google Sheets
What Is a Vacation Rental KPI Dashboard in Google Sheets?
Click to Buy Vacation Rental KPI Dashboard in Google Sheets
A Vacation Rental KPI Dashboard is a centralized reporting system that tracks the most important metrics related to rental performance. Instead of reviewing raw booking and revenue data, users can instantly view performance through KPIs, comparisons, and trends.
Because this dashboard is built in Google Sheets, it provides:
-
Real-time performance visibility
-
Easy collaboration with teams
-
Automatic KPI calculations
-
Interactive monthly and yearly analysis
-
No additional software cost
This dashboard suits Airbnb hosts, vacation rental managers, hospitality firms, and real estate investors.
Key Features of the Vacation Rental KPI Dashboard
This dashboard is ready to use and structured across multiple worksheets to ensure clarity, flexibility, and scalability.
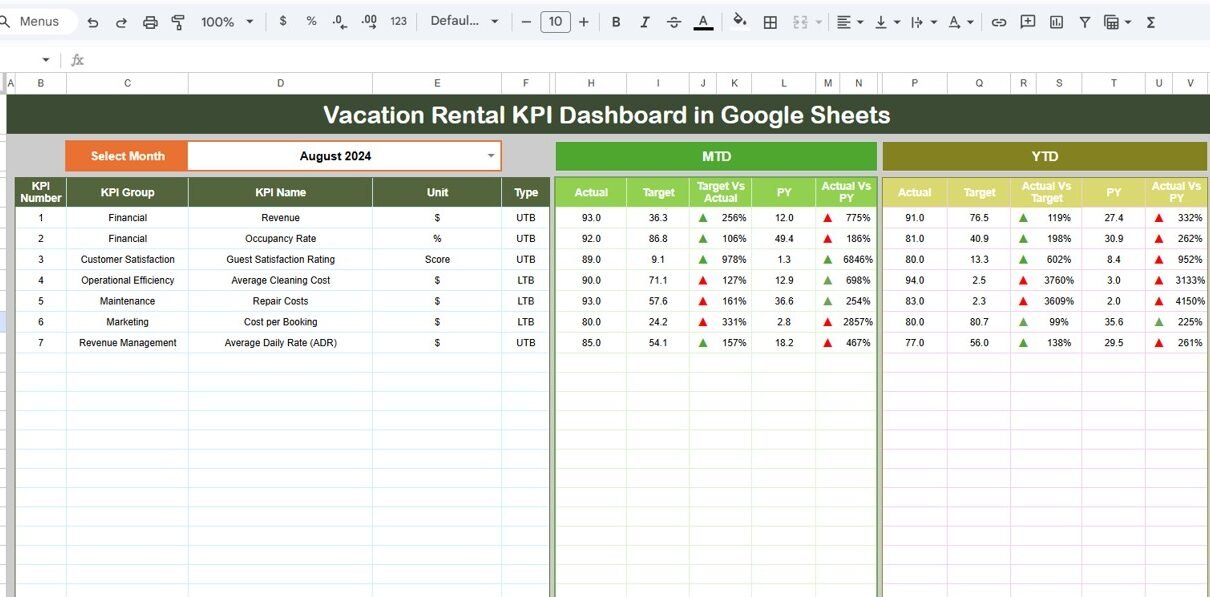
Dashboard Sheet Tab – KPI Performance Overview
The Dashboard Sheet is the main sheet where all KPIs are displayed.
🔹 Month Selection
-
A Month dropdown in cell D3 allows users to select any month.
-
Once selected, all KPI values update automatically.
🔹 KPI Metrics Displayed
The dashboard shows:
-
MTD (Month-to-Date) Actual
-
MTD Target
-
MTD Previous Year
-
Target vs Actual comparison
-
Previous Year vs Actual comparison
All comparisons use conditional formatting with up/down arrows.
🔹 YTD Performance
The dashboard also displays:
-
YTD Actual
-
YTD Target
-
YTD Previous Year
-
Variance indicators using conditional formatting
This layout helps users track both short-term and long-term rental performance.

Click to Buy Vacation Rental KPI Dashboard in Google Sheets
KPI Trend Sheet Tab
The KPI Trend Sheet provides detailed insights into a selected KPI.
🔹 KPI Selection
-
Users select a KPI from the dropdown in cell C3.
🔹 KPI Information Displayed
For the selected KPI, the sheet shows:
-
KPI Group
-
Unit of Measurement
-
KPI Type (Lower the Better / Upper the Better)
-
KPI Formula
-
KPI Definition
This sheet improves KPI transparency and understanding.

Actual Number Sheet Tab
Click to Buy Vacation Rental KPI Dashboard in Google Sheets
This sheet is used to enter actual performance data.
🔹 Key Features
-
Enter MTD and YTD actual values for each KPI.
-
Change the month using cell E1.
-
Enter the first month of the year to auto-align YTD calculations.
All dashboard visuals update automatically based on this data.

Target Sheet Tab
The Target Sheet stores planned performance values.
🔹 What You Enter
-
Monthly MTD targets
-
Cumulative YTD targets
This sheet allows teams to measure actual performance against defined goals.

Click to Buy Vacation Rental KPI Dashboard in Google Sheets
Previous Year Number Sheet Tab
This sheet captures previous year data for comparison.
🔹 Purpose
-
Enter last year’s MTD and YTD values.
-
Enable year-over-year performance analysis.
This helps identify growth trends and seasonal patterns.

KPI Definition Sheet Tab
The KPI Definition Sheet acts as the KPI master.
🔹 Columns Included
-
KPI Name
-
KPI Group
-
Unit
-
Formula
-
KPI Definition
-
KPI Type (LTB / UTB)
This sheet ensures KPI consistency and governance.

Click to Buy Vacation Rental KPI Dashboard in Google Sheets
Why Vacation Rental Businesses Need This Dashboard
Without a KPI dashboard, vacation rental management becomes guesswork. This dashboard helps businesses:
-
Track performance in real time
-
Compare actual vs target results
-
Analyze trends across months and years
-
Improve pricing and occupancy strategies
-
Control operational costs
A single dashboard creates clarity and confidence.
Advantages of the Vacation Rental KPI Dashboard
Click to Buy Vacation Rental KPI Dashboard in Google Sheets
-
Centralized KPI tracking
-
Clear MTD and YTD performance visibility
-
Automatic comparisons with targets and prior year
-
Easy KPI understanding through definitions
-
Fully customizable Google Sheets solution
-
No technical expertise required
Opportunities for Improvement
You can enhance this dashboard further by adding:
-
Property-wise performance analysis
-
Channel-wise booking metrics (Airbnb, Booking.com, etc.)
-
Guest satisfaction survey scores
-
Revenue forecasting
-
Automated data imports
These enhancements provide deeper business insights.
Best Practices for Using the Dashboard
Click to Buy Vacation Rental KPI Dashboard in Google Sheets
-
Update actual data regularly
-
Set realistic monthly and yearly targets
-
Review KPIs weekly during peak seasons
-
Monitor cancellation and cost KPIs closely
-
Share insights with operations and pricing teams
-
Protect sensitive data with access permissions
Conclusion
A Vacation Rental KPI Dashboard in Google Sheets provides a powerful yet simple way to monitor rental performance, revenue, and costs. It replaces scattered spreadsheets with a single source of truth, improves decision-making, and supports business growth. Because it is ready to use and cloud-based, vacation rental teams can start tracking performance immediately.
For anyone managing vacation rental properties, this dashboard becomes an essential performance management tool.
Frequently Asked Questions (FAQs)
Click to Buy Vacation Rental KPI Dashboard in Google Sheets
1. Who should use this dashboard?
Vacation rental owners, property managers, and hospitality teams.
2. Can it track multiple properties?
Yes, with property identifiers added to the data sheets.
3. Is the dashboard customizable?
Yes, KPIs, formulas, and visuals can be modified.
4. Does it support year-over-year analysis?
Yes, through the previous year comparison sheet.
5. Is Google Sheets secure for business data?
Yes, with proper sharing and access controls.
6. Does it require advanced Excel or Sheets skills?
No, basic Google Sheets knowledge is enough.
Visit our YouTube channel to learn step-by-step video tutorials
Youtube.com/@NeotechNavigators
Watch the step-by-step video tutorial: