Fleet operations never slow down. Vehicles move daily. Fuel prices fluctuate. Maintenance costs increase. Delivery timelines tighten. Therefore, fleet managers must track utilization, cost, efficiency, and downtime continuously.Fleet Utilization KPI Dashboard in Google Sheets
However, many companies still depend on manual spreadsheets. As a result, they struggle to measure vehicle performance. They miss maintenance signals. They fail to compare actual vs target. Moreover, they cannot track year-over-year improvements clearly.
So, how can you monitor fleet utilization, fuel efficiency, downtime, maintenance cost, and revenue performance in one structured system?
Fleet Utilization KPI Dashboard in Google Sheets
You need a Fleet Utilization KPI Dashboard in Google Sheets.
In this detailed guide, you will learn:
- What a Fleet Utilization KPI Dashboard in Google Sheets is
- Complete KPI list with unit, formula, aggregation method, and KPI type
- Detailed explanation of all 6 worksheets
- Advantages of Fleet Utilization KPI Dashboard
- Best Practices for the Fleet Utilization KPI Dashboard
- Frequently Asked Questions with Answers
Let us explore everything step by step.
What Is a Fleet Utilization KPI Dashboard in Google Sheets?
Click to Buy Fleet Utilization KPI Dashboard in Google Sheets
A Fleet Utilization KPI Dashboard in Google Sheets is a ready-to-use performance tracking system designed for:
- Logistics companies
- Transport operators
- Delivery businesses
- Rental fleet operators
- Construction vehicle fleets
It helps you:
- Track Monthly (MTD) performance
- Monitor Year-to-Date (YTD) performance
- Compare Target vs Actual
- Compare Previous Year vs Current Year
- Identify performance gaps using conditional formatting
Moreover, Google Sheets allows real-time collaboration. Therefore, multiple managers can update data and monitor KPIs simultaneously.
Explanation of All 6 Worksheets
This Fleet Utilization KPI Dashboard in Google Sheets contains 6 powerful worksheets.
Let us understand each sheet clearly.
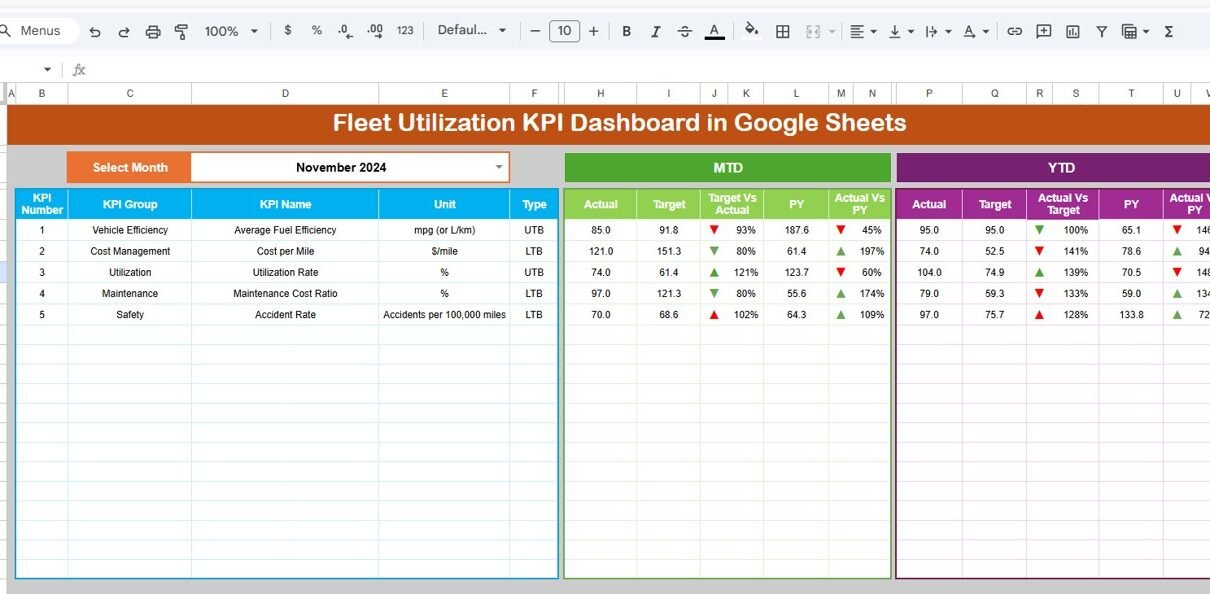
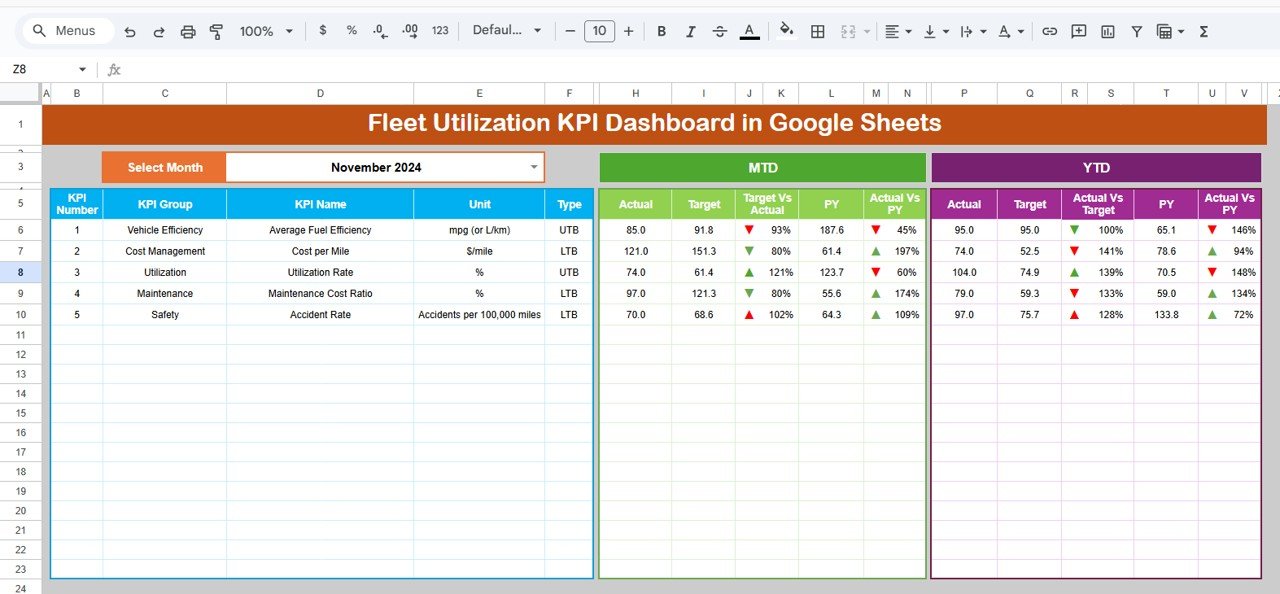
Dashboard Sheet Tab – Central Performance View
Click to Buy Fleet Utilization KPI Dashboard in Google Sheets
This is the main dashboard page.
Key Features:
- Month selection dropdown in Range D3
- Dynamic MTD & YTD calculation
- Target vs Actual comparison
- Previous Year vs Actual comparison
- Conditional formatting with up/down arrows
What You Can See:
For each KPI, the dashboard shows:
- MTD Actual
- MTD Target
- MTD Previous Year
- YTD Actual
- YTD Target
- YTD Previous Year
Moreover, conditional arrows highlight performance direction.
Therefore, managers can instantly identify strong or weak KPIs.
Click to Buy Fleet Utilization KPI Dashboard in Google Sheets
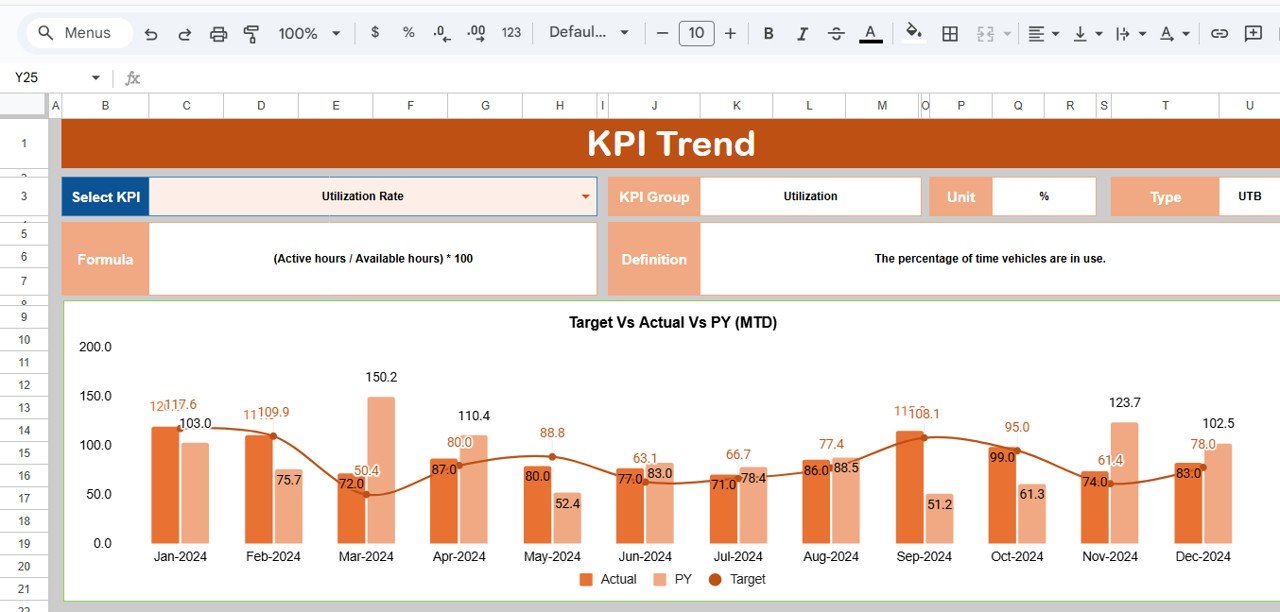
KPI Trend Sheet Tab – Detailed KPI View
Here, you can select the KPI name from dropdown in Range C3.
The sheet displays:
- KPI Group
- Unit
- KPI Type (Lower/Upper the Better)
- Formula
- KPI Definition
- Trend Chart
Thus, managers can analyze KPI behavior across months.
Click to Buy Fleet Utilization KPI Dashboard in Google Sheets
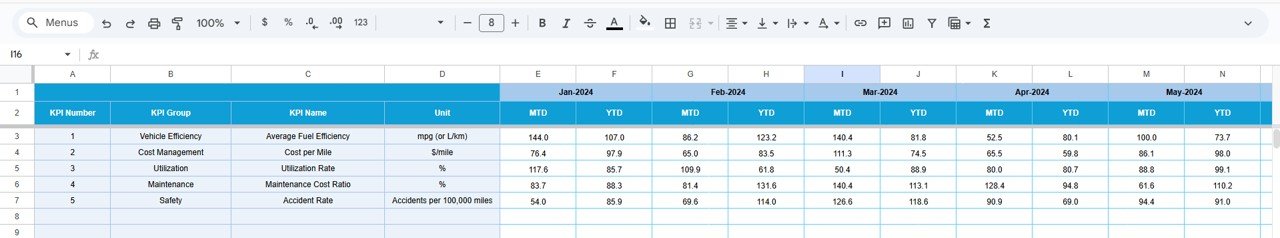
Actual Number Sheet Tab
This sheet captures actual MTD and YTD values.
Key Feature:
-
Month input in Range E1
-
Enter first month of the year in E1
When you update actual data, the dashboard updates automatically.
Click to Buy Fleet Utilization KPI Dashboard in Google Sheets
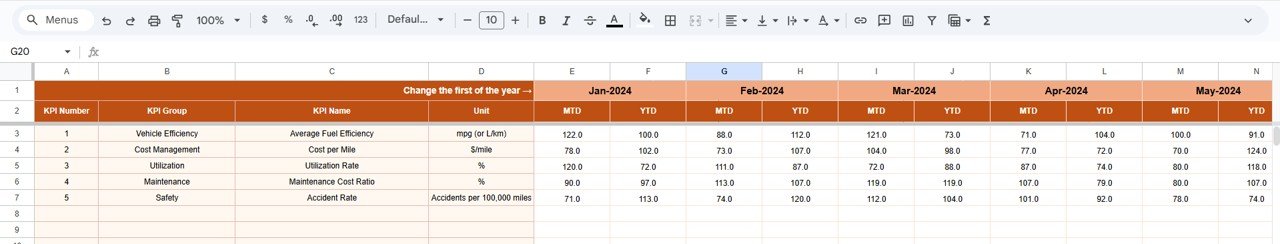
Target Sheet Tab
In this sheet:
-
Enter monthly MTD targets
-
Enter YTD cumulative targets
Therefore, the dashboard can compare actual vs target easily.
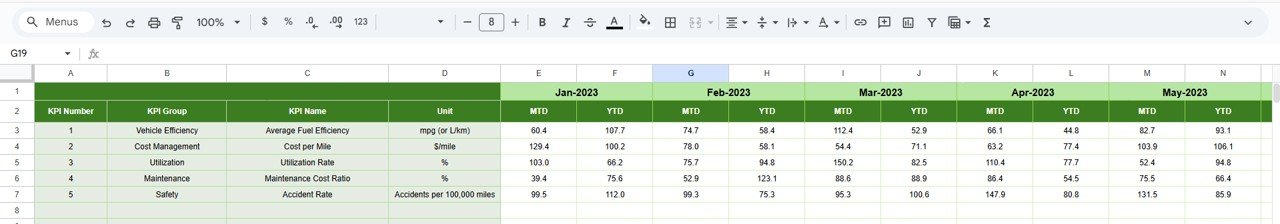
Previous Year Number Sheet Tab
Here, enter previous year data.
This enables:
- Year-over-Year comparison
- Performance growth tracking
- Strategic forecasting
Click to Buy Fleet Utilization KPI Dashboard in Google Sheets
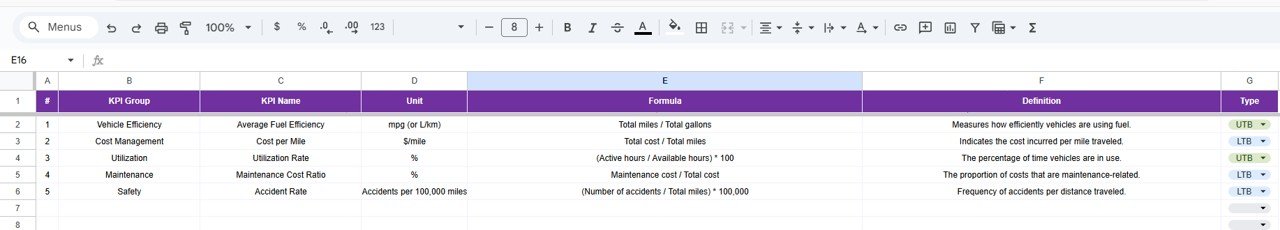
KPI Definition Sheet Tab
This sheet acts as the master reference.
You must enter:
- KPI Name
- KPI Group
- Unit
- Formula
- KPI Definition
Thus, the system remains structured and transparent.
Click to Buy Fleet Utilization KPI Dashboard in Google Sheets
Advantages of Fleet Utilization KPI Dashboard in Google Sheets
Using this dashboard offers major benefits.
1. Real-Time Collaboration
Teams can update data simultaneously.
2. Clear Target Tracking
Managers instantly see whether KPIs meet targets.
3. Improved Cost Control
You can monitor maintenance and fuel cost easily.
4. Better Vehicle Utilization
You can detect underutilized vehicles quickly.
5. Enhanced Decision Making
Data-driven insights improve operational strategy.
6. Time Saving
Automated calculations reduce manual effort.
Best Practices for the Fleet Utilization KPI Dashboard
Click to Buy Fleet Utilization KPI Dashboard in Google Sheets
To maximize dashboard performance, follow these best practices:
1. Update Data Monthly
Enter actual numbers consistently.
2. Maintain Accurate Definitions
Clearly define formulas in KPI Definition sheet.
3. Monitor Lower the Better KPIs Closely
Downtime, accident rate, and cost per KM require attention.
4. Use Conditional Formatting Smartly
Arrows must reflect KPI type logic properly.
5. Review Trends Quarterly
Monthly review improves forecasting.
6. Align KPIs with Business Goals
Choose KPIs relevant to your fleet strategy.
Conclusion
Click to Buy Fleet Utilization KPI Dashboard in Google Sheets
Fleet management requires precision. Companies must track cost, utilization, revenue, safety, and efficiency at the same time.
However, without a structured KPI system, managers cannot detect problems early.
The Fleet Utilization KPI Dashboard in Google Sheets solves this challenge.
It provides:
- MTD & YTD tracking
- Target vs Actual comparison
- Previous Year comparison
- Dynamic KPI selection
- Clear KPI definitions
- Real-time collaboration
Therefore, it becomes a powerful tool for fleet optimization.
Frequently Asked Questions with Answers
Click to Buy Fleet Utilization KPI Dashboard in Google Sheets
1. Can I customize KPIs?
Yes. You can add or modify KPIs in the KPI Definition sheet.
2. Does the dashboard support automatic updates?
Yes. When you enter data in Actual, Target, or Previous Year sheets, the dashboard updates automatically.
3. Can I use this dashboard for a rental fleet?
Yes. It works perfectly for rental, logistics, and transport fleets.
4. How often should I update the dashboard?
You should update it monthly for accurate MTD and YTD tracking.
5. Can multiple users edit this dashboard?
Yes. Google Sheets allows real-time collaboration.
Visit our YouTube channel to learn step-by-step video tutorials
Youtube.com/@NeotechNavigators
Watch the step-by-step video tutorial:
Click to Buy Fleet Utilization KPI Dashboard in Google Sheets