Managing IT operations without structured reporting creates confusion, delays, and performance gaps. However, many organizations still depend on scattered spreadsheets and manual reports. As a result, IT managers struggle to monitor ticket volume, resolution time, SLA compliance, and agent productivity in one place.
Therefore, businesses need a centralized and interactive reporting system. The IT Dashboard in Google Sheets provides a powerful yet simple solution. It tracks ticket performance, SLA compliance, department efficiency, agent productivity, and monthly trends — all inside one dynamic dashboard.
In this article, we will explain the complete structure, features, KPIs, analysis pages, advantages, and best practices of the IT Dashboard in Google Sheets.IT Dashboard in Google Sheets
What Is an IT Dashboard in Google Sheets?
Click to Buy IT Dashboard in Google Sheets
An IT Dashboard in Google Sheets is a structured performance monitoring tool that tracks IT support metrics using dynamic charts, filters, and slicers.
Instead of reviewing raw ticket data manually, managers analyze performance through visual summaries. Moreover, because the dashboard uses dropdown filters, users can analyze performance by:
- Year
- Month
- Department
- Ticket Type
- Priority
- Status
- Assigned Agent
As a result, decision-makers gain real-time insights without complex software.
Why Do IT Teams Need a Dashboard?
IT departments manage large volumes of service requests daily. However, without structured KPI tracking, teams cannot measure performance accurately.
Common Challenges Without an IT Dashboard
- Unclear SLA compliance
- Rising resolution time
- High backlog of open tickets
- Poor visibility of high-priority issues
- Lack of agent performance tracking
Therefore, an IT Dashboard ensures visibility, accountability, and performance improvement.
Overview of IT Dashboard Pages
This IT Dashboard includes multiple structured analysis pages:
- Main Dashboard
- Department Analysis
- Ticket Analysis
- Assigned Agent Analysis
- Monthly Trends
Each page provides a different performance perspective.
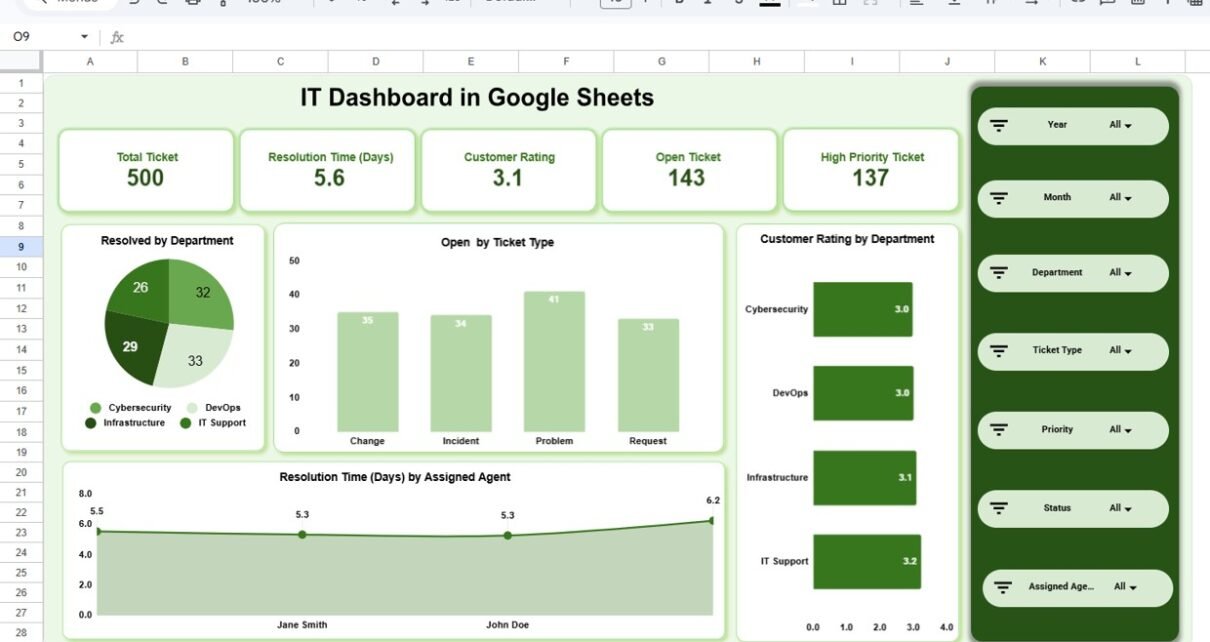
Main Dashboard Page
This page acts as the command center for IT performance monitoring.
Top KPI Summary Cards
The dashboard displays key IT performance metrics:
- Total Tickets
- Average Resolution Time (Days)
- Customer Rating
- Open Tickets
- High Priority Tickets
Because these KPIs appear at the top, managers quickly understand overall IT health.
Key Visual Charts
🔹 Resolved by Department
Shows how many tickets each department resolved:
🔹 Open by Ticket Type
Displays open tickets by:
🔹 Customer Rating by Department
Tracks service satisfaction across departments.
🔹 Resolution Time by Assigned Agent
Shows agent-level efficiency.
Because this page combines summary metrics with visual charts, leadership reviews performance in seconds.

Click to Buy IT Dashboard in Google Sheets
Department Analysis Page
This page analyzes department-level performance in detail.
Key Metrics Included:
- SLA Met by Department
- Resolution Time (Days) by Department
- High Priority Tickets by Department
- Tickets Resolved by Department’

Click to Buy IT Dashboard in Google Sheets
Ticket Analysis Page
This page focuses on ticket types and their performance.
Key Insights:
- SLA Met by Ticket Type
- Resolution Time by Ticket Type
- High Priority Tickets by Ticket Type
- Resolved Tickets by Ticket Type

Click to Buy IT Dashboard in Google Sheets
Assigned Agent Analysis Page
This page measures agent-level productivity.
Key Metrics:
- SLA Met by Assigned Agent
- Resolution Time by Assigned Agent
- High Priority Tickets by Assigned Agent
- Tickets Resolved by Assigned Agent

Click to Buy IT Dashboard in Google Sheets
Monthly Trends Page
This page analyzes time-based performance.
Charts Included:
- SLA Met by Month
- Resolution Time by Month
- High Priority Tickets by Month
- Resolved Tickets by Month

Click to Buy IT Dashboard in Google Sheets
Advantages of IT Dashboard in Google Sheets
Using this dashboard provides multiple benefits.
Real-Time Performance Visibility
Managers monitor ticket performance instantly.
Interactive Filtering
Dropdown filters allow dynamic analysis.
Improved SLA Monitoring
SLA compliance appears clearly across departments and agents.
Faster Decision Making
Visual insights reduce manual reporting time.
Cloud Collaboration
Google Sheets enables multi-user access.
Cost Effective
No expensive BI software required.
Easy Customization
Users modify KPIs and visuals easily.
Best Practices for IT Dashboard Implementation
Click to Buy IT Dashboard in Google Sheets
To maximize effectiveness, follow these practices.
1. Define SLA Clearly
Ensure accurate SLA tracking.
2. Update Ticket Data Regularly
Maintain consistent data entry.
3. Monitor LTB KPIs Closely
Track resolution time and open tickets carefully.
4. Analyze Trends Monthly
Use trend analysis for resource planning.
5. Set Clear Targets
Define measurable SLA and resolution benchmarks.
6. Avoid Data Overload
Focus on key performance indicators.
7. Train IT Managers
Ensure proper dashboard usage.
Conclusion
Click to Buy IT Dashboard in Google Sheets
The IT Dashboard in Google Sheets provides a complete performance monitoring solution for IT departments. Because it combines KPI cards, visual charts, filtering options, department analysis, agent performance tracking, and monthly trends, it delivers powerful insights in a simple interface.
Moreover, its cloud-based structure ensures accessibility and collaboration. Therefore, businesses that want better IT visibility, improved SLA compliance, and stronger operational control should adopt this dashboard system.
Frequently Asked Questions (FAQs)
1. What is the purpose of an IT Dashboard?
It tracks ticket performance, SLA compliance, and agent productivity in one system.
2. Can I customize KPIs?
Yes, you can modify KPIs according to your organization’s needs.
3. Does it support monthly analysis?
Yes, it includes a Monthly Trends page.
4. Can multiple users access it?
Yes, Google Sheets allows real-time collaboration.
5. Is it suitable for small IT teams?
Yes, both small and large IT teams can use it effectively.
Visit our YouTube channel to learn step-by-step video tutorials
Youtube.com/@NeotechNavigators
Watch the step-by-step video tutorial: