Managing a dealer network without clear performance metrics creates confusion and slow decision-making. Sales managers often struggle to track dealer productivity, market coverage, sales performance, and growth trends. As a result, they miss opportunities to improve dealer performance and expand market reach.
However, a Dealer Network KPI Dashboard in Google Sheets solves this problem effectively. It converts dealer performance data into a centralized, interactive reporting system. Therefore, sales leaders and regional managers can monitor key metrics, compare targets vs actuals, and evaluate dealer performance across different time periods.
This ready-to-use dashboard is built inside Google Sheets. It allows users to track MTD (Month-to-Date) and YTD (Year-to-Date) performance along with target comparisons and previous year benchmarks.
What Is a Dealer Network KPI Dashboard in Google Sheets?
A Dealer Network KPI Dashboard in Google Sheets is a performance monitoring tool that tracks sales, distribution, and dealer productivity metrics.
Instead of analyzing multiple spreadsheets manually, this dashboard allows users to:
- Track dealer sales performance
- Monitor monthly and yearly KPI trends
- Compare Actual vs Target values
- Evaluate Previous Year performance
- Identify underperforming dealers
Because the dashboard automatically updates metrics based on the selected month, users can analyze dealer performance quickly and accurately.
Key Features of Dealer Network KPI Dashboard in Google Sheets
Click to Buy Dealer Network KPI Dashboard in Google Sheets
This dashboard contains 6 structured worksheets that help organize and analyze dealer network data.
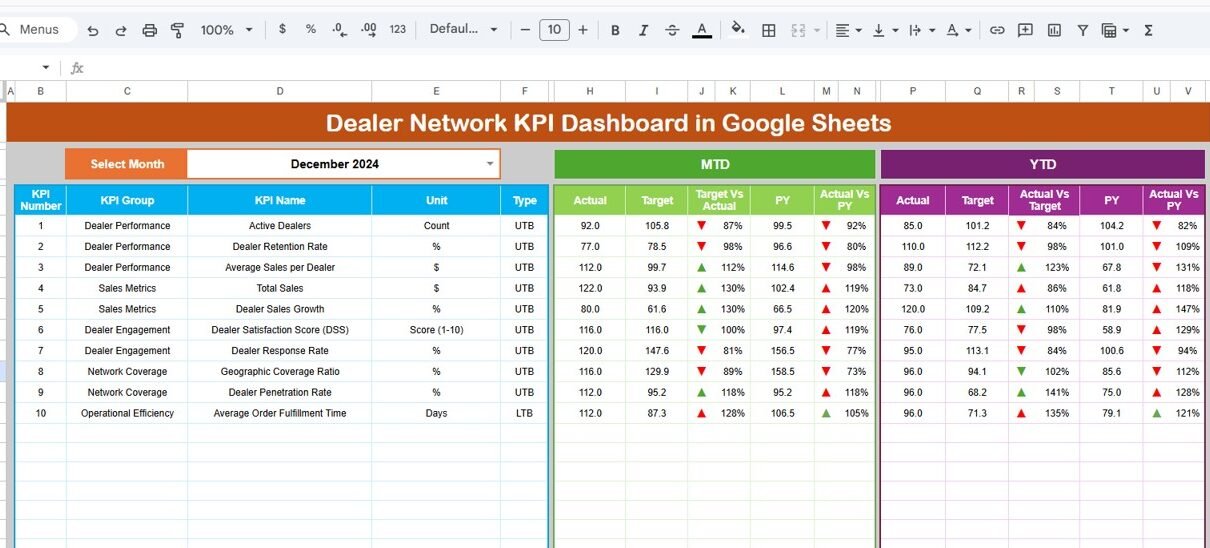
Dashboard Sheet – Main KPI Overview
The Dashboard sheet is the main reporting page of the KPI dashboard.
Here, users can view all key performance metrics in one place.
Month Selection
On cell D3, users can select the desired month from a dropdown list.
Once the month is selected, the entire dashboard automatically updates.
Metrics Displayed on the Dashboard
The dashboard shows the following metrics:
MTD Performance
- MTD Actual
- MTD Target
- MTD Previous Year
It also calculates:
- Target vs Actual
- Previous Year vs Actual
The dashboard highlights these comparisons using conditional formatting arrows to indicate performance trends.
YTD Performance
The dashboard also tracks:
- YTD Actual
- YTD Target
- YTD Previous Year
Additionally, it shows:
- Target vs Actual comparison
- Previous Year vs Actual comparison
This feature allows managers to analyze long-term performance trends.

Click to Buy Dealer Network KPI Dashboard in Google Sheets
KPI Trend Sheet – KPI Performance Analysis
The KPI Trend Sheet helps users analyze the performance of a specific KPI.
KPI Selection
Users can select a KPI name from the dropdown in cell C3.
Once selected, the sheet displays:
- KPI Group
- Unit of Measurement
- KPI Type
- Performance Type (Upper or Lower the better)
- KPI Formula
- KPI Definition
This sheet also visualizes KPI trends across months.
Therefore, managers can quickly identify improvement or decline patterns.

Click to Buy Dealer Network KPI Dashboard in Google Sheets
Actual Number Sheet – Enter Current Year Data
The Actual Number Sheet captures actual KPI values for the current year.
Users enter the actual data for:
-
MTD values
-
YTD values
Month Control
In cell E1, users specify the first month of the fiscal year.
Once this value is updated, the entire dataset aligns with the fiscal calendar.
This sheet serves as the main data source for the dashboard.

Click to Buy Dealer Network KPI Dashboard in Google Sheets
Target Sheet – Define KPI Targets
The Target Sheet contains performance targets for each KPI.
Users enter:
-
Monthly MTD Targets
-
Monthly YTD Targets
These targets represent the expected performance levels.
The dashboard then compares actual performance against these targets.

Previous Year Sheet – Historical Data Tracking
The Previous Year Number Sheet stores KPI data from the previous year.
Users enter historical data similar to the current year.
This allows the dashboard to calculate:
-
Year-over-Year growth
-
Previous Year vs Current Year comparisons
As a result, managers can evaluate performance improvements.

Click to Buy Dealer Network KPI Dashboard in Google Sheets
KPI Definition Sheet – KPI Documentation
The KPI Definition Sheet acts as the documentation center for all KPIs.
It contains the following columns:
- KPI Name
- KPI Group
- KPI Unit
- KPI Formula
- KPI Definition
This sheet ensures that every KPI remains clearly defined and standardized.
Therefore, all users interpret metrics consistently.

Click to Buy Dealer Network KPI Dashboard in Google Sheets
Advantages of Dealer Network KPI Dashboard in Google Sheets
Using this dashboard provides several benefits.
1. Centralized Dealer Performance Monitoring
All KPIs appear in one dashboard.
2. Automatic KPI Calculations
Formulas calculate performance metrics instantly.
3. Monthly and Yearly Comparisons
Managers can analyze both MTD and YTD trends.
4. Target vs Actual Performance Tracking
Users immediately identify performance gaps.
5. Easy Data Entry System
Separate sheets simplify data management.
6. No Expensive Software Required
Anyone can use the dashboard with Google Sheets.
Best Practices for Dealer Network KPI Management
Click to Buy Dealer Network KPI Dashboard in Google Sheets
To get maximum value from this dashboard, follow these best practices.
1. Define Clear KPIs
Every KPI should include a clear formula and definition.
2. Update Data Regularly
Enter actual numbers every month to maintain accurate reporting.
3. Monitor Dealer Performance Trends
Use the KPI Trend sheet to detect performance patterns.
4. Review Target vs Actual Variances
Investigate large performance gaps immediately.
5. Focus on Actionable Metrics
Track KPIs that directly impact sales growth and dealer efficiency.
Conclusion
Click to Buy Dealer Network KPI Dashboard in Google Sheets
Managing a dealer network requires structured performance monitoring. Without clear metrics, organizations struggle to evaluate dealer productivity and market coverage.
The Dealer Network KPI Dashboard in Google Sheets provides a powerful solution. It organizes KPI data, tracks monthly performance, compares targets with actual results, and analyzes year-over-year growth.
Because the dashboard integrates data entry, KPI definitions, and performance tracking into one system, businesses can manage dealer networks more efficiently.
If you want to improve dealer performance visibility and make better sales decisions, this dashboard offers an excellent solution.
Frequently Asked Questions (FAQs)
1. What is a Dealer Network KPI Dashboard?
It is a performance tracking system used to monitor dealer sales, productivity, and operational metrics.
2. What is the difference between MTD and YTD?
-
MTD (Month-to-Date) tracks performance within the current month.
-
YTD (Year-to-Date) tracks performance from the beginning of the year.
3. Can I customize the KPIs?
Yes. You can add or modify KPIs in the KPI Definition sheet.
4. Does the dashboard update automatically?
Yes. Once data is entered, formulas automatically update the dashboard.
5. Is Google Sheets suitable for KPI dashboards?
Yes. Google Sheets supports formulas, charts, and interactive dashboards.
Visit our YouTube channel to learn step-by-step video tutorials
Youtube.com/@NeotechNavigators
Watch the step-by-step video tutorial: