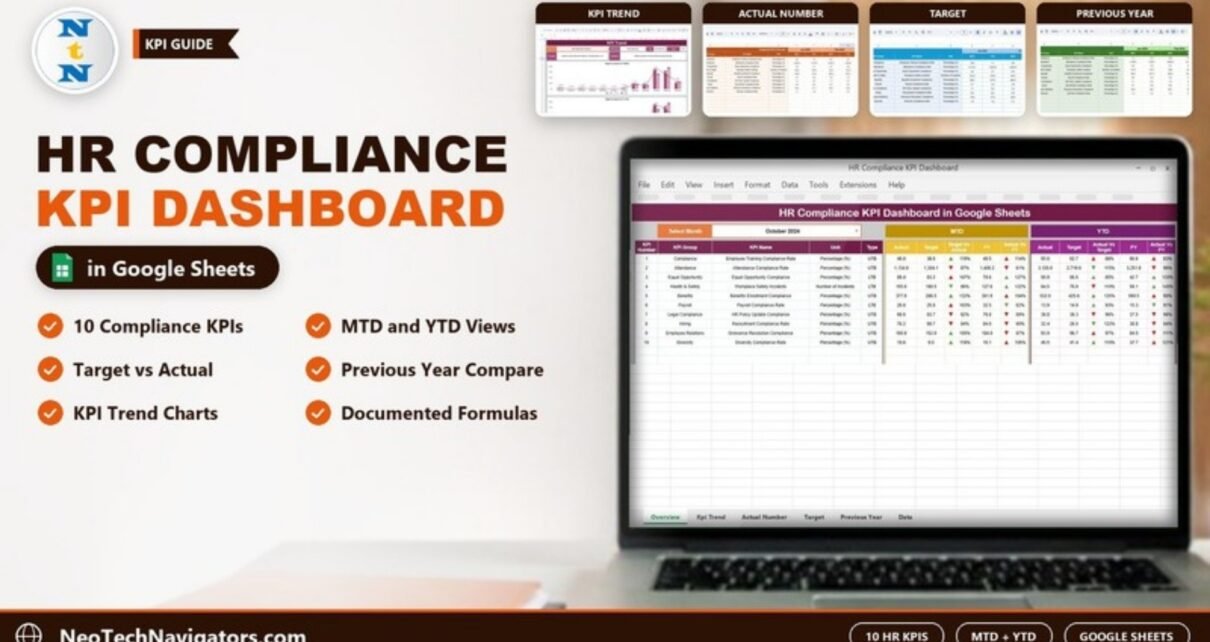
The HR Compliance KPI Dashboard in Google Sheets tracks ten HR compliance KPIs month by month, comparing each one against its target and against the previous year, for both Month-to-Date (MTD) and Year-to-Date (YTD) figures.
It is built for HR managers, HR business partners, compliance officers and small-business owners who need a simple, documented way to report on training, attendance, equal opportunity, safety, benefits, payroll, policy updates, hiring, grievances and diversity. The file has six sheets: Dashboard, KPI Trend, Actual Number, Target, Previous Year Number and KPI Definition.
Below you will find the full KPI list with the formulas used in the template, a worked example that reproduces the dashboard’s percentages, and step-by-step instructions for entering your own data.
🎥 Watch the Video Tutorial
Get the HR Compliance KPI Dashboard
What Problem Does an HR Compliance KPI Dashboard Solve?
HR compliance is spread across many areas: mandatory training, attendance policy, equal opportunity, workplace safety, benefits enrolment, payroll accuracy, policy updates, recruitment procedures, grievance handling and diversity. Each area produces its own numbers, often in separate files. When leadership asks “are we on track?”, HR has to gather everything by hand.
This dashboard keeps all ten measures in one table with a fixed definition, unit, formula and direction for each. You enter monthly actuals, targets and last year’s numbers, pick a month, and the dashboard shows whether each KPI is ahead of or behind target and last year, with up and down arrows.
The 10 HR Compliance KPIs in the Template
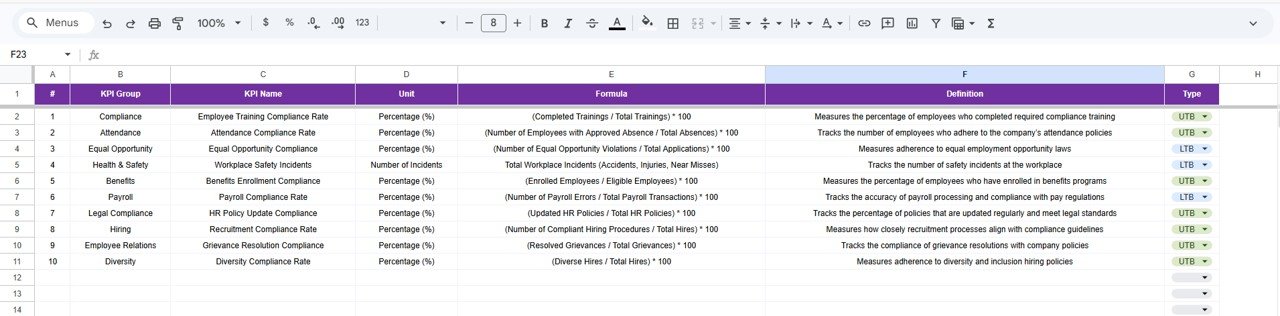
These are the KPIs exactly as they appear on the KPI Definition sheet. UTB means “Upper the Better” and LTB means “Lower the Better”.
| # | KPI Group | KPI Name | Unit | Formula (from the template) | Better when |
|---|---|---|---|---|---|
| 1 | Compliance | Employee Training Compliance Rate | Percentage (%) | (Completed Trainings / Total Trainings) * 100 | Higher (UTB) |
| 2 | Attendance | Attendance Compliance Rate | Percentage (%) | (Number of Employees with Approved Absence / Total Absences) * 100 | Higher (UTB) |
| 3 | Equal Opportunity | Equal Opportunity Compliance | Percentage (%) | (Number of Equal Opportunity Violations / Total Applications) * 100 | Lower (LTB) |
| 4 | Health & Safety | Workplace Safety Incidents | Number of Incidents | Total Workplace Incidents (Accidents, Injuries, Near Misses) | Lower (LTB) |
| 5 | Benefits | Benefits Enrollment Compliance | Percentage (%) | (Enrolled Employees / Eligible Employees) * 100 | Higher (UTB) |
| 6 | Payroll | Payroll Compliance Rate | Percentage (%) | (Number of Payroll Errors / Total Payroll Transactions) * 100 | Lower (LTB) |
| 7 | Legal Compliance | HR Policy Update Compliance | Percentage (%) | (Updated HR Policies / Total HR Policies) * 100 | Higher (UTB) |
| 8 | Hiring | Recruitment Compliance Rate | Percentage (%) | (Number of Compliant Hiring Procedures / Total Hires) * 100 | Higher (UTB) |
| 9 | Employee Relations | Grievance Resolution Compliance | Percentage (%) | (Resolved Grievances / Total Grievances) * 100 | Higher (UTB) |
| 10 | Diversity | Diversity Compliance Rate | Percentage (%) | (Diverse Hires / Total Hires) * 100 | Higher (UTB) |
Note that two KPIs are named “Compliance” or “Rate” but are calculated as violation or error rates (Equal Opportunity Compliance and Payroll Compliance Rate). That is why they are marked LTB: a lower number means fewer violations or errors. You can rename them on the KPI Definition sheet if your team finds that clearer.
Dashboard Sheet
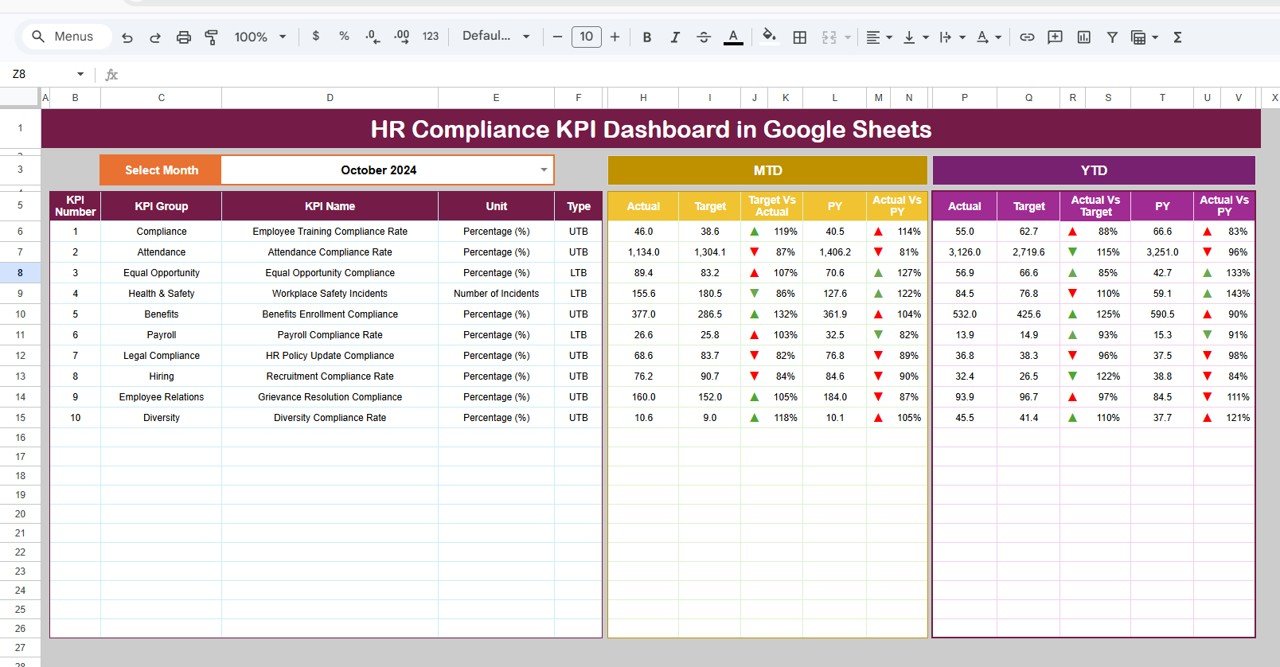
The Dashboard sheet is the main reporting page. Pick a month from the Select Month drop-down at the top (October 2024 in the screenshot) and the table updates for all ten KPIs.
For each KPI it shows KPI Number, KPI Group, KPI Name, Unit and Type, followed by two blocks:
- MTD: Actual, Target, Target Vs Actual, PY (previous year) and Actual Vs PY
- YTD: Actual, Target, Actual Vs Target, PY and Actual Vs PY
Conditional formatting adds up and down arrows next to each comparison so you can scan the table quickly.
Worked Example: How the Percentages Are Calculated
The comparison columns divide the actual value by the target or by last year’s value. Using the October 2024 MTD row for Employee Training Compliance Rate:
Target Vs Actual = Actual / Target = 46.0 / 38.6 = 1.19 → 119%
Actual Vs PY     = Actual / PY     = 46.0 / 40.5 = 1.14 → 114%
This KPI is UTB, so a result above 100% is good news: the team is ahead of both target and last year.
For an LTB KPI, read the same ratio the other way. Workplace Safety Incidents shows 155.6 actual against a target of 180.5:
Target Vs Actual = 155.6 / 180.5 = 0.86 → 86%Because fewer incidents is better, 86% means the site finished below its incident target, which is the outcome you want.
KPI Trend Sheet
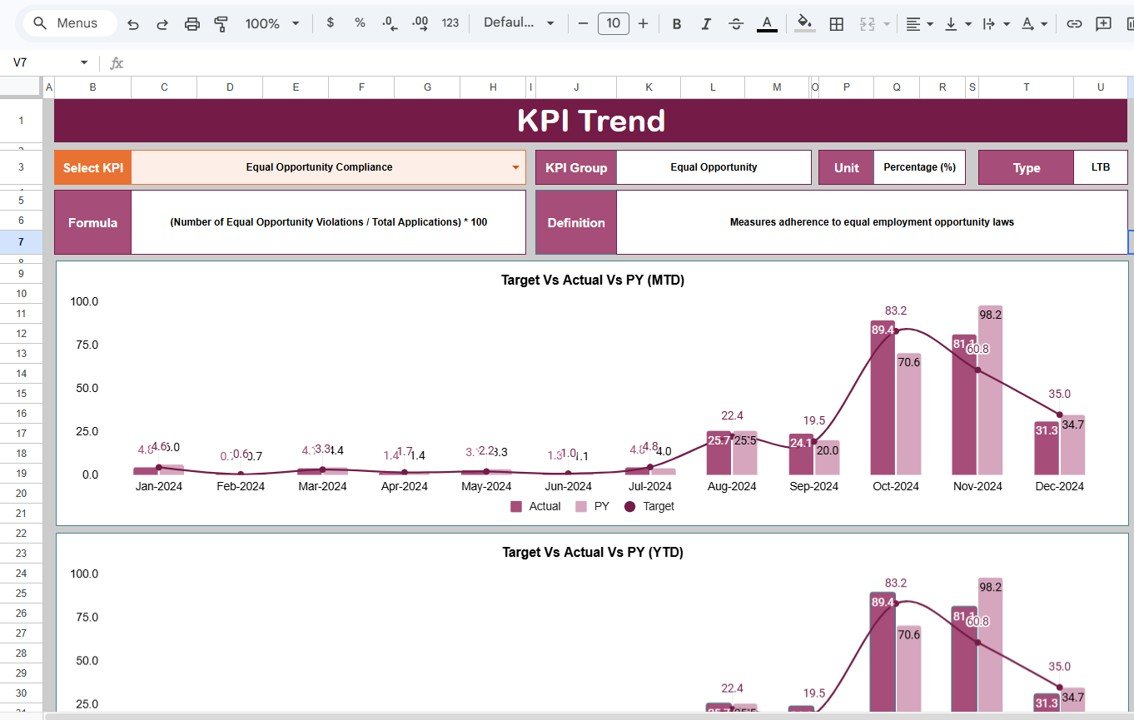
The KPI Trend sheet focuses on one KPI at a time. Choose a KPI from the Select KPI drop-down and the sheet fills in the KPI Group, Unit, Type, Formula and Definition, then draws two combo charts: Target Vs Actual Vs PY (MTD) and Target Vs Actual Vs PY (YTD) from January to December.
In the screenshot, Equal Opportunity Compliance is selected. Its October 2024 MTD bar shows 89.4 actual against a target of 83.2 and 70.6 last year, the same numbers that appear in row 3 of the Dashboard sheet (107% vs target, 127% vs PY).
Actual Number Sheet
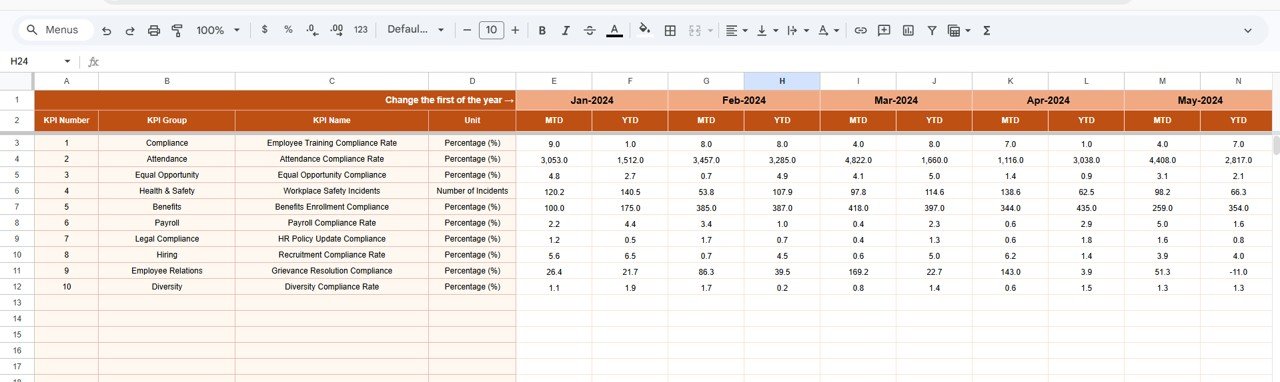
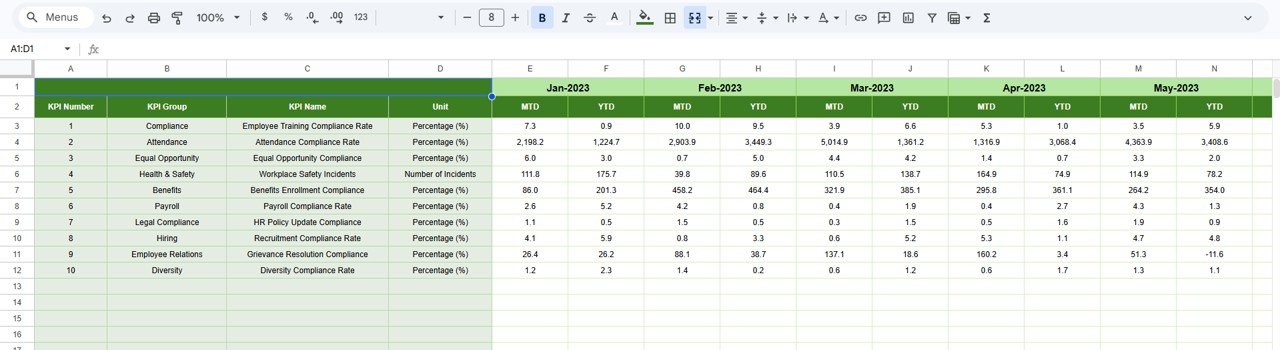
This is where you enter the monthly actuals. Each KPI has an MTD and a YTD column for every month. The first month cell in the header row is marked “Change the first of the year →”: type the first month of your year in that cell (cell E1; January 2024 in the sample). The month columns to the right then run on from that start month.
Target Sheet
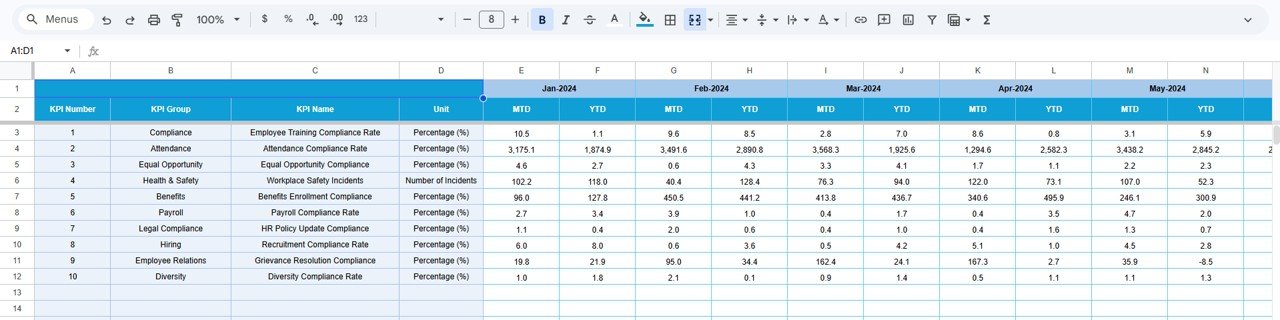
The Target sheet uses the same layout: KPI Number, KPI Group, KPI Name and Unit, then MTD and YTD target columns for each month. Set targets once at the start of the year and adjust only when policy changes.
Previous Year Number Sheet
Enter last year’s MTD and YTD values here in the same format (the sample starts at January 2023). These feed the PY and Actual Vs PY columns on the dashboard and the PY bars on the trend charts.
KPI Definition Sheet
The KPI Definition sheet is the reference guide for the whole file. For each KPI it stores the KPI Group, KPI Name, Unit, Formula, Definition and Type (UTB or LTB, chosen from a drop-down). The KPI Trend sheet reads the group, unit, formula, definition and type for the selected KPI from this sheet.
How to Set Up the HR Compliance KPI Dashboard in Google Sheets
- Make a copy of the Google Sheets file.
- Review the KPI Definition sheet. Keep the ten KPIs, or edit names, formulas and definitions to match your policies. Set each Type to UTB or LTB.
- On the Actual Number sheet, enter the first month of your year in the “Change the first of the year” cell.
- Enter targets for every KPI and month on the Target sheet.
- Enter last year’s values on the Previous Year Number sheet.
- Each month, add the new MTD and YTD actuals on the Actual Number sheet.
- Open the Dashboard sheet, select the month, and review the arrows. Use the KPI Trend sheet to explain any KPI that moved sharply.
The sample numbers in the file are dummy data, so some values (for example an Attendance Compliance Rate above 100%) are not realistic. Replace them all before reporting.
Real-World Use Cases
Monthly HR report to leadership
Select the month, take the Dashboard table as the summary, and add one KPI Trend chart for any area that missed target.
Audit preparation
The KPI Definition sheet documents how every measure is calculated, which helps when an auditor asks how a figure was produced.
Multi-site comparison
Keep one copy per site with the same KPI definitions so every location reports the same way.
Best Practices
- Agree on the data source for each KPI (training system, payroll, incident log) before the year starts.
- Enter data on a fixed date each month, for example the fifth working day.
- Do not change formulas mid-year; if you must, note the change on the KPI Definition sheet.
- Check that each KPI’s Type is correct. A wrong UTB/LTB setting makes the arrows misleading.
Limitations: Who Should Not Use It
- It is a KPI reporting tool, not an HRIS. It does not store employee records, training certificates or incident reports.
- All values are entered manually; there is no automatic link to payroll or HR software.
- It does not give legal advice or tell you which regulations apply in your country.
- Organisations that need employee-level drill-down should pair it with a detailed tracker.
For related templates, see the HR KPI Dashboard in Google Sheets, the Compliance KPI Dashboard in Google Sheets, the Compliance Training Calendar in Google Sheets and the Compliance Audit Tracker in Google Sheets. Teams that work in desktop Excel can use the HR Compliance KPI Dashboard in Excel. To learn how dashboards like this are built, the Pivot Tables & Dashboards course on NextGenTemplates Academy is a good next step.
Frequently Asked Questions
Which KPIs are included in the HR Compliance KPI Dashboard?
Ten: Employee Training Compliance Rate, Attendance Compliance Rate, Equal Opportunity Compliance, Workplace Safety Incidents, Benefits Enrollment Compliance, Payroll Compliance Rate, HR Policy Update Compliance, Recruitment Compliance Rate, Grievance Resolution Compliance and Diversity Compliance Rate.
What do UTB and LTB mean?
UTB is “Upper the Better” (higher values are good) and LTB is “Lower the Better” (lower values are good, such as incidents or errors).
What is the difference between MTD and YTD?
MTD is the value for the selected month only. YTD is the value from the start of your year up to the selected month.
Can I add or change KPIs?
Yes. Start on the KPI Definition sheet, then keep the KPI Number, Group, Name and Unit identical on the Actual Number, Target and Previous Year Number sheets so every sheet describes the same ten rows. Check the Dashboard after any change.
How is “Target Vs Actual” calculated?
It divides the actual value by the target. For example, 46.0 ÷ 38.6 = 119% for Employee Training Compliance Rate in October 2024.
Wrapping Up
The HR Compliance KPI Dashboard in Google Sheets gives HR one documented, repeatable way to report ten compliance KPIs against target and last year. Set up your definitions and targets once, add actuals each month, and use the Dashboard and KPI Trend sheets for your monthly review.
Get the HR Compliance KPI Dashboard
📅 Last updated: October 2026