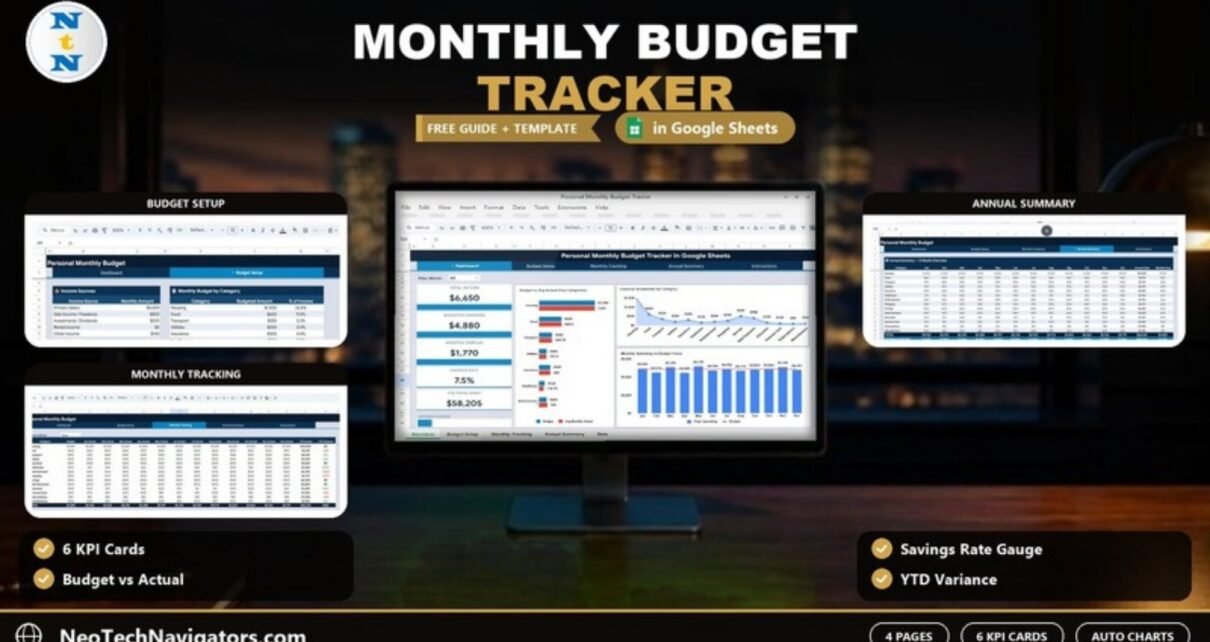
The Personal Monthly Budget Tracker in Google Sheets is a ready-made budget file that shows where your money goes each month and whether you are sticking to your plan. You set your income sources and category budgets once, enter what you actually spend each month, and the tracker works out your monthly surplus, savings rate, year-to-date spending and budget-versus-actual variance automatically.
It is built for individuals, couples and families managing household money, not business budgets. The file has four working pages (Dashboard, Budget Setup, Monthly Tracking and Annual Summary) plus an Instructions tab, all linked by a navigation bar. The dashboard has six KPI cards, three charts and a month filter. Below we explain each page, show how the key numbers are calculated using the sample data in the template, and share habits that make a monthly budget actually stick.
🎥 Watch the Video Tutorial
Get the Personal Monthly Budget Tracker
Why Use a Monthly Budget Tracker in Google Sheets?
Most budgets fail for one of two reasons: the plan is never written down, or nobody checks the plan against real spending. A monthly budget tracker fixes both. It keeps your plan (the budget) and your reality (actual spending) side by side, so overspending shows up in the same month instead of at the end of the year.
Google Sheets is a practical home for this. It works on your phone and laptop, and lets you share one file with a partner so both of you see the same numbers.
The Pages at a Glance
| Page | What you do there | Key outputs |
|---|---|---|
| Dashboard | Review and filter by month | 6 KPI cards, 3 charts, Filter Month drop-down |
| Budget Setup | Enter income sources and category budgets once | Total Income, % of Income per category, Total Expenses, Remaining Balance |
| Monthly Tracking | Enter actual spending each month | Jan–Dec actuals by category, monthly totals, YTD Actual and YTD Variance |
| Annual Summary | Review the year | Annual Total and Monthly Avg per category, monthly budget and variance, Annual Spending by Category chart |
| Instructions | Read before you start | How to use the tracker |
1. Dashboard
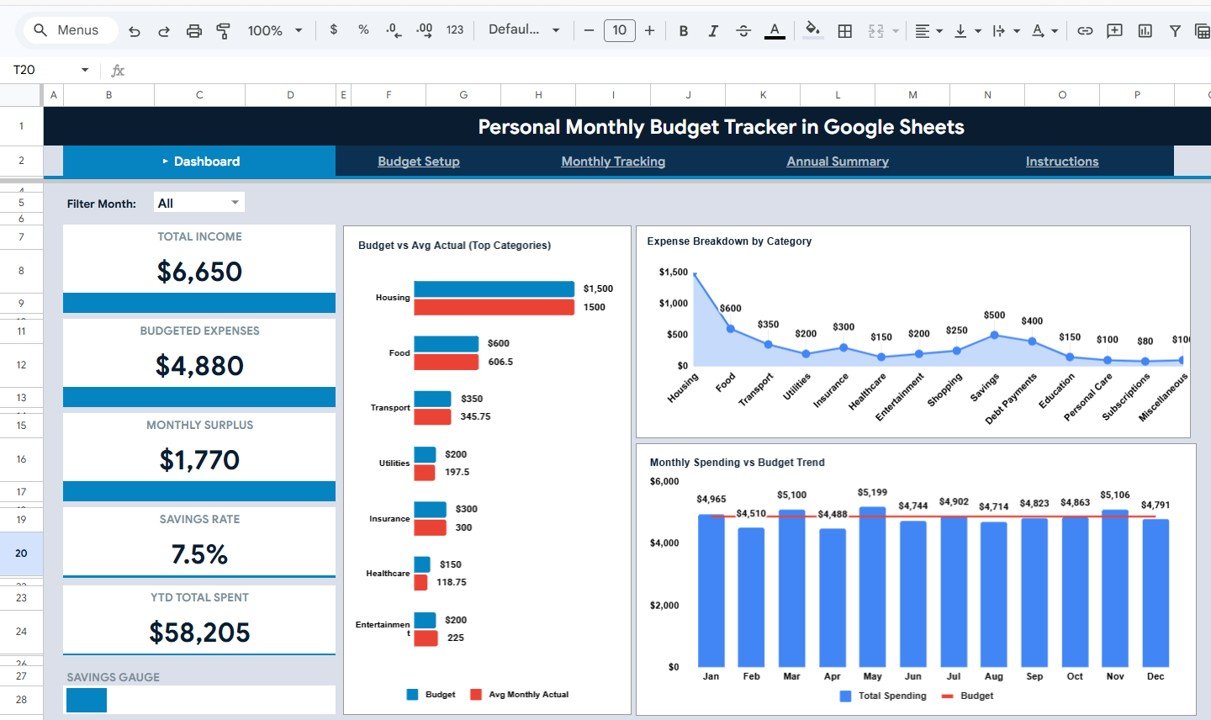
The Dashboard is the page you will look at most. A Filter Month drop-down at the top (set to All in the sample) changes the view, and six KPI cards down the left give you an instant financial check. The values below come from the template’s sample data:
- Total Income ($6,650): monthly income from all the sources you listed in Budget Setup
- Budgeted Expenses ($4,880): the total you planned to spend across all categories
- Monthly Surplus ($1,770): total income minus budgeted expenses
- Savings Rate (7.5%): the budget for the Savings category as a share of total income ($500 ÷ $6,650)
- YTD Total Spent ($58,205): actual spending across all categories for the year
- Savings Gauge: a bar that visualises the savings rate
Next to the cards are three charts: Budget vs Avg Actual (Top Categories), which compares each category’s budget with its average monthly actual; Expense Breakdown by Category, which plots the budgeted amount for all 14 categories; and Monthly Spending vs Budget Trend, which shows Total Spending for each month from Jan to Dec against the budget line.
2. Budget Setup
This is where you build your plan. It has two sections:
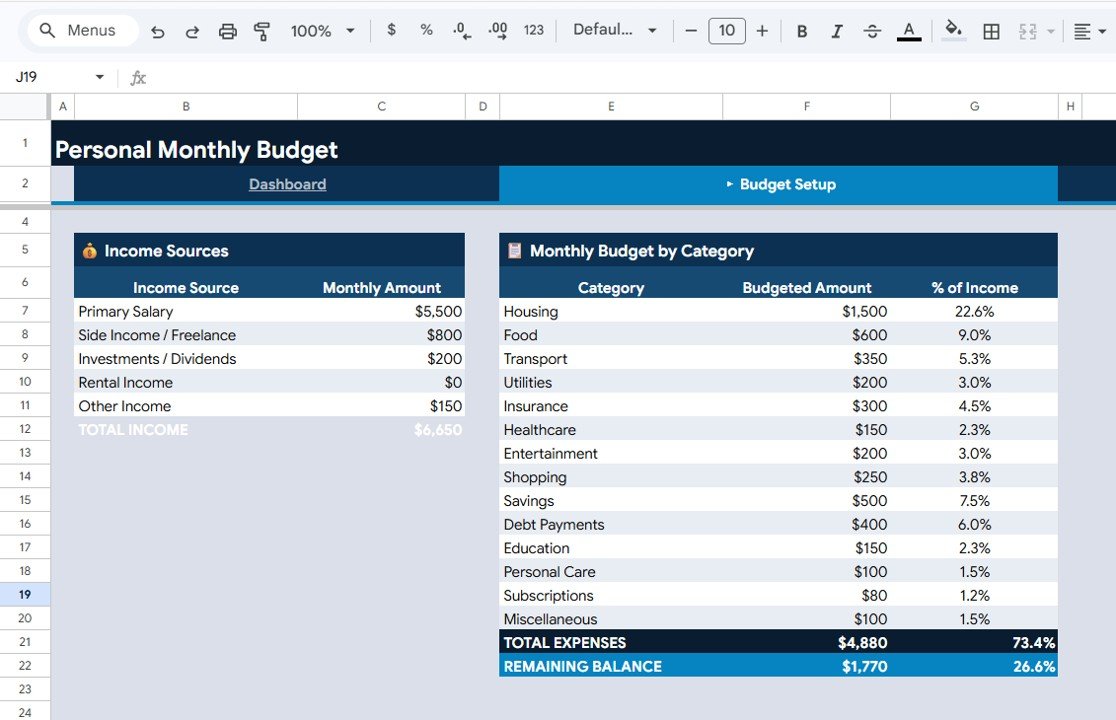
- Income Sources (Income Source | Monthly Amount): the sample lists Primary Salary ($5,500), Side Income / Freelance ($800), Investments / Dividends ($200), Rental Income ($0) and Other Income ($150), for a TOTAL INCOME of $6,650.
- Monthly Budget by Category (Category | Budgeted Amount | % of Income): 14 categories — Housing, Food, Transport, Utilities, Insurance, Healthcare, Entertainment, Shopping, Savings, Debt Payments, Education, Personal Care, Subscriptions and Miscellaneous. Each one shows its share of income automatically; for example Housing at $1,500 is 22.6% of income.
At the bottom, TOTAL EXPENSES ($4,880, 73.4% of income) and REMAINING BALANCE ($1,770, 26.6%) show at once whether the plan is balanced.
3. Monthly Tracking
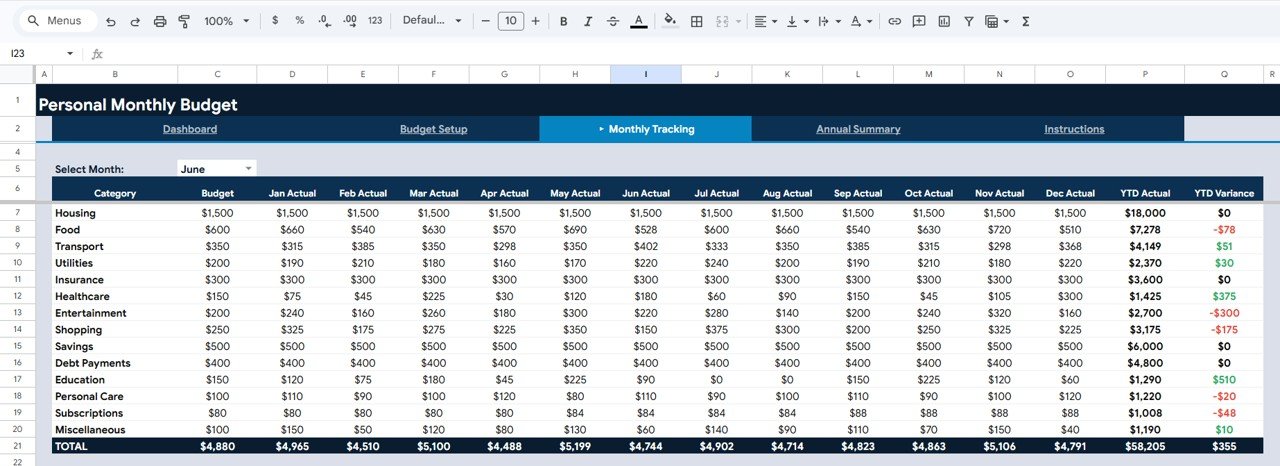
Once a month, you enter what you actually spent in each category. The page is one grid with a Select Month drop-down at the top and these columns: Category, Budget, Jan Actual through Dec Actual, YTD Actual and YTD Variance. A TOTAL row adds up every month (for example $4,965 in January against the $4,880 budget).
YTD Variance is the budget minus the actual for the year, so a positive green number means the category is under budget and a negative red number means it is over. In the sample, Food shows a YTD Actual of $7,278 and a variance of −$78, while Entertainment is −$300 and Education is +$510. That is the early-warning signal: a category that is a little over most months can look harmless until the YTD figure adds it up.
4. Annual Summary
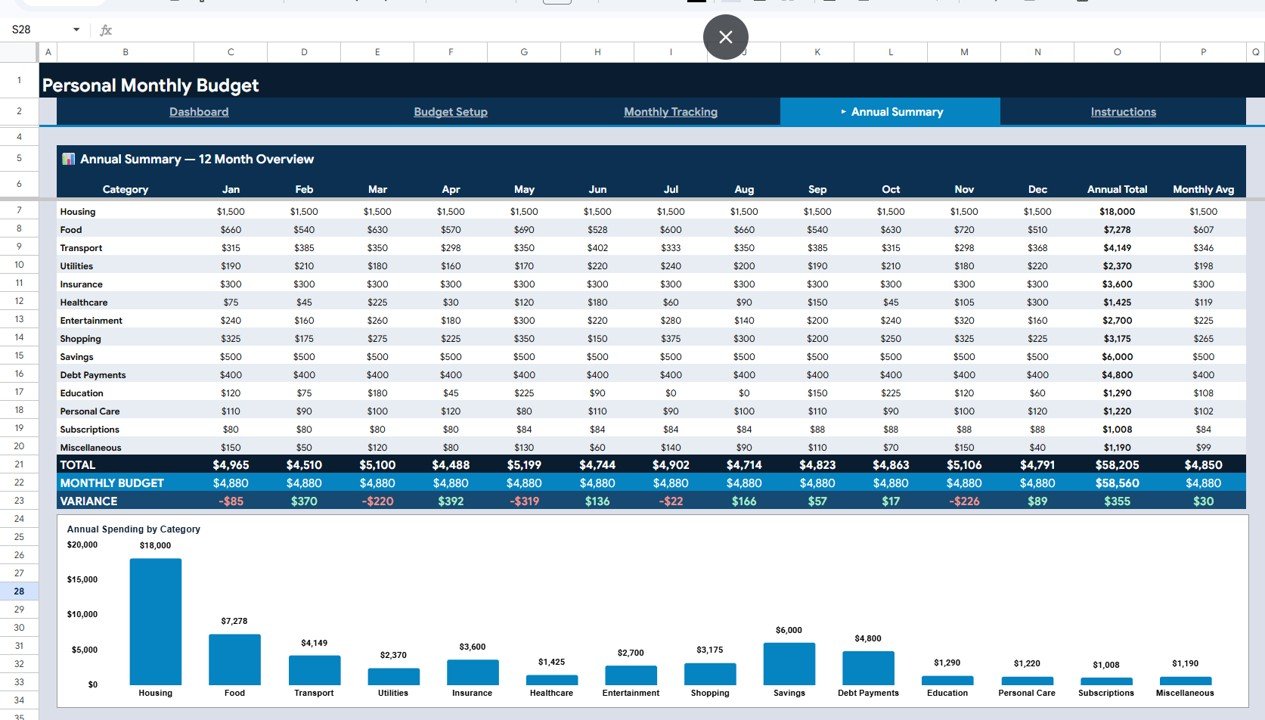
The Annual Summary — 12 Month Overview turns twelve months of entries into a year-end review. It lists every category by month with an Annual Total and Monthly Avg, followed by three summary rows: TOTAL, MONTHLY BUDGET and VARIANCE. In the sample, the year’s total spending is $58,205 against a budget of $58,560, a variance of $355. An Annual Spending by Category bar chart sits underneath, with Housing ($18,000) clearly the largest category. Use it in December or January to set next year’s budget from real numbers rather than guesses.
How the Key Numbers Are Calculated (Example)
The dashboard cards follow simple budgeting maths. Knowing them helps you trust and read the results.
Monthly Surplus      = Total Income - Budgeted Expenses
Savings Rate         = Savings category budget / Total Income
Category % of Income = Category Budget / Total Income
Variance             = Budget - Actual   (positive = under budget)
Here is how the template’s sample data works through those formulas:
| Item | Calculation | Value |
|---|---|---|
| Total Income | 5,500 + 800 + 200 + 0 + 150 | $6,650 |
| Budgeted Expenses | Sum of 14 category budgets | $4,880 |
| Monthly Surplus | 6,650 − 4,880 | $1,770 |
| Savings Rate | 500 ÷ 6,650 | 7.5% |
| Food, January | Budget 600 − Actual 660 | −$60 (over) |
| January total | Budget 4,880 − Actual 4,965 | −$85 (over) |
Note that the Monthly Surplus is what is left after all budgeted spending, while the Savings Rate only counts the money you deliberately budget into the Savings category. If you also save your surplus, your real savings rate is higher than the card shows.
How to Set Up the Tracker with Your Own Data
- Open the PDF guide that comes with your purchase, click the Google Sheets copy link and make your own editable copy in Google Drive.
- Go to Budget Setup and replace the sample income sources with your own monthly amounts.
- Rename the expense categories to match your life and set a monthly budget for each. Base the first budget on your last three months of real spending.
- Check the % of Income column and the Remaining Balance. If housing alone takes a very large share, decide now whether that is realistic.
- At the end of each month, open Monthly Tracking and enter actual spending per category in that month’s Actual column, using your bank and card statements.
- Review the Dashboard: surplus, savings rate and the Monthly Spending vs Budget Trend. Use Filter Month to focus on one month.
- In December, use the Annual Summary to set next year’s budget.
Real-World Use Cases
- A young professional on a single salary uses the Savings category and Savings Rate card to make sure a fixed share of income goes to savings each month.
- A couple sharing expenses keeps one shared file in Google Drive, so both partners see the same budget and spending without passing spreadsheets back and forth.
- A family planning a big purchase uses the YTD Variance column to find categories such as Entertainment or Shopping with steady overspending and redirects that money toward the goal.
Best Practices for Sticking to Your Budget
- Set up once, then spend ten minutes at the end of each month entering actuals.
- Do a quick check on the dashboard in high-spending months.
- Use realistic budgets first, then tighten them gradually.
- Treat savings as a category you “pay” first, not what is left over.
- Watch YTD Variance, not just one month, before changing a budget line.
- Keep last year’s file and compare the Monthly Avg column when planning the new year.
Limitations: Who This Tracker Is Not For
This is a manual monthly tracker. It does not connect to your bank or import transactions automatically, so you need to enter actual spending yourself. It does not include a debt payoff planner, multi-currency conversion or investment tracking. It is also designed for personal and household budgets, not business accounts. If you want a daily expense log or goal tracking, pair it with one of the related templates below.
Related Personal Finance Guides
To log every purchase day by day, see the Personal Expense Tracker in Google Sheets. For a wider view of income, net worth and goals, read about the Personal Finance Dashboard in Google Sheets. If you are saving toward something specific, the Savings Goal Planner in Google Sheets helps, and the Personal Cash Flow Tracker shows money in and out over time. Prefer to build your own? Follow our guide on how to make a budget tracker in Google Sheets.
Related template: the Monthly Budget Plan Template in Google Sheets focuses on planning and allocation before the month starts.
New to spreadsheets? The learning paths on NextGenTemplates Academy are a structured way to build the formula and chart skills behind trackers like this one.
Frequently Asked Questions
How do I track budget vs actual spending in Google Sheets?
Set your monthly budget for each category on the Budget Setup page, then enter actual spending in the month columns of the Monthly Tracking page. The tracker totals each month, compares it with the budget, and calculates YTD Actual and YTD Variance for every category automatically.
Can I change the income sources and expense categories?
Yes. You can rename the five income sources and the 14 categories on the Budget Setup page to match your own situation.
How is the Savings Rate calculated?
It is the amount budgeted for the Savings category divided by total income. In the sample, $500 ÷ $6,650 = 7.5%. Many people use the 50/30/20 rule as a starting point, which puts around 20% of income toward savings and debt repayment.
Does the tracker connect to my bank account?
No. You enter actual spending yourself, usually once a month from your statements. That keeps your banking details out of the spreadsheet.
Can two people use the budget tracker together?
Yes. Share the file through Google Drive and both people can view and edit it at the same time from any device.
Does it work on a phone?
Yes. The Google Sheets app opens the file on Android and iPhone. Entering data is easiest on a computer, but checking the dashboard on a phone works well.
Wrapping Up
A budget only works when you compare it with what really happened. The Personal Monthly Budget Tracker in Google Sheets keeps your plan, your actual spending and your year-to-date position in one place, with a dashboard that makes surplus and savings rate easy to follow. Set up your income and categories today, enter last month’s spending, and use the dashboard to decide one change for next month.
Get the Personal Monthly Budget Tracker
📅 Last updated: October 2026