Finance KPI Scorecard in HTML is a premium, browser-based interactive dashboard template designed to help finance managers, CFOs, controllers, and business analysts track 10 critical financial key performance indicators with traffic light indicators, sparkline trends, and multi-dimensional comparison modes. Built as a single self-contained HTML file, this dashboard runs in any modern web browser without requiring software installation, database connections, or server setup — making it one of the most accessible and powerful finance monitoring tools available for teams of any size.
Whether you are managing corporate finances, tracking departmental budgets, or monitoring startup cash flow metrics, this Finance KPI Scorecard in HTML consolidates your most important financial indicators into a visually compelling, interactive reporting experience. It supports Month-to-Date and Year-to-Date analysis, comparisons against targets and previous year benchmarks, and offers export functionality to CSV and vector PDF for stakeholder presentations. If you have been exploring browser-based dashboard solutions, you may also find our Personal Finance Dashboard in HTML useful for individual finance tracking.
Key Features of Finance KPI Scorecard in HTML
Click here to Purchase the Finance KPI Scorecard in HTML
The Finance KPI Scorecard in HTML is packed with features designed specifically for financial performance monitoring and reporting. Here is a detailed look at what makes this template stand out:
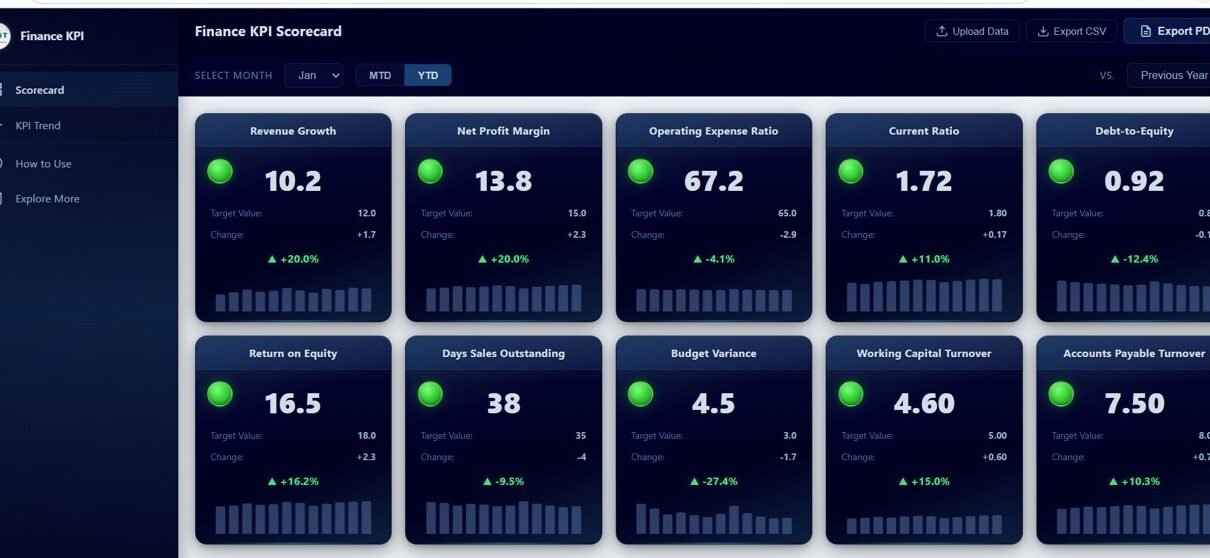
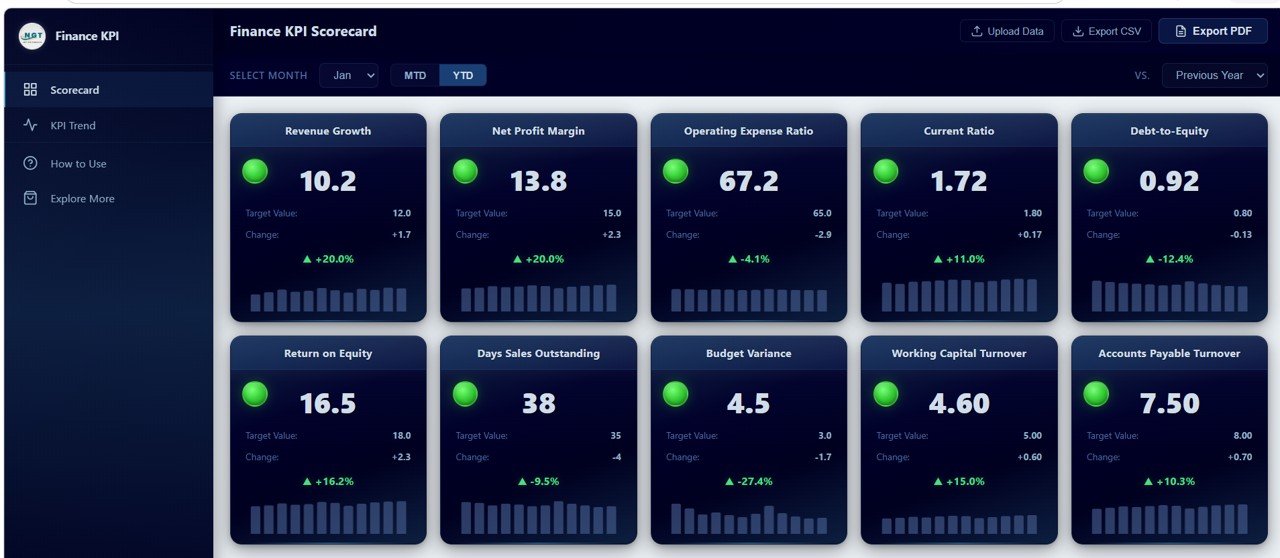
- 10 Finance KPIs with Traffic Light Indicators — The scorecard tracks Revenue Growth, Net Profit Margin, Operating Expense Ratio, Current Ratio, Debt-to-Equity Ratio, Return on Equity, Days Sales Outstanding, Budget Variance, Working Capital Turnover, and Accounts Payable Turnover. Each KPI card displays a green, yellow, or red traffic light based on performance relative to target thresholds.
- MTD and YTD Toggle — Instantly switch between Month-to-Date and Year-to-Date views to analyze both short-term performance and cumulative results from a single control.
- Vs Target and Vs Previous Year Comparison — A dropdown selector lets users toggle between comparing current values against budgeted targets or against the same period from the prior year.
- Sparkline Trend Charts — Every KPI card includes a mini sparkline chart showing monthly actual values across the entire year, enabling instant trend identification without leaving the overview page.
- 4 Detailed Trend Analysis Charts — The dedicated trend page provides MTD Actual vs Target, MTD Actual vs Previous Year, YTD Actual vs Target, and YTD Actual vs Previous Year visualizations for comprehensive KPI analysis.
- Upload Your Own Excel Data — Replace the included sample data with your own financial figures using the companion Excel template, and all charts, KPIs, and indicators update automatically.
- Export to CSV and Vector PDF — Download scorecard data as CSV for further spreadsheet analysis or export high-quality vector PDF reports for board meetings and executive presentations.
- Collapsible Sidebar Navigation — Navigate seamlessly between the Scorecard, KPI Trend, How to Use, and Explore More pages with a space-efficient collapsible sidebar.
- Fully Responsive Design — The dashboard adapts to any screen size from desktop monitors to tablets for a consistent experience across devices.
- WELCOME15 Coupon Code — New customers receive 15 percent off their first purchase from NextGenTemplates.com.
Dashboard Pages Explanation
The Finance KPI Scorecard in HTML includes four thoughtfully designed pages that together provide complete financial KPI visibility. Let us walk through each page in detail.
1. Scorecard Page
The Scorecard page is the primary overview screen of the dashboard. At the top, a filter bar offers three controls: a Month Selector to choose the reporting month, an MTD/YTD Toggle to switch between period types, and a Vs. Target/Previous Year dropdown to select the comparison mode. Below the filters, 10 KPI cards are arranged in a responsive grid layout. Each card displays the KPI name, a traffic light indicator (green for on or above target, yellow for within 10 percent of target, red for below 10 percent of target), the current value, the target value, the change amount, the percentage change, and a sparkline trend showing monthly actual values across the year. This layout gives finance teams an instant visual health check of all key metrics in a single glance.
Finance KPI Scorecard2. KPI Trend Page
The KPI Trend page enables deep-dive analysis on any individual KPI. At the top, a KPI selector dropdown allows users to choose which metric to analyze. An information bar below the selector displays contextual details including the KPI Group, Unit, Type, Formula, and Definition. The page then presents four detailed comparison charts. The MTD Actual vs Target chart reveals monthly performance gaps against budgeted goals, helping identify months where targets were missed or exceeded. The MTD Actual vs Previous Year chart shows month-over-month growth patterns compared to the prior year. The YTD Actual vs Target chart tracks cumulative progress toward annual financial targets. The YTD Actual vs Previous Year chart highlights year-over-year cumulative performance shifts, providing valuable context for strategic planning. For additional finance dashboard options, explore our Freelancer Business Dashboard in HTML which covers income, expenses, and profitability tracking.
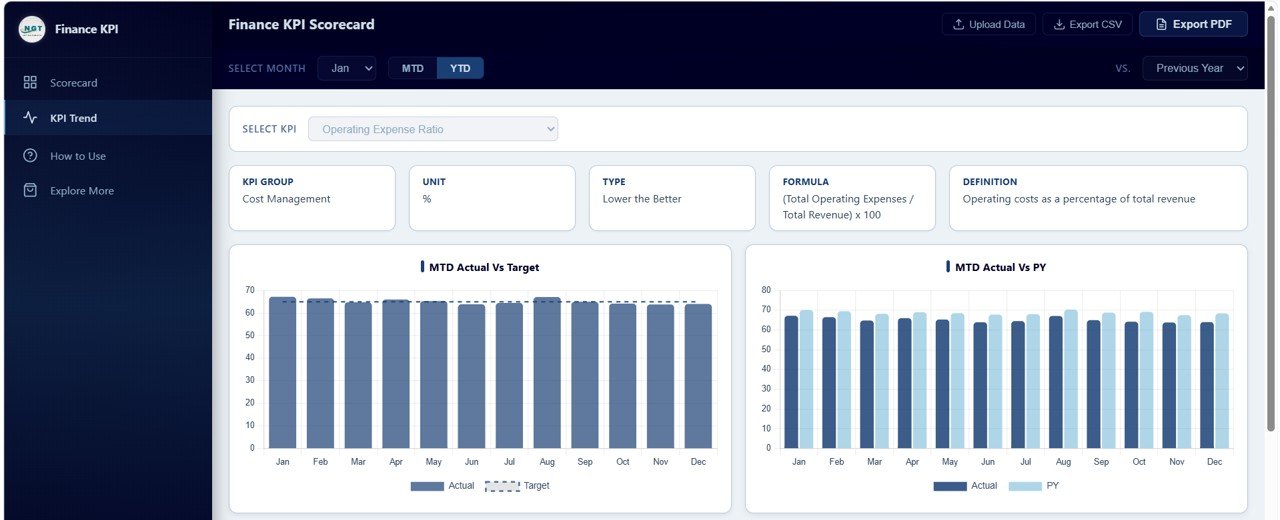 KPI Trend Analysis
3. How to Use Page
The How to Use page provides complete instructions for getting started with the dashboard. It covers the overall dashboard overview, scorecard page features and how to interpret traffic light indicators, KPI trend page features and chart navigation, how to upload your own data using the Excel template, and export options including CSV download and vector PDF generation. This built-in documentation ensures that any team member can start using the dashboard effectively without additional training or support. Finance teams can also review our Wedding Budget Dashboard in HTML for another example of how HTML dashboards handle budget tracking and expense analysis.
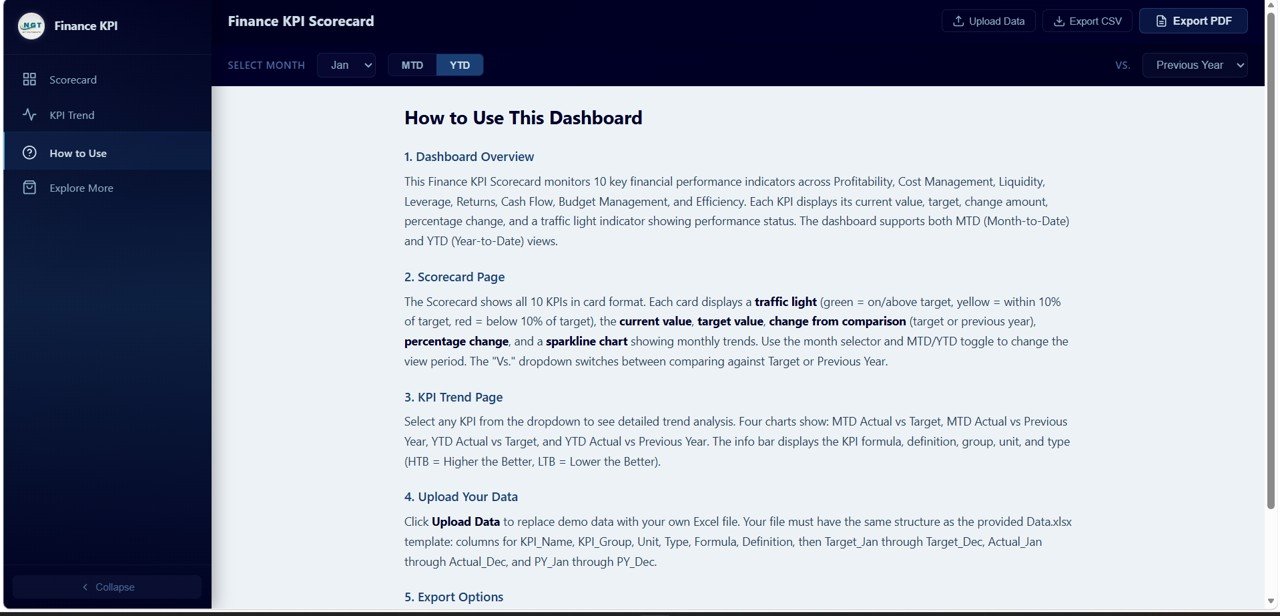 How to Use Guide
4. Explore More Page
The Explore More page is a promotional section showcasing related premium finance templates available from NextGenTemplates.com. It features a welcome coupon code WELCOME15 for 15 percent off the first purchase. The page includes product cards for the Google Sheets version, Excel version, and CFO Dashboard template, along with a features section highlighting why thousands of customers choose NextGenTemplates for their dashboard and template needs. A prominent call-to-action encourages users to browse all finance and accounting templates.
Advantages of Finance KPI Scorecard in HTML
The Finance KPI Scorecard in HTML offers several significant advantages over traditional spreadsheet-based finance reporting. First, it requires zero software installation — simply open the HTML file in any browser and your dashboard is ready. Second, the traffic light system provides immediate visual alerts, allowing finance leaders to identify underperforming KPIs at a glance without reading through rows of numbers. Third, the dual comparison modes (Vs Target and Vs Previous Year) combined with MTD/YTD toggling give four distinct analytical perspectives from a single dashboard, eliminating the need for multiple reports. Fourth, the built-in export functionality means you can generate board-ready PDF reports or CSV data extracts directly from the browser without additional tools. Finally, the responsive design ensures the dashboard works on conference room screens, laptop monitors, and tablets alike.
Opportunities for Improvement
Click here to Purchase the Finance KPI Scorecard in HTML
While the Finance KPI Scorecard in HTML is a comprehensive financial monitoring solution, there are areas where users might want to extend its capabilities. The dashboard currently tracks 10 pre-defined KPIs — organizations with specialized metrics like EBITDA margin, free cash flow yield, or inventory turnover may want to customize the KPI set. The comparison modes support target and previous year benchmarks, but adding a third comparison dimension such as industry benchmarks or peer company averages could provide additional strategic context. Additionally, while the Excel data upload is straightforward, organizations with ERP systems might benefit from a direct API integration or automated data pipeline to eliminate manual data entry altogether.
Best Practices for Using the Finance KPI Scorecard
To maximize the value of this dashboard, consider these recommended practices. Update your Excel data file at the start of each month so the dashboard always reflects the most current financial position. Use the MTD view for operational monitoring during the month and switch to YTD view for strategic reviews and board presentations. Pay particular attention to KPIs showing yellow traffic lights — these are early warning indicators that a metric is approaching the red zone and may require corrective action. Share the PDF export with stakeholders who do not need interactive access, and distribute the full HTML file to team members who need to explore the data themselves. Set specific, measurable targets for each KPI at the beginning of the fiscal year so the traffic light thresholds are meaningful and actionable throughout the year.
Explore Relevant Templates
If you found the Finance KPI Scorecard in HTML valuable, explore these related templates from NextGenTemplates.com:
- SaaS Financial Model Dashboard in HTML — Track SaaS-specific financial metrics including MRR, ARR, churn rate, CAC, LTV, and runway projections with interactive HTML charts.
- Church Finance Dashboard in HTML — Monitor church income, expenses, fund allocations, donation tracking, and budget adherence with a clean visual dashboard.
- Startup Burn Rate Dashboard in HTML — Analyze startup cash burn, monthly runway, funding utilization, and expenditure patterns with detailed trend charts.
- Small Business CFO Dashboard in Google Sheets — A Google Sheets-based alternative for small business owners who prefer cloud-based finance tracking with collaborative features.
- SaaS Financial Model Dashboard in Google Sheets — Track SaaS financial health directly in Google Sheets with automated formulas and chart visualizations.
Frequently Asked Questions
Click here to Purchase the Finance KPI Scorecard in HTML
What is a Finance KPI Scorecard in HTML and who is it for?
A Finance KPI Scorecard in HTML is a browser-based interactive dashboard that tracks critical financial performance indicators with traffic light color coding, sparkline trends, and comparison charts. It is designed for CFOs, finance managers, controllers, business analysts, and accounting teams who need a lightweight, installation-free tool to monitor financial health and present performance data to stakeholders.
What KPIs does this HTML finance scorecard template track?
The Finance KPI Scorecard in HTML tracks 10 essential financial KPIs: Revenue Growth, Net Profit Margin, Operating Expense Ratio, Current Ratio, Debt-to-Equity Ratio, Return on Equity, Days Sales Outstanding, Budget Variance, Working Capital Turnover, and Accounts Payable Turnover. Each KPI includes traffic light indicators, current vs target values, percentage change, and sparkline trends.
How do I add my own data to the Finance KPI Scorecard?
The dashboard comes with a companion Excel data template. Open the Excel file, replace the sample data with your own monthly KPI actuals, targets, and previous year figures, then save the file. When you open or refresh index.html in your browser, all charts, traffic lights, and KPI values update automatically to reflect your data.
Can I export finance KPI reports from this HTML dashboard?
Yes. The Finance KPI Scorecard in HTML supports two export formats: CSV for raw data extraction that can be imported into Excel or other analysis tools, and vector PDF for high-resolution print-ready reports suitable for board meetings, executive reviews, and stakeholder presentations.
What is the difference between MTD and YTD views in the scorecard?
MTD (Month-to-Date) shows performance for the selected month only, useful for operational monitoring and identifying short-term trends. YTD (Year-to-Date) shows cumulative performance from the start of the fiscal year through the selected month, ideal for strategic reviews, annual goal tracking, and board-level reporting.
Do I need any special software to use this HTML finance dashboard?
No. The Finance KPI Scorecard in HTML runs entirely in a web browser. Simply unzip the downloaded file and open index.html in Chrome, Edge, Firefox, or Safari. No server, database, internet connection, or additional software is required to use the dashboard.
Conclusion
The Finance KPI Scorecard in HTML is a powerful, accessible, and visually compelling solution for finance teams that need to monitor critical financial performance indicators without the complexity of enterprise BI tools. With 10 essential KPIs, traffic light indicators, sparkline trends, four detailed trend analysis charts, and flexible MTD/YTD comparison modes, this dashboard gives you everything you need to stay on top of your organization’s financial health.
Click here to Purchase the Finance KPI Scorecard in HTML
For more finance and accounting dashboard templates, visit NextGenTemplates.com and explore our growing library of 2,000+ premium templates across Excel, Google Sheets, Power BI, and HTML formats.
Subscribe to our YouTube channel for step-by-step video tutorials and dashboard walkthroughs: Youtube.com/@NeoTechNavigators