The Grant Management KPI Dashboard in Google Sheets gives grant managers one place to see how their programs are performing each month. You pick a month, and every KPI shows its Month-to-Date (MTD) and Year-to-Date (YTD) Actual, Target and Previous Year figures, with up and down arrows that tell you at a glance where you are ahead or behind.
It is built for nonprofit grant officers, program managers, foundation staff and consultants who report to funders and boards but do not want a heavy grant management platform just to track numbers. The file has six tabs: Dashboard, KPI Trend, Actual Numbers Input, Target Number Input, Previous Year Number and KPI Definition. It ships with 10 sample KPIs such as Grant Approval Rate, Grant Utilization Rate and Grant Compliance, and you can replace them with your own.
Below you will find a walkthrough of each sheet, the full KPI list with formulas, a step-by-step setup guide, use cases and honest limitations.
Get the Grant Management KPI Dashboard
What Problem Does This Grant KPI Dashboard Solve?
Most grant teams keep their numbers in scattered spreadsheets: one for budgets, one for compliance checks, one for survey results. When a funder or board asks how this month compares with the target, or with the same month last year, someone has to rebuild the comparison by hand. That is slow and easy to get wrong.
This template puts a fixed structure around that work. You type the monthly actuals, targets and previous-year figures into three input sheets, and the Dashboard and KPI Trend sheets do the comparisons for you. Because it runs in Google Sheets, your whole team can open the same file in a browser, and you can share a view-only link with a funder or board member.
Sheets Inside the Grant Management KPI Dashboard
1. Dashboard Sheet
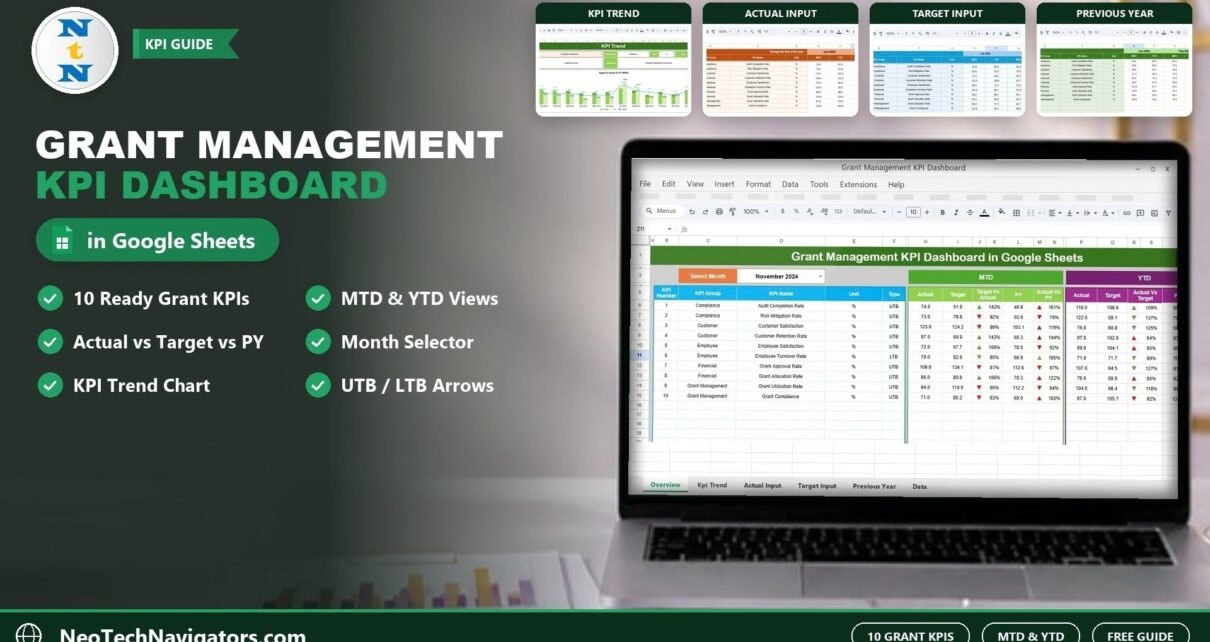
This is the main tab. Choose a month from the Select Month drop-down in cell D3 (the screenshot shows November 2024) and the whole sheet recalculates for that month.
For each KPI you see the KPI Number, KPI Group, KPI Name, Unit and Type (UTB or LTB). The MTD block shows Actual, Target, Target Vs Actual, PY and Actual Vs PY. The YTD block shows Actual, Target, Actual Vs Target, PY and PY Vs Actual. Each comparison carries an up or down arrow, and the Type column tells you whether a higher (UTB) or lower (LTB) value is the good direction for that KPI.
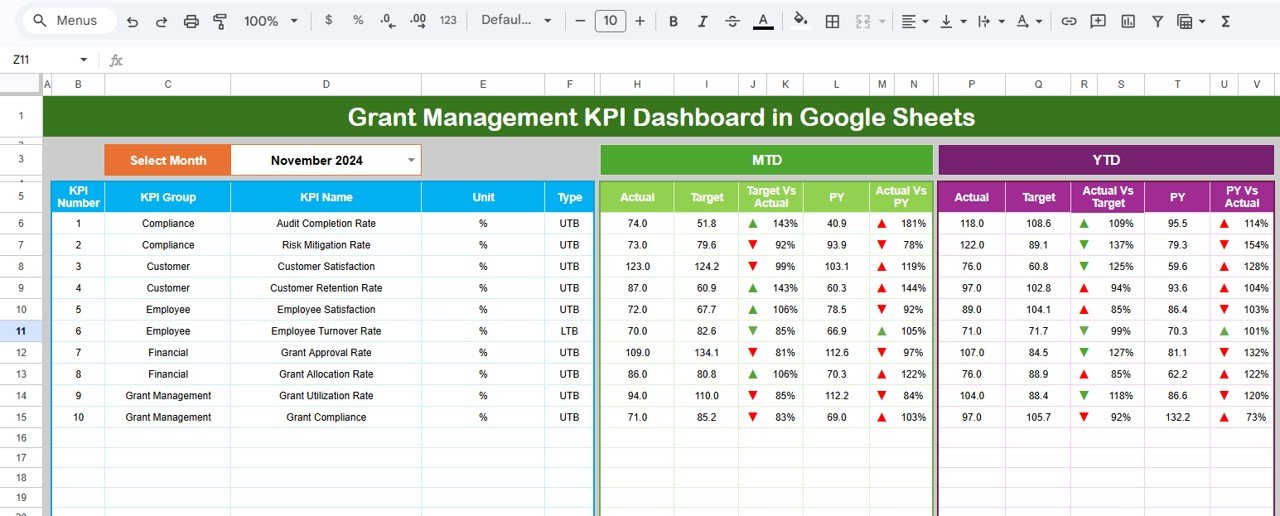
As an example from the screenshot: Audit Completion Rate has an MTD Actual of 74.0 against a Target of 51.8, so Target Vs Actual shows 143% (74.0 / 51.8). Against the previous year’s 40.9, Actual Vs PY shows 181% (74.0 / 40.9).
2. KPI Trend Sheet
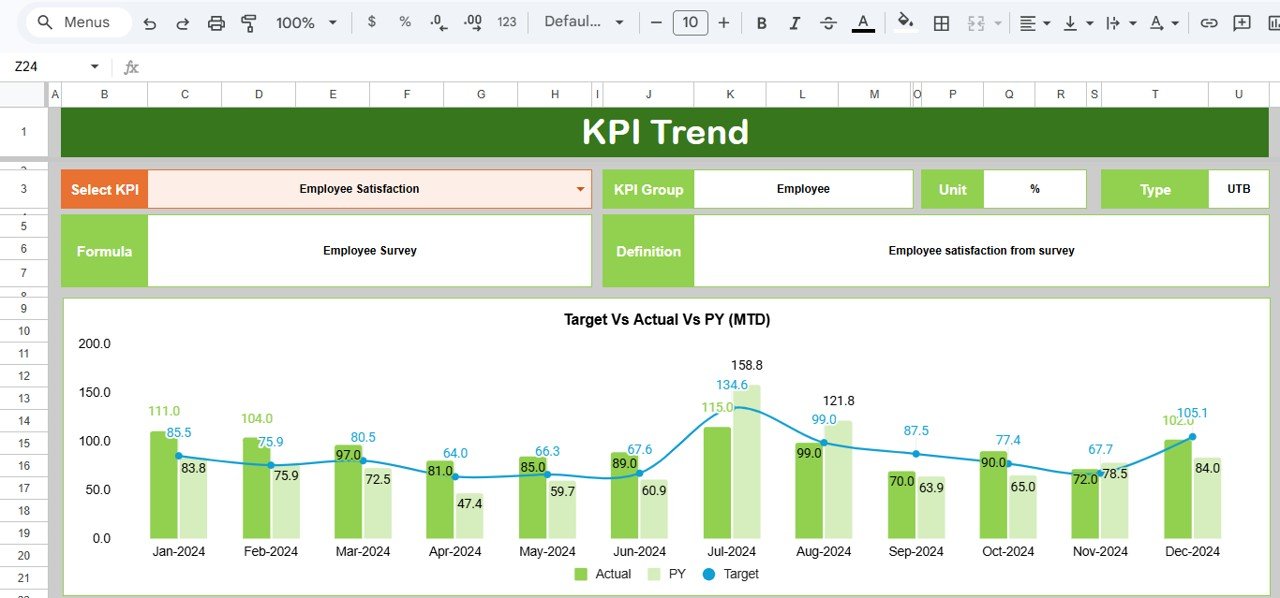
Pick a KPI from the Select KPI drop-down in cell C3. The sheet then shows its KPI Group, Unit, Type, Formula and Definition, plus a Target Vs Actual Vs PY (MTD) chart across all 12 months. Actual and PY appear as columns and Target as a line. The screenshot shows Employee Satisfaction (group Employee, unit %, type UTB, formula “Employee Survey”, definition “Employee satisfaction from survey”).
3. Actual Numbers Input Sheet
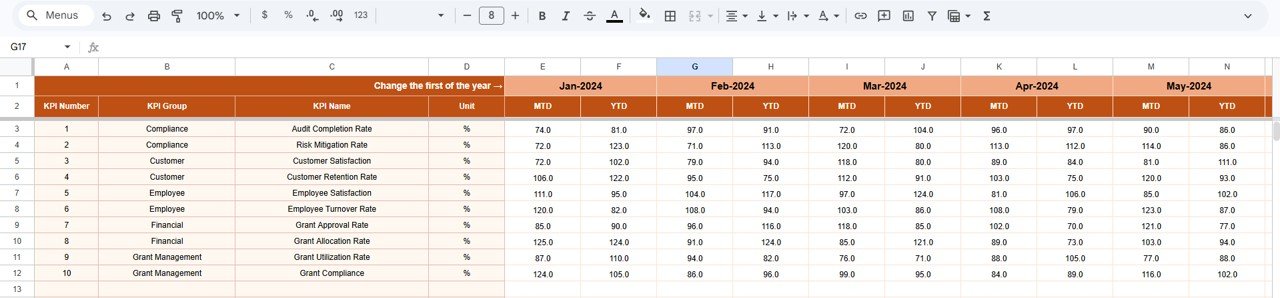
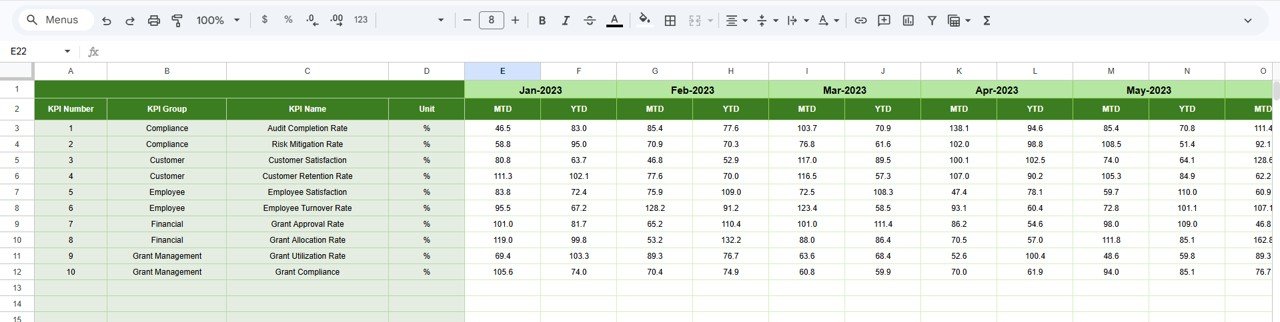
This is where you type the real results. Each month has an MTD and a YTD column for every KPI. Cell E1 holds the first month of the year (Jan-2024 in the sample); change it and the 12 month headers shift to match your fiscal year.
4. Target Number Input Sheet
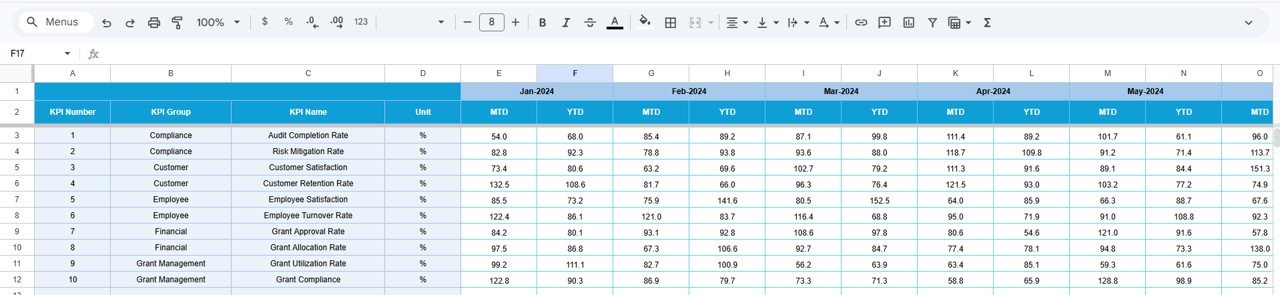
Same layout as the actuals sheet, but here you enter the MTD and YTD targets for each KPI and month. Agree these with your funder or program lead before the year starts so the comparisons mean something.
5. Previous Year Number Sheet
Enter last year’s figures in the same MTD/YTD format (the sample starts at Jan-2023). This feeds the PY columns on the Dashboard and the PY series on the trend chart, which gives you year-over-year context for annual reports.
6. KPI Definition Sheet
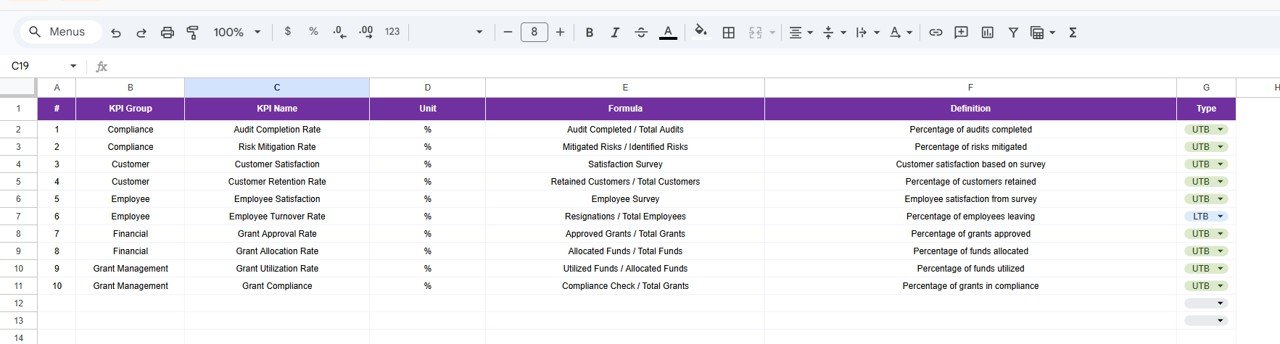
The KPI register. Each row holds the KPI Group, KPI Name, Unit, Formula, Definition and Type, where Type is chosen from a drop-down as UTB (Upper the Better) or LTB (Lower the Better). The Dashboard and KPI Trend sheets read from this list.
The 10 KPIs in the Grant Management KPI Dashboard
These are the sample KPIs exactly as they appear in the KPI Definition sheet. All are measured in %.
| KPI (Group) | What it measures | Formula | Better when |
|---|---|---|---|
| Audit Completion Rate (Compliance) | Percentage of audits completed | Audit Completed / Total Audits | Higher (UTB) |
| Risk Mitigation Rate (Compliance) | Percentage of risks mitigated | Mitigated Risks / Identified Risks | Higher (UTB) |
| Customer Satisfaction (Customer) | Customer satisfaction based on survey | Satisfaction Survey | Higher (UTB) |
| Customer Retention Rate (Customer) | Percentage of customers retained | Retained Customers / Total Customers | Higher (UTB) |
| Employee Satisfaction (Employee) | Employee satisfaction from survey | Employee Survey | Higher (UTB) |
| Employee Turnover Rate (Employee) | Percentage of employees leaving | Resignations / Total Employees | Lower (LTB) |
| Grant Approval Rate (Financial) | Percentage of grants approved | Approved Grants / Total Grants | Higher (UTB) |
| Grant Allocation Rate (Financial) | Percentage of funds allocated | Allocated Funds / Total Funds | Higher (UTB) |
| Grant Utilization Rate (Grant Management) | Percentage of funds utilized | Utilized Funds / Allocated Funds | Higher (UTB) |
| Grant Compliance (Grant Management) | Percentage of grants in compliance | Compliance Check / Total Grants | Higher (UTB) |
The comparison columns are simple ratios. Using the November 2024 MTD figures for Grant Utilization Rate from the screenshot:
Target Vs Actual = Actual / Target = 94.0 / 110.0 = 85%
Actual Vs PY     = Actual / PY     = 94.0 / 112.2 = 84%
Both are below 100%, and the dashboard marks them with red down arrows. Because Grant Utilization Rate is a UTB KPI, this means it is behind both its target and last year. For an LTB KPI such as Employee Turnover Rate, read the percentage the other way round: a result below 100% means the rate is lower than the benchmark, which is the good direction.
How to Use It With Your Own Grant Data
- Make your copy. Open the file in Google Sheets and use File > Make a copy to save it to your Drive.
- Edit the KPI Definition sheet. Rename or replace the sample KPIs, then set the Group, Unit, Formula, Definition and UTB/LTB type for each one.
- Set the first month. On the Actual Numbers Input sheet, change cell E1 to the first month of your fiscal or grant year.
- Enter targets. Fill the MTD and YTD targets for each month on the Target Number Input sheet.
- Enter previous-year figures. Add last year’s MTD and YTD values on the Previous Year Number sheet. If a KPI is new, leave PY blank and ignore that comparison.
- Update actuals monthly. After each month closes, type the MTD and YTD actuals on the Actual Numbers Input sheet.
- Review. Select the month in D3 on the Dashboard, then open the KPI Trend sheet for any KPI that is falling behind.
Real-World Use Cases
- Monthly program review at a small nonprofit. The grants lead selects last month on the Dashboard and walks the team through the KPIs that are behind, starting with Grant Utilization Rate and Grant Compliance.
- Funder progress reports. A program officer copies the YTD Actual vs Target figures into a quarterly report and attaches the KPI Trend chart for the KPIs the funder cares about most.
- Consultants serving several organizations. A freelance grant consultant keeps one copy per client, each with its own KPI Definition list, and shares view-only links before monthly calls.
Spreadsheet Dashboard vs Grant Management Software
| Need | This Google Sheets dashboard | Dedicated grant management platform |
|---|---|---|
| Monthly KPI tracking vs target and last year | Yes, MTD and YTD | Usually, via reports |
| Custom KPIs | Yes, edit the KPI Definition sheet | Depends on the vendor |
| Team access and sharing | Google Sheets sharing and comments | User accounts and roles |
| Applicant portal and workflows | No | Yes |
| Automatic data feeds from accounting | No, manual entry | Often available |
| Setup effort | Low: edit KPIs and type numbers | Higher: onboarding and configuration |
Best Practices
- Define KPIs first. Finish the KPI Definition sheet before typing any numbers so the drop-downs and labels are correct from day one.
- Keep MTD and YTD consistent. If your YTD is a running total, make sure the target and previous-year YTD follow the same logic.
- Check the Type column. The UTB/LTB setting is shown on the Dashboard and KPI Trend sheets, so a wrong setting misleads anyone reading that KPI. Review it whenever you add one.
- Update on a fixed day. Entering actuals on the same working day each month keeps trends comparable.
- Share view-only. Give funders and board members a view-only link so input sheets cannot be changed by mistake.
Who Should Not Use This Template (Limitations)
- It does not collect grant applications, route approvals or pay out funds. You still need a form, a process or a platform for that.
- All numbers are typed in by hand; there is no connection to accounting or CRM software.
- It tracks KPIs, not individual grants. If you need a per-grant register with award amounts and deadlines, look at a grant tracker or the dashboard below.
- Organizations that need formal audit trails or enterprise access controls should use a dedicated system.
Related Templates and Guides
If you prefer to see grants by funder, amount and status instead of KPIs, read our Nonprofit Grant Dashboard in Google Sheets guide. To keep proposal deadlines in view, the Grant Proposal Submission Calendar in Google Sheets is a good companion. Fundraising teams using the same MTD/YTD layout can look at the Fundraising Campaign KPI Dashboard in Google Sheets and the Charity Fundraising KPI Scorecard in Google Sheets.
Related templates: the same dashboard is also available as the Grant Management KPI Dashboard in Excel.
If you want to build dashboards like this yourself, the Excel Pivot Tables and Dashboards course on NextGenTemplates Academy covers the reporting skills step by step.
Frequently Asked Questions
What KPIs come with the Grant Management KPI Dashboard?
It ships with 10 sample KPIs: Audit Completion Rate, Risk Mitigation Rate, Customer Satisfaction, Customer Retention Rate, Employee Satisfaction, Employee Turnover Rate, Grant Approval Rate, Grant Allocation Rate, Grant Utilization Rate and Grant Compliance. You can replace any of them in the KPI Definition sheet.
How do I change the month shown on the dashboard?
Use the Select Month drop-down in cell D3 of the Dashboard sheet. All MTD and YTD figures and arrows update for the chosen month.
Can I align the dashboard with a fiscal year that starts in April or July?
Yes. Change the first month in cell E1 of the Actual Numbers Input sheet and the 12 month columns adjust to your year.
What do UTB and LTB mean?
UTB means Upper the Better, so a higher value is good. LTB means Lower the Better, as with Employee Turnover Rate. The type tells you which direction is good when you read a KPI’s comparison percentages.
Does it need add-ons?
No. It runs in a normal Google Sheets file, so it works in any browser and can be viewed in the Google Sheets mobile app.
Can several people work in it at once?
Yes. Like any Google Sheets file, you can share it with your team for editing and give others view-only access.
Wrapping Up
The Grant Management KPI Dashboard in Google Sheets turns three simple input sheets into a monthly view of grant, compliance, financial and team KPIs, with MTD and YTD comparisons against target and last year. Start by editing the KPI Definition sheet to match what your funders ask for, enter your targets, and review the dashboard each month.
Get the Grant Management KPI Dashboard
📅 Last updated: October 2026