The Bakery Executive Dashboard in Google Sheets turns raw order data into four headline KPIs (Total Revenue, Total Profit, Total Orders, and Average Order Value) across four interactive report pages, 16 pre-built charts, and a one-click order Search tab. Setup takes under 10 minutes: replace the sample data on a single Data sheet and every chart, KPI card, and lookup updates automatically.
For most bakeries, the numbers that decide profit (which products sell, which channels pay, where cost leaks) sit scattered across till exports and notebooks. This dashboard pulls all of it into one shareable file so an owner or manager can read the business at a glance, without paying a monthly point-of-sale analytics fee.
🎥 Watch the Video Tutorial
Get the Bakery Executive Dashboard
Key Features of the Bakery Executive Dashboard in Google Sheets
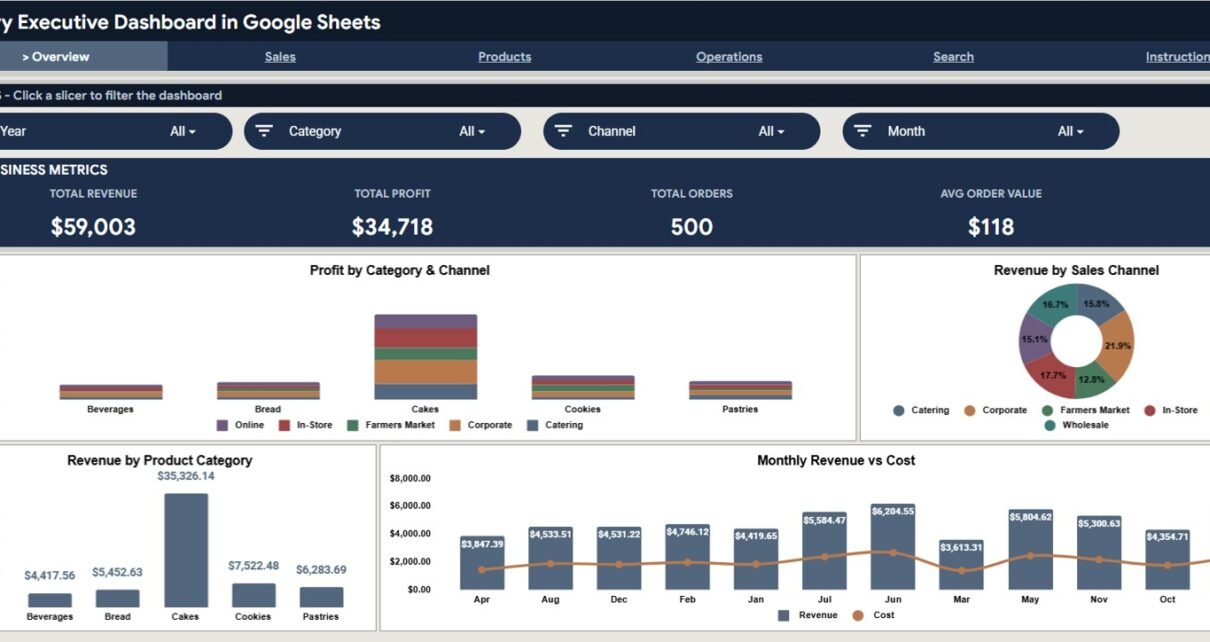
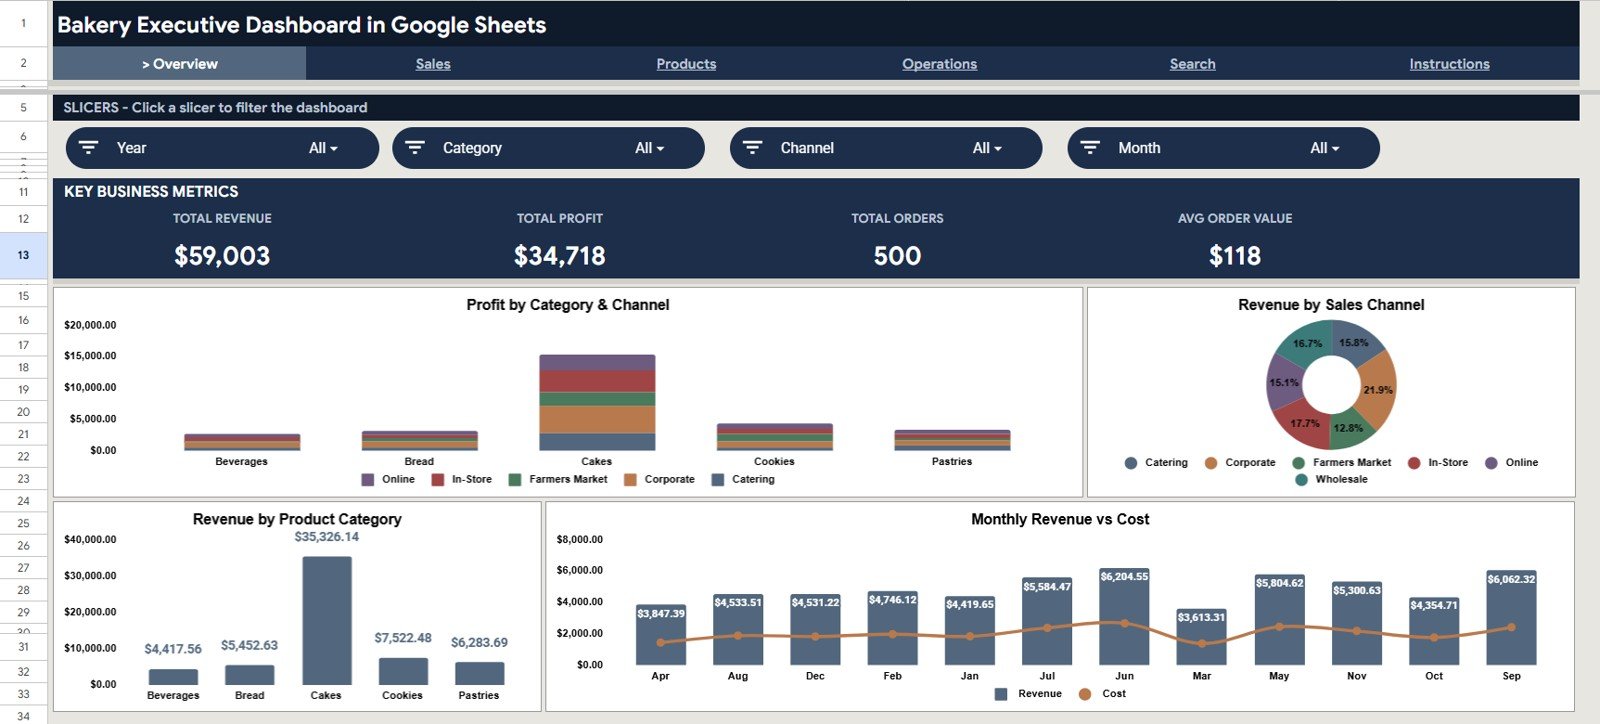
The dashboard is built around four KPI cards and 16 charts spread over four analysis pages. Every visual reads from one Data sheet, so the whole report stays consistent as you add orders. With the 500 sample orders, the Overview shows $59,003 in revenue, $34,718 in profit, and a $118 average order value.
- 4 executive KPI cards: Total Revenue, Total Profit, Total Orders, and Avg Order Value sit at the top of the Overview page.
- 16 ready-made charts covering revenue, profit, cost, sales channel, product category, payment method, and order status.
- Slicer-based filtering: Year, Category, Channel, and Month on the Overview, with Payment Method and Status slicers on other pages.
- An order Search tab that returns the full record for any Order ID.
- A single Data sheet that every page references; add rows and the charts expand on their own.
Dashboard Pages Explanation
Overview Page
The Overview page is the landing screen. It shows the four KPI cards plus slicers and four charts: Profit by Category & Channel, Revenue by Sales Channel, Revenue by Product Category, and Monthly Revenue vs Cost. The sample data uses five categories (Beverages, Bread, Cakes, Cookies, Pastries) and six channels (Catering, Corporate, Farmers Market, In-Store, Online, Wholesale).
Sales Page
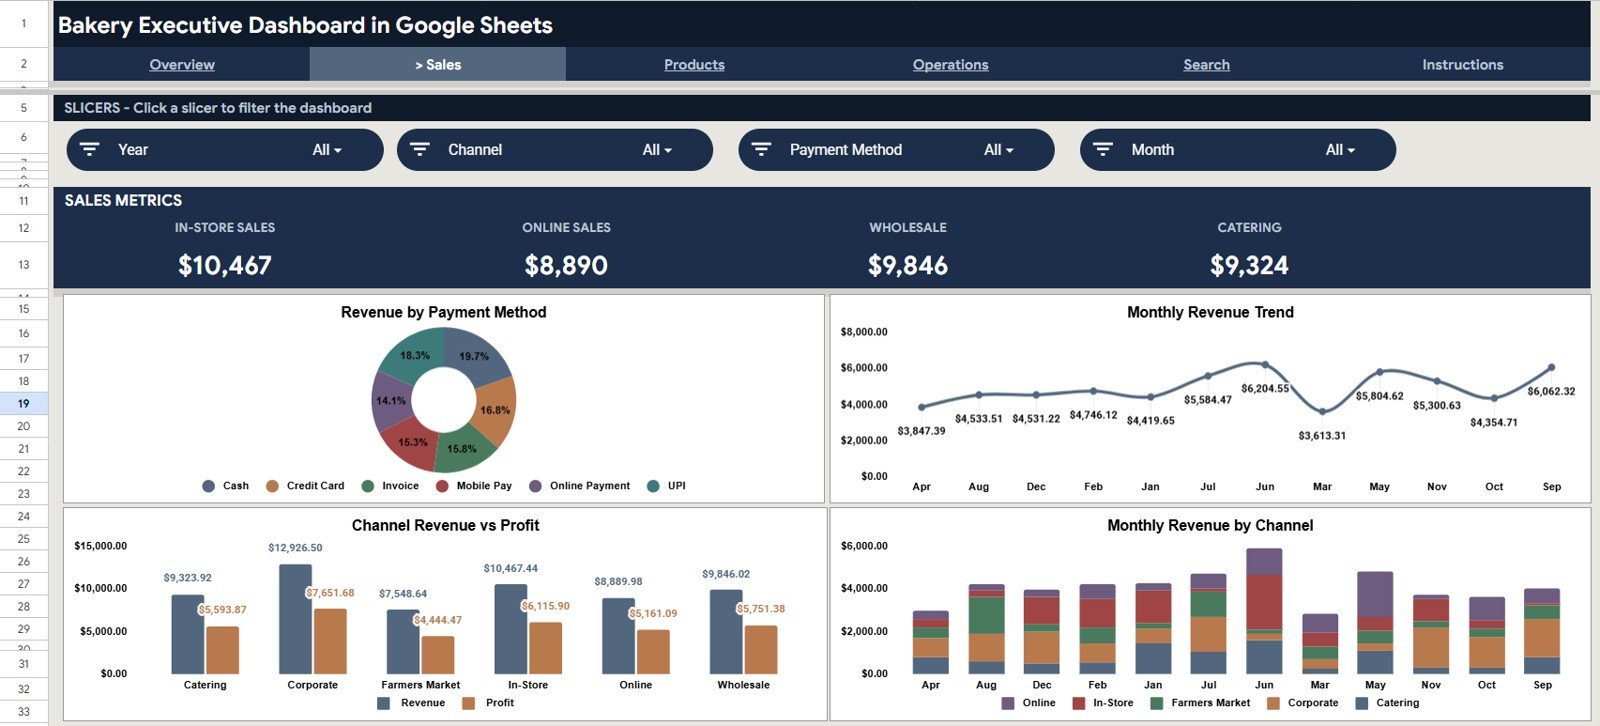
The Sales page focuses on how revenue arrives. Cards show In-Store, Online, Wholesale, and Catering sales, and four charts (Revenue by Payment Method, Monthly Revenue Trend, Channel Revenue vs Profit, and Monthly Revenue by Channel) show which channels and payment types (Cash, Credit Card, Invoice, Mobile Pay, Online Payment, UPI) drive the top line over time.
Products Page
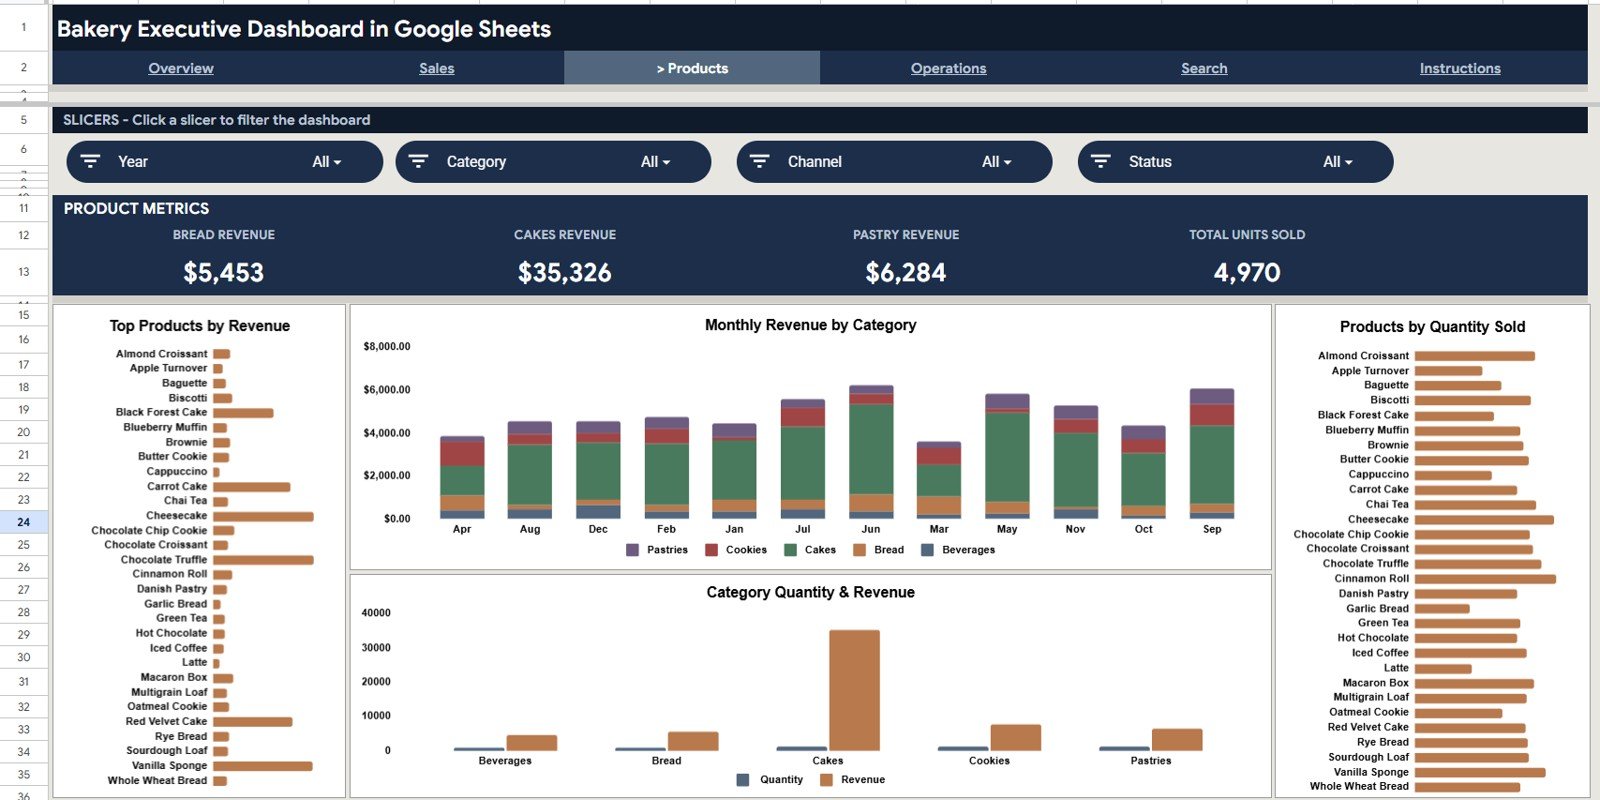
The Products page ranks your menu with Top Products by Revenue, Monthly Revenue by Category, Category Quantity & Revenue, and Products by Quantity Sold, so you know which bakes earn and which simply move volume. Its cards show Bread, Cakes, and Pastry revenue plus Total Units Sold.
Operations Page
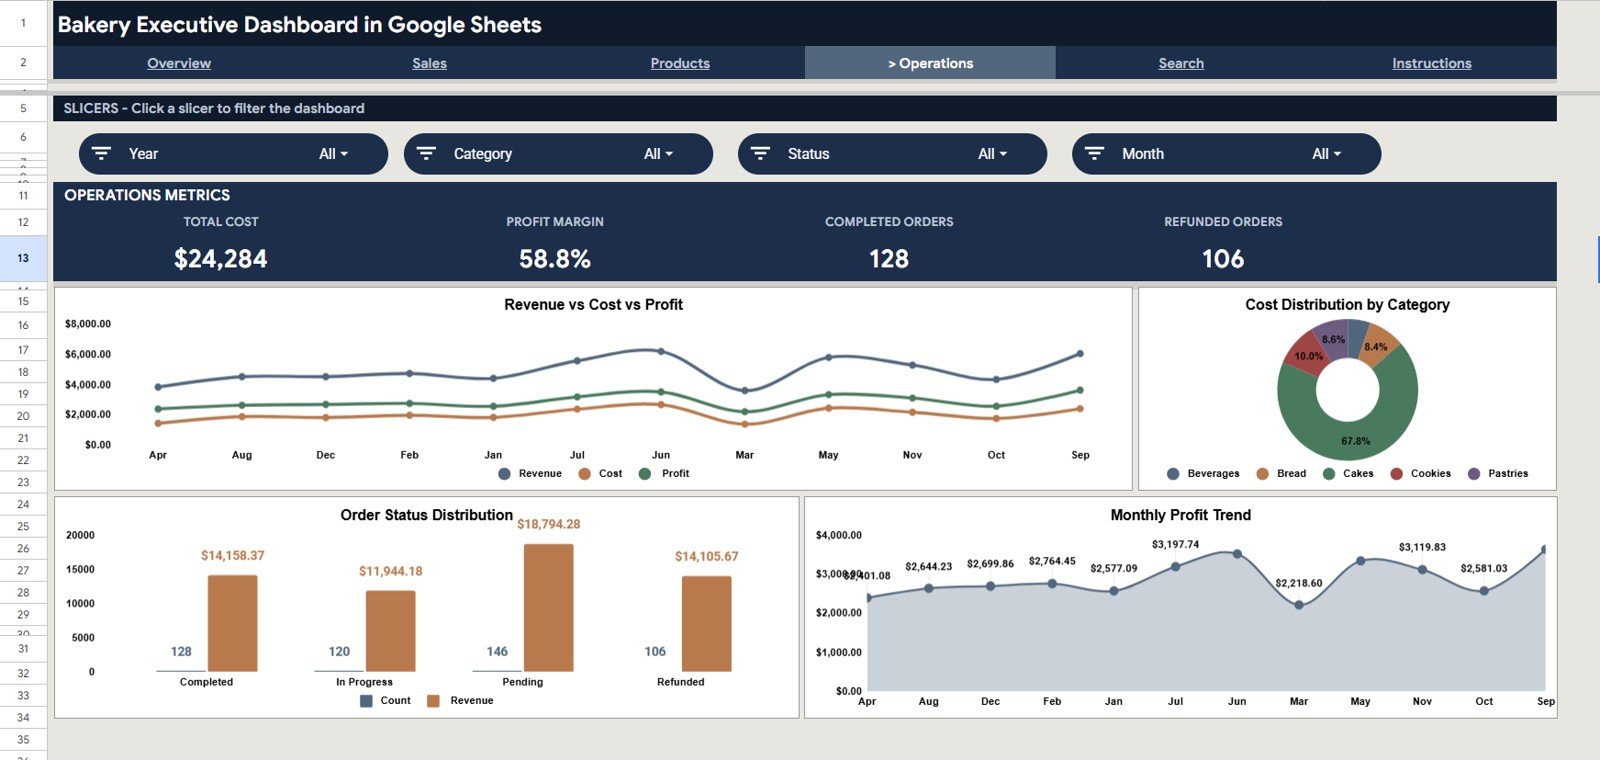
The Operations page connects cost to profit with Revenue vs Cost vs Profit by month, Cost Distribution by Category, Order Status Distribution (Completed, In Progress, Pending, Refunded), and a Monthly Profit Trend. Its cards show Total Cost, Profit Margin, Completed Orders, and Refunded Orders, the view that shows whether growth is actually profitable.
Search Sheet
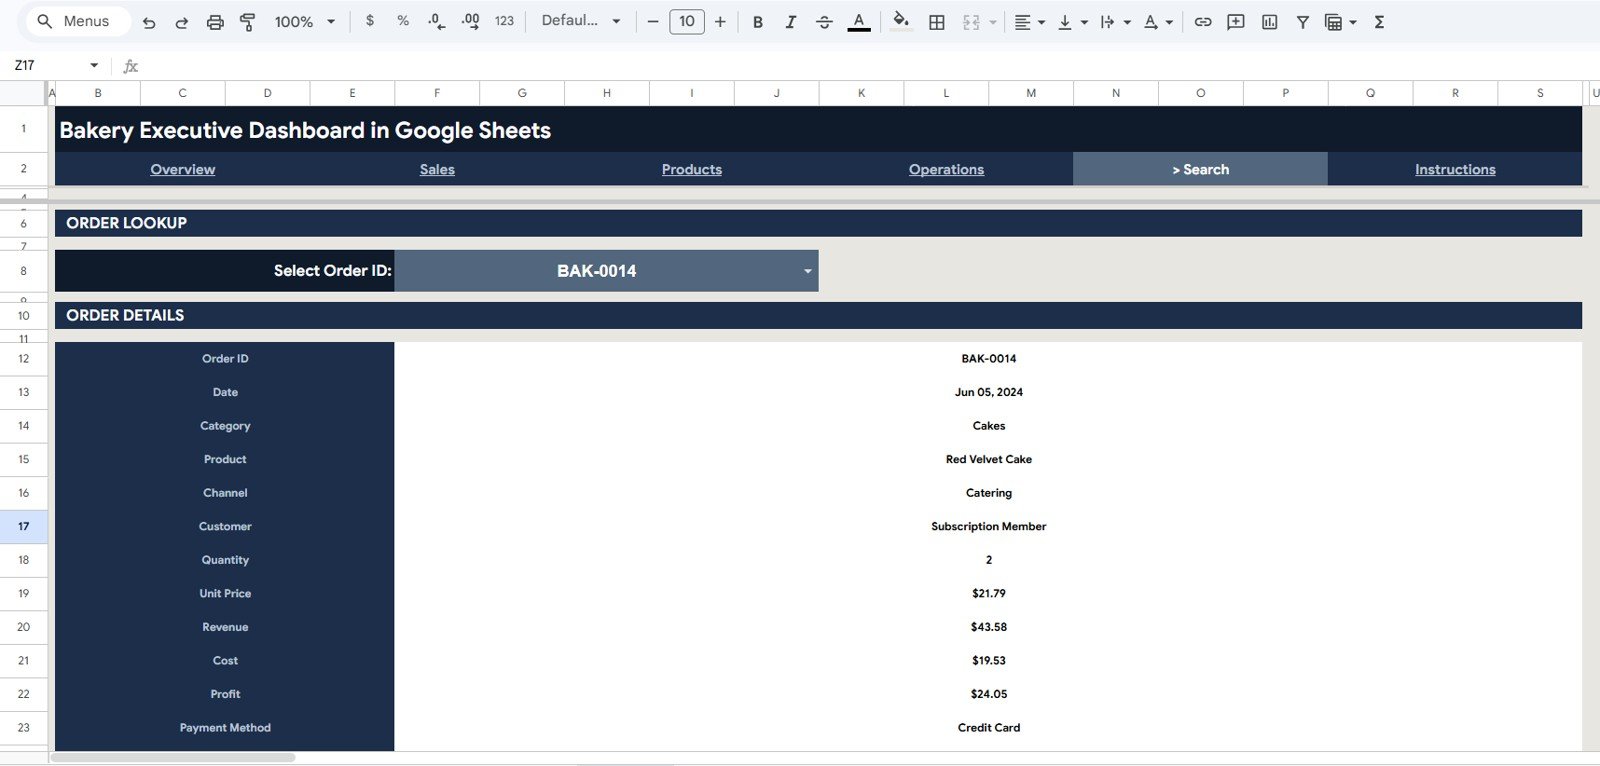
The Search tab is a quick lookup. Pick any Order ID from the dropdown and the sheet shows its Date, Category, Product, Channel, Customer, Quantity, Unit Price, Revenue, Cost, Profit, and Payment Method. In the sample, order BAK-0014 is 2 Red Velvet Cakes at $21.79 each, so Revenue is 2 × $21.79 = $43.58, and after $19.53 of cost the Profit is $24.05.
Data Sheet
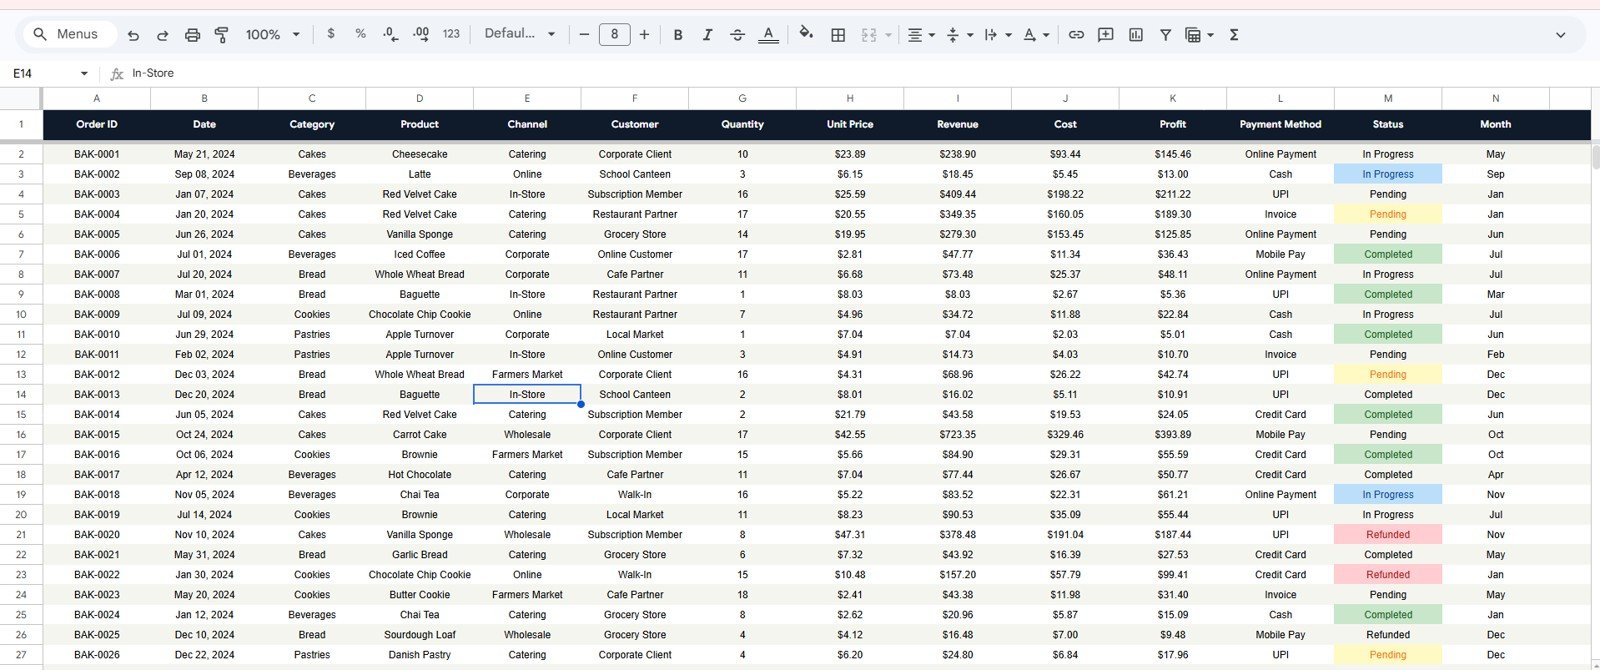
The Data tab is the engine. Enter each order in the same column layout (Order ID, Date, Category, Product, Channel, Customer, Quantity, Unit Price, Revenue, Cost, Profit, Payment Method, Status, Month) and every page, chart, KPI card, and the Search tab draw from this single source.
Bakery Executive Dashboard in Google Sheets vs. Microsoft Excel Dashboard vs. Paid POS Analytics: Feature Comparison
| Feature | Bakery Executive Dashboard (Google Sheets) | Microsoft Excel Dashboard | Toast / Square POS Analytics |
|---|---|---|---|
| Cost | One-time purchase | One-time template price | Plan fees plus processing fees |
| Platform | Google Sheets (browser) | Desktop Excel | Proprietary POS and cloud |
| Setup time | Under 10 minutes | Under 10 minutes | Days (hardware and onboarding) |
| Real-time team collaboration | Built in | Needs OneDrive | Yes |
| Mobile access | Sheets app | Limited | Yes |
| Customizable fields | Fully editable | Fully editable | Locked to vendor |
| Share with link | Yes | File-based | Account seats |
| Per-order profit view | Built in | Built in | Depends on plan |
| Live transaction capture | No (manual or exported data) | No | Yes |
For bakeries that want owner-level visibility into revenue, profit, and product mix without paying monthly POS analytics fees, the Bakery Executive Dashboard in Google Sheets sits in the sweet spot.
Who Should Use This Template
Perfect for:
- Independent bakery and café owners tracking daily sales, profit, and order mix.
- Home-baking and multi-channel bakeries selling in-store, online, wholesale, and through catering or corporate orders.
- Bakery managers who report weekly revenue and margins to an owner or franchise.
Not a fit if:
- You run a large multi-outlet chain that needs live POS-terminal and ERP integration.
- You need automatic transaction capture rather than manual or exported data entry.
- You require an audited, role-based financial system.
Real-World Use Cases
Priya runs a single-location artisan bakery. Each Sunday she opens the Overview and Operations pages to check profit by category and the monthly cost trend, then decides which low-margin lines to retire.
Daniel manages a bakery selling in-store, online, and to wholesale and corporate customers. He leans on the Sales page (Monthly Revenue by Channel and Revenue by Payment Method) to decide where weekend promotions earn the most.
Aisha is a franchise area manager. She uses the Products page (Top Products by Revenue and Category Quantity & Revenue) to standardise the bestsellers across her outlets, sharing the same file by link with each store lead.
Advantages of the Bakery Executive Dashboard in Google Sheets
The biggest advantage is cost-to-value: a one-time-purchase file gives owner-level visibility without recurring analytics fees. Because it lives in Google Sheets, it opens on any device, shares by link, and supports real-time team editing. The single-Data-sheet design keeps maintenance simple (you only ever update one tab) and the slicers make filtered views instant. Google’s sort and filter documentation explains how filtering works. To build dashboards like this yourself, the Pivot Tables and Dashboards course on NextGenTemplates Academy is a good next step.
Opportunities for Improvement
The dashboard relies on manual or exported data entry, so it is not a live till replacement. If you need automatic transaction capture, pair it with a point-of-sale tool such as the Bakery POS Web App. Very large datasets (tens of thousands of rows) will run faster in Power BI, and bakeries needing audited, role-based permissions will outgrow a shared sheet. For most single-site and small-chain bakeries, none of these are blockers.
Best Practices
- Keep the Data sheet column order intact; the charts and Search tab depend on it.
- Enter every order with a unique Order ID so the Search tab stays reliable.
- Review the Operations page monthly to catch cost creep before it eats margin.
- Duplicate the file each year so historical periods stay clean and fast.
Explore Relevant Templates
For a simpler sales view, see the Bakery Business Dashboard in Google Sheets or the target-based Bakery KPI Dashboard in Google Sheets. If you run the counter as well as the back office, the Bakery POS Web App and the Coffee Cafe POS Web App add billing and stock control. To watch stock alongside sales, see the Inventory Status Analysis Dashboard in Google Sheets.
Frequently Asked Questions
What KPIs does the Bakery Executive Dashboard in Google Sheets track?
It tracks Total Revenue, Total Profit, Total Orders, and Average Order Value, plus 16 charts covering channel, category, product, payment method, cost, and order status.
How many pages and charts are included?
It includes four report pages (Overview, Sales, Products, and Operations) along with a Search tab, a Data tab, and an Instructions tab, with 16 charts in total.
Do I need Excel or any software to use it?
No. It runs in any free Google account in your browser, with no installs, add-ons, or macros required.
How long does setup take?
Under 10 minutes. Make your own copy, paste your orders into the Data sheet in the same format, and every chart, KPI card, and the Search tab update automatically.
How does this compare to a bakery POS analytics subscription?
POS analytics usually comes as part of a monthly plan tied to the till. The Bakery Executive Dashboard in Google Sheets is a one-time purchase that reads manual or exported order data instead of capturing live transactions.
Can I filter the dashboard?
Yes. Slicers on the Overview page let you filter by year, product category, sales channel, or month with one click, and the other pages add payment method and order status slicers.
About the Author
Built by PK, Microsoft Certified Professional with 15+ years of Excel, Google Sheets, and Power BI experience. Founder of NextGenTemplates. Every template is hand-built and tested before release.
Wrapping Up
The Bakery Executive Dashboard in Google Sheets gives a bakery owner four KPI cards, four analysis pages, 16 charts, and an instant order lookup, all from one editable sheet. Copy it, paste in last month’s orders, and start with the Operations page to see your real profit margin by category.
Get the Bakery Executive Dashboard in Google Sheets
Instant download. One-time payment. No subscription.
📅 Last updated: October 2026