The Audit Operations Management Dashboard in Google Sheets turns structured audit records into six practical tabs: one overview, four focused analysis pages, and one data sheet. Across those pages, three executive cards and 19 charts cover audit status, type, compliance, risk, findings, corrective-action priorities, department and location performance, auditor activity, monthly trends, and cost. That structure gives internal audit and operations teams a shared review layer without requiring a custom database or recurring GRC subscription. The screenshots below show every included page, while the data sheet keeps the input process visible and editable.Audit Operations Management Dashboard in Google Sheets
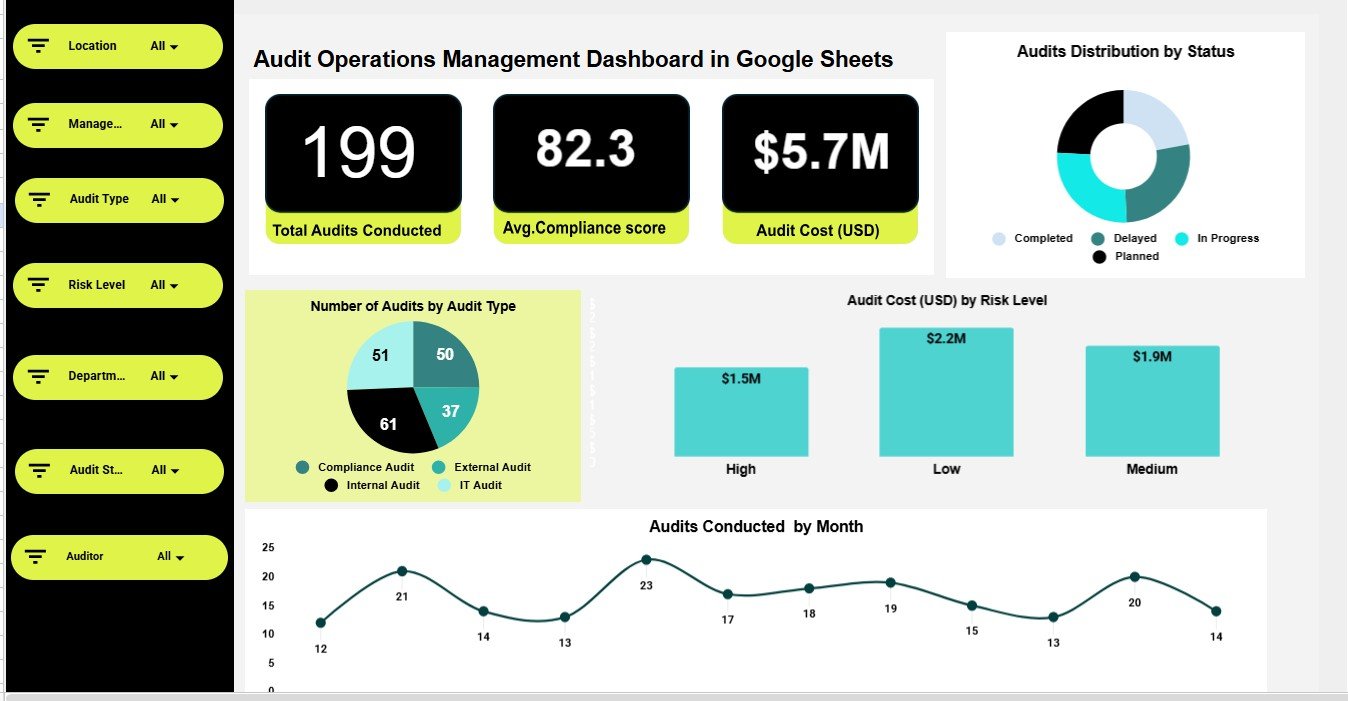
Audit Operations Management Dashboard in Google Sheets
Key Features of Audit Operations Management Dashboard in Google Sheets
- Six purpose-built tabs: Overview, Risk & Compliance Analysis, Findings & Corrective Action, Department & Location Performance, Cost & Efficiency Analysis, and Data.
- Three headline cards: Total Audits Conducted, Avg. Compliance Score, and Audit Cost (USD).Audit Operations Management Dashboard in Google Sheets
- 19 visual analyses: a broad view of workload, risk, control performance, findings, and spending.Audit Operations Management Dashboard in Google Sheets
- Multiple slicers: quick filtering for focused reviews without rebuilding the dashboard.
- Google Sheets sharing: collaboration through the file permissions already available in Google Drive.
- Editable source data: sample rows can be replaced with audit records in the same field structure.Audit Operations Management Dashboard in Google Sheets
Dashboard Pages Explanation
Get the Audit Operations Management Dashboard in Google Sheets
1. Overview Page
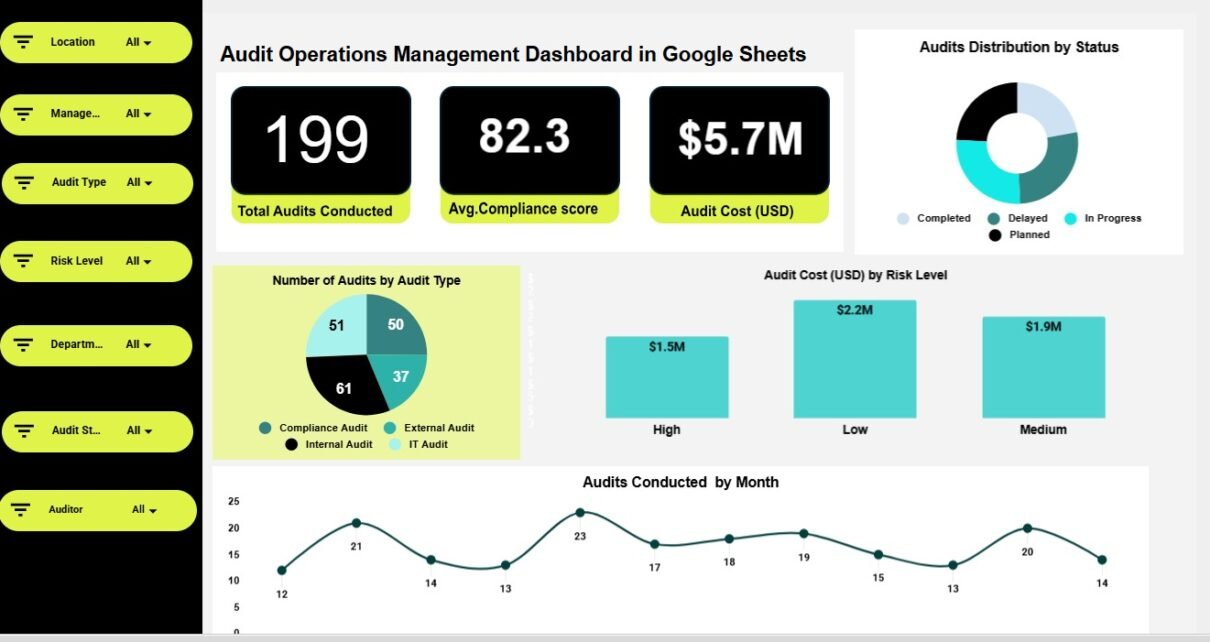
The Overview page starts with Total Audits Conducted, Avg. Compliance Score, and Audit Cost (USD). Together, these cards answer three immediate questions: how much audit work has been completed, how controls are scoring, and what that work costs.Audit Operations Management Dashboard in Google Sheets
Audits Distribution by Status: This chart separates audits according to their current status. It helps reviewers see whether work is completed, active, pending, or concentrated in another stage.Audit Operations Management Dashboard in Google Sheets
Number of Audits by Audit Type: This comparison shows how audit volume is distributed across audit types. It helps test whether the audit plan is balanced or dominated by a narrow type of review.Audit Operations Management Dashboard in Google Sheets
Audit Cost (USD) by Risk Level: This analysis connects audit spending to the assigned risk level. It helps leaders assess whether higher-risk areas are receiving an appropriate share of resources.Audit Operations Management Dashboard in Google Sheets
Audits Conducted by Month: This trend shows how audit activity changes through the year. It makes workload peaks, quiet periods, and potential scheduling gaps easier to identify.Audit Operations Management Dashboard in Google Sheets
2. Risk & Compliance Analysis
This page combines compliance results, audit volume, re-audit needs, and cost by risk. It is designed for reviewers who need to move from general performance to risk-based prioritization.
Avg. Compliance Score by Risk Level: This chart compares the average compliance result across risk groups. A weak score in a high-risk band can guide immediate remediation and management attention.
Re-Audit Requirement Distribution: This view separates records that require another audit from those that do not. It supports follow-up planning and makes the future review workload more visible.Audit Operations Management Dashboard in Google Sheets
Audit Cost (USD) by Risk Level: This chart shows the financial effort associated with each risk category. Reviewers can compare it with audit counts to distinguish expensive work from simply frequent work.Audit Operations Management Dashboard in Google Sheets
Audit Count by Risk Level: This analysis counts audits in each assessed risk band. It helps determine whether coverage is aligned with the organization’s stated risk profile.Audit Operations Management Dashboard in Google Sheets
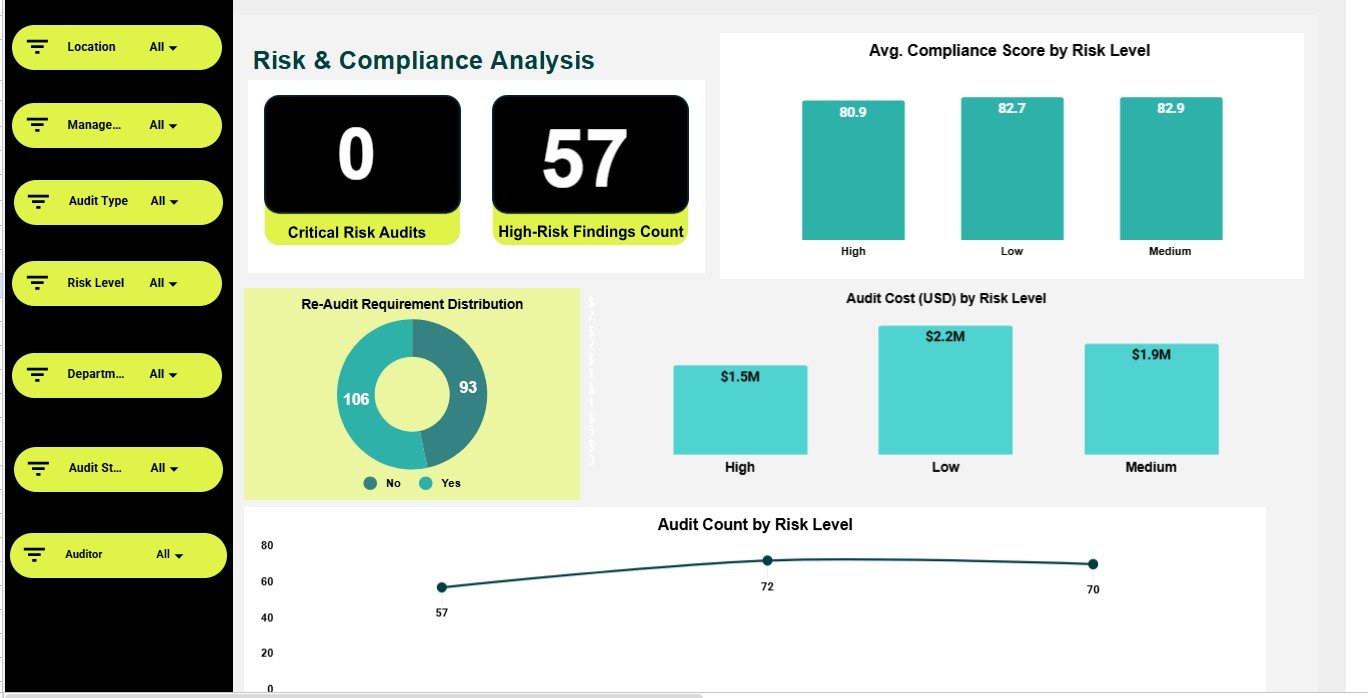
Risk & Compliance Analysis
3. Findings & Corrective Action
The Findings & Corrective Action page helps teams locate serious issues and decide where ownership is needed. Its four views break the findings down by location, category, auditor, and department.
High-Risk Findings by Location: This chart identifies sites associated with the largest number of serious findings. It helps target site reviews, escalation, and corrective-action support.
Audit Findings by Category: This analysis groups findings into issue categories. Repeated categories can signal a systemic control weakness rather than an isolated event.Audit Operations Management Dashboard in Google Sheets
Audit Findings by Auditor: This view compares how many findings are recorded by each auditor. It can support workload reviews while also prompting discussion about scope, assignment complexity, and detection patterns.Audit Operations Management Dashboard in Google Sheets
High-Risk Findings by Department: This chart maps critical findings to accountable departments. It gives leaders a practical starting point for assigning owners and tracking remediation discussions.
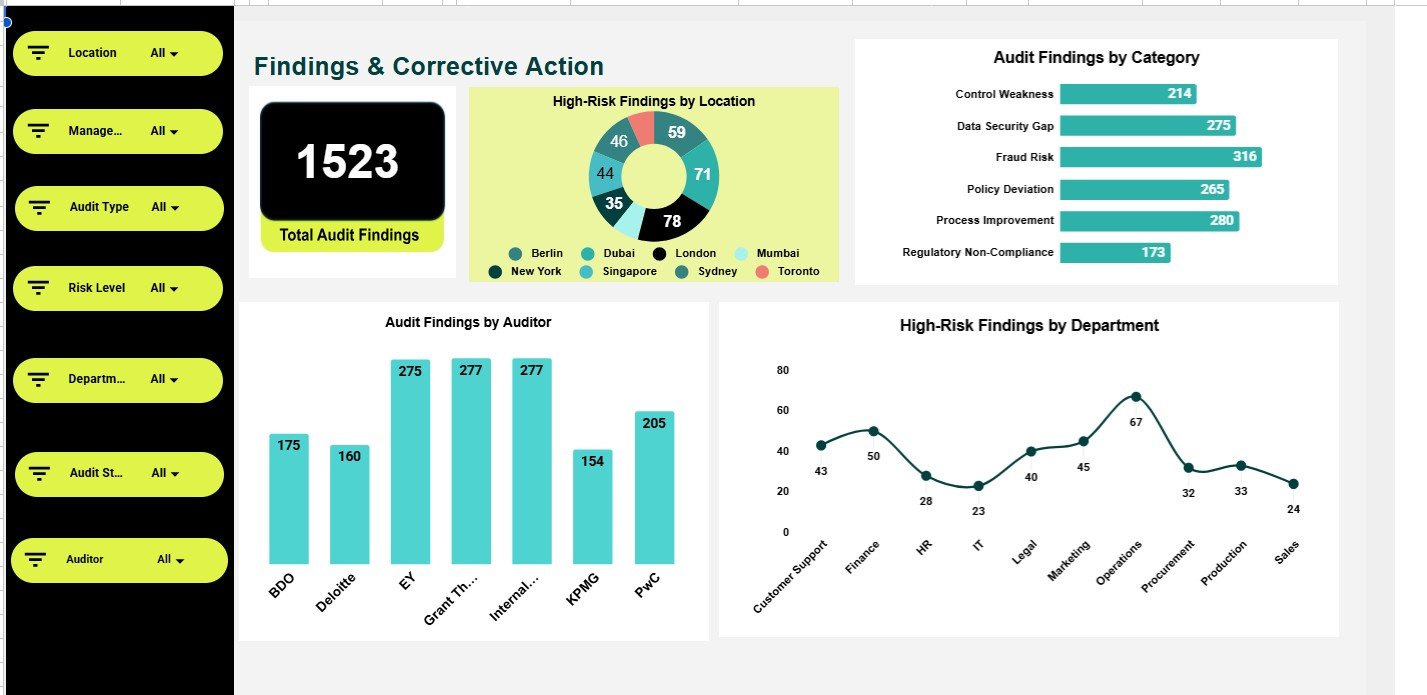
4. Department & Location Performance
This page moves the analysis from individual records to organizational coverage. It helps managers compare compliance and audit activity across departments and sites.
Compliance Score by Department: This chart compares average compliance performance across departments. It helps identify teams that may need stronger controls, training, or management follow-up.
Number of Audits by Location: This view shows how audit coverage is distributed geographically or by site. It can expose locations receiving unusually high or low levels of review.
Number of Audits by Department and Audit Type: This analysis combines two workload dimensions in one comparison. It helps teams see which departments receive which types of audits and where the plan may need rebalancing.
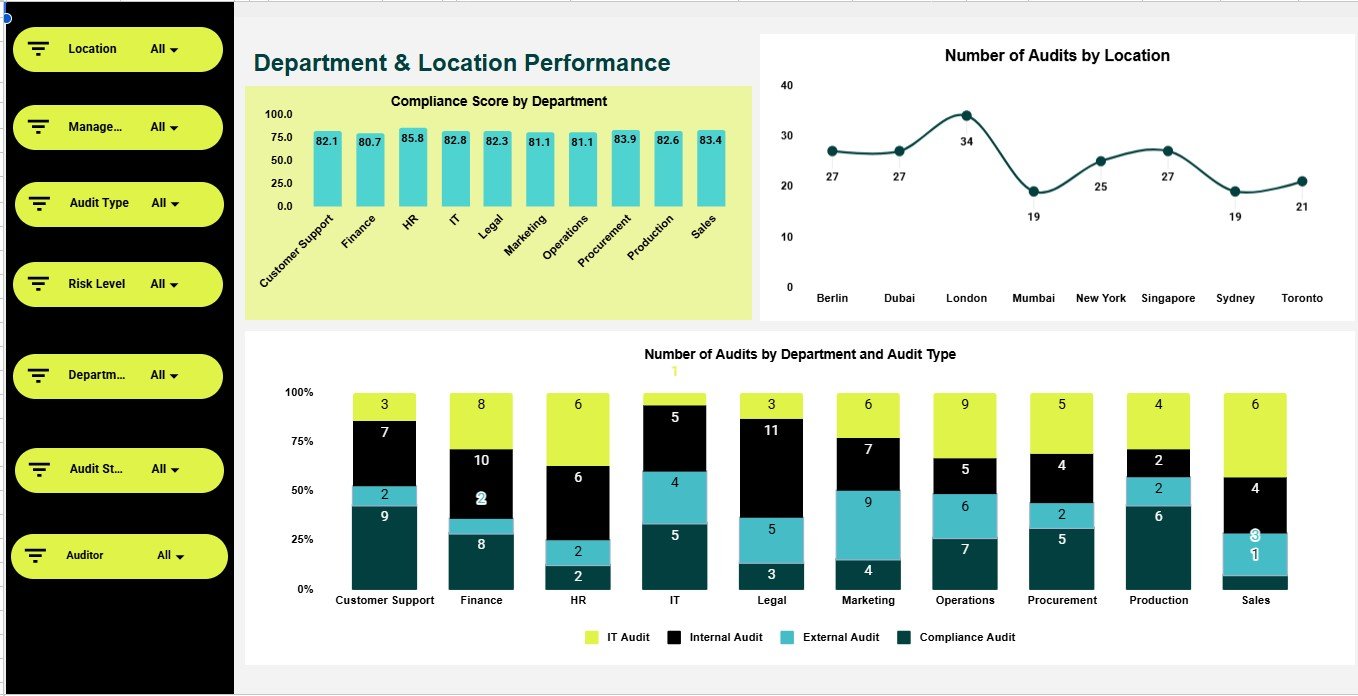
Department & Location Performance
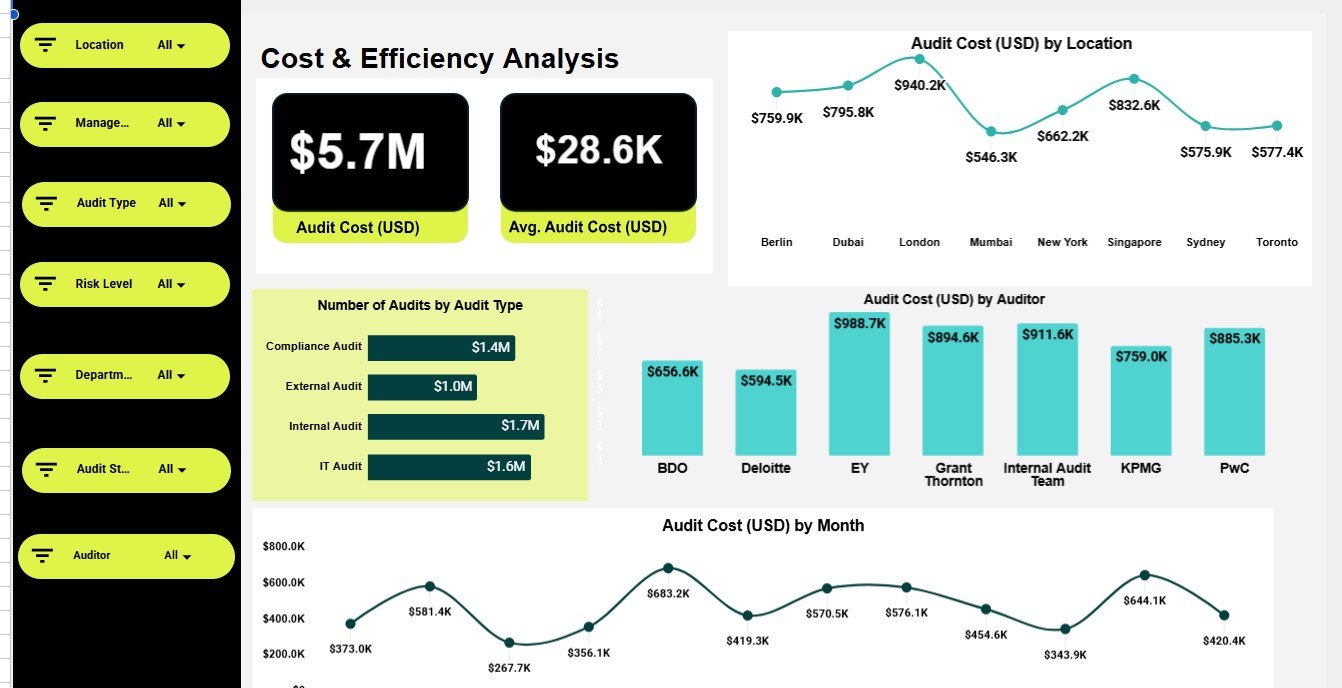
5. Cost & Efficiency Analysis
This page brings the financial side of audit operations into focus. It separates cost by location, auditor, and month while also showing workload by audit type.
Audit Cost (USD) by Location: This chart compares audit expenditure across sites. Unusually high values can prompt a review of travel, scope, complexity, or repeated follow-up work.
Number of Audits by Audit Type: This view summarizes the operating mix by audit type. Combined with cost charts, it helps distinguish high-volume activities from high-cost activities.
Audit Cost (USD) by Auditor: This analysis compares cost associated with auditor assignments. It supports utilization discussions but should be interpreted alongside scope and complexity, not as a standalone performance measure.
Audit Cost (USD) by Month: This trend shows how spending changes through the year. It can help with budget monitoring, forecast updates, and the investigation of cost peaks.
6. Data Sheet Tab
The Data sheet is the structured input area behind the analysis. Add your audit records in the same format, preserve the headers and field types, and keep category names consistent so the dashboard can group records reliably.
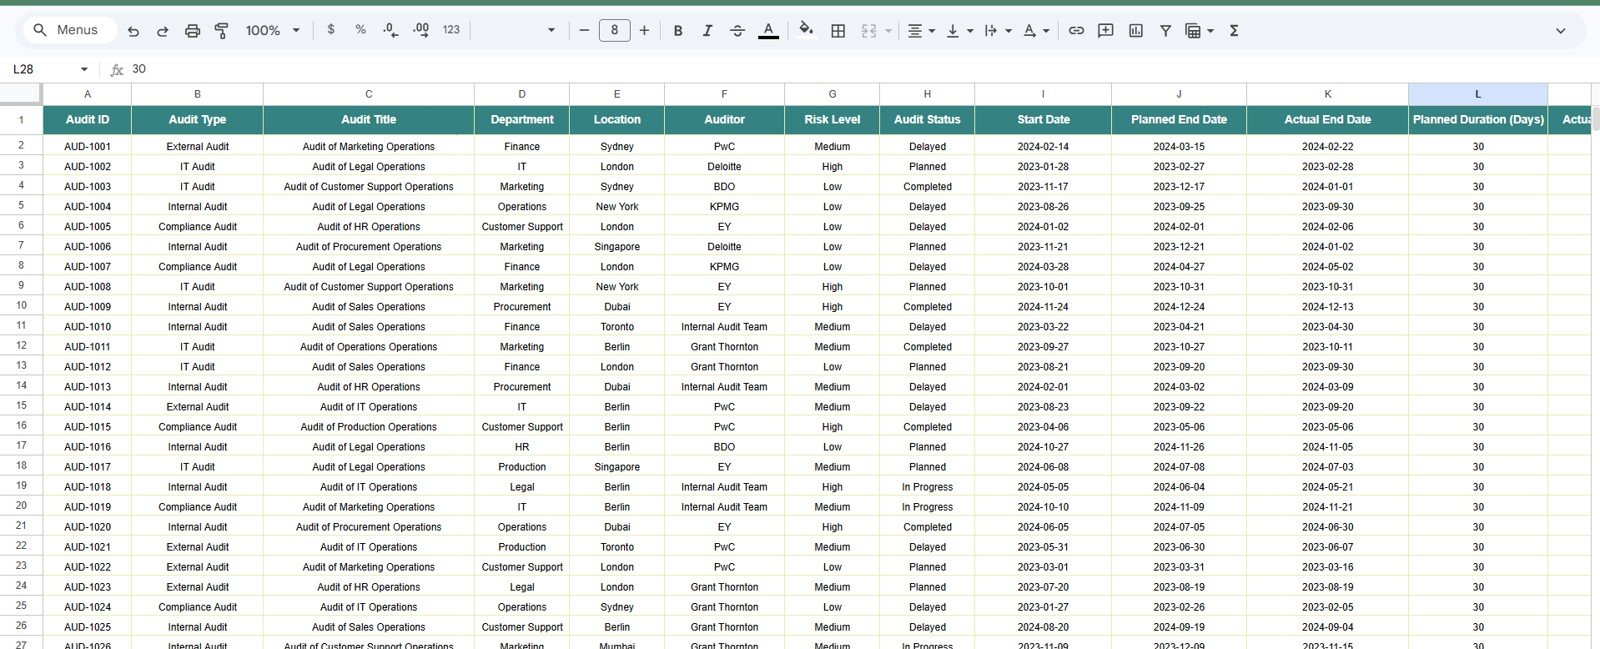
Data Sheet tab
Audit Operations Management Dashboard in Google Sheets vs. Microsoft Excel Dashboard vs. Paid GRC SaaS – Feature Comparison
| Feature | This Google Sheets Template | Microsoft Excel Dashboard | Paid GRC SaaS |
|---|---|---|---|
| Cost | $9.99 sale price, one time | Template cost plus Excel license | Recurring and plan-dependent |
| Platform | Google Sheets | Desktop or web Excel | Vendor-hosted application |
| Setup time | Copy, review fields, replace data | Open, configure, replace data | Onboarding varies |
| Real-time collaboration | Native shared-sheet workflow | Depends on Microsoft 365 setup | Usually included |
| Mobile access | Sheets app or browser | Excel app or browser | Vendor app or browser |
| Customizable fields | Editable sheet structure | Editable workbook structure | Limited by plan and permissions |
| Share with link | Yes, through Drive permissions | Yes, through OneDrive or SharePoint | Usually |
| Year-1 cost at 5 users | $9.99 template price, excluding Workspace costs | Depends on licenses | Depends on vendor and tier |
| Audit analysis | Five visual pages and 19 charts | Depends on workbook design | Varies by module |
Who Should Use This Template
This dashboard fits internal audit teams, quality and compliance coordinators, operations managers, control owners, consultants, and small organizations that already maintain structured audit records. It is especially useful when stakeholders need a shared visual summary but do not need a full evidence repository or automated approval system.
Real-World Use Cases
Get the Audit Operations Management Dashboard in Google Sheets
Asha, an internal audit manager, uses the status, monthly, and risk views before planning the next cycle. She can see where audits are accumulating and where re-audits will consume capacity.
Daniel, a compliance coordinator, compares compliance by department and risk level before meeting control owners. High-risk findings by location help him focus the discussion on the most urgent gaps.
Meera, an operations director, reviews cost by location, auditor, and month during the quarterly budget review. She uses the workload charts to interpret spending in the context of audit volume and type.
Advantages of Audit Operations Management Dashboard in Google Sheets
The dashboard keeps charts and source records in one familiar spreadsheet. Teams can share the file, edit fields, and review filtered results without a separate reporting cycle. Google explains that slicers can filter charts, tables, and pivot tables that share the same data set; see Google Docs Editors Help on slicers.
Opportunities for Improvement
Data quality and updates remain the buyer’s responsibility. The template does not collect evidence, enforce approvals, send notifications, maintain a regulatory library, or provide an immutable log. Those needs call for GRC software or an approved workflow system. Very large datasets may also belong outside one spreadsheet.
Best Practices
- Keep a protected master copy before replacing the sample records.
- Use consistent spelling for departments, locations, auditors, audit types, statuses, and risk levels.
- Enter dates and costs in uniform formats and avoid merged cells inside the data range.
- Assign edit access only to people responsible for maintaining records; use view access for broader audiences.
- Review filtered results carefully because personal slicer selections may not represent the default view seen by others.
- Reconcile headline cards with the data sheet before using screenshots or figures in formal reporting.
Explore Relevant Templates
- Get the Audit Operations Management Dashboard in Google Sheets
- Review the Compliance and Audit Dashboard in Google Sheets
- Explore the Risk Management KPI Scorecard in Google Sheets
- Explore the Operations KPI Scorecard in Google Sheets
Frequently Asked Questions
Get the Audit Operations Management Dashboard in Google Sheets
What does the audit operations dashboard track?
It tracks audit status, audit type, compliance, risk, re-audit needs, findings, locations, departments, auditors, monthly activity, and cost.
How many pages are included?
The template includes five visual dashboard pages and one structured data sheet, for six tabs in total.
Can the dashboard be filtered?
Yes. Multiple slicers are included to narrow connected analysis quickly. The available filter fields depend on the configuration of each page.
Can my team collaborate in the file?
Yes. Use Google Drive permissions to decide who can view, comment on, or edit the spreadsheet.
Is this a complete audit workflow system?
No. It is a spreadsheet-based tracking and analysis template. It does not replace enterprise evidence, approval, regulatory, and audit-trail features.
How should I add my own data?
Use the supplied Data sheet, keep the headers and formats consistent, and replace the sample rows with your audit records.
About the Author
Built by PK – Microsoft Certified Professional with 15+ years of Excel, Google Sheets, and Power BI experience. Founder of NextGenTemplates, reaching 300K+ subscribers across YouTube channels. Every template is hand-built and tested before release.
Conclusion
The Audit Operations Management Dashboard in Google Sheets brings audit workload, compliance, risk, findings, performance, and cost into one visible review layer. Its six tabs and 19 charts suit teams that need flexible analysis in a shared spreadsheet while keeping their source data accessible. Review the screenshots, confirm that the included fields match your audit process, and use the data sheet consistently for dependable results.
Get the Audit Operations Management Dashboard in Google Sheets
For step-by-step spreadsheet tutorials, visit YouTube.com/@NeoTechNavigators.
Last updated: July 15, 2026.