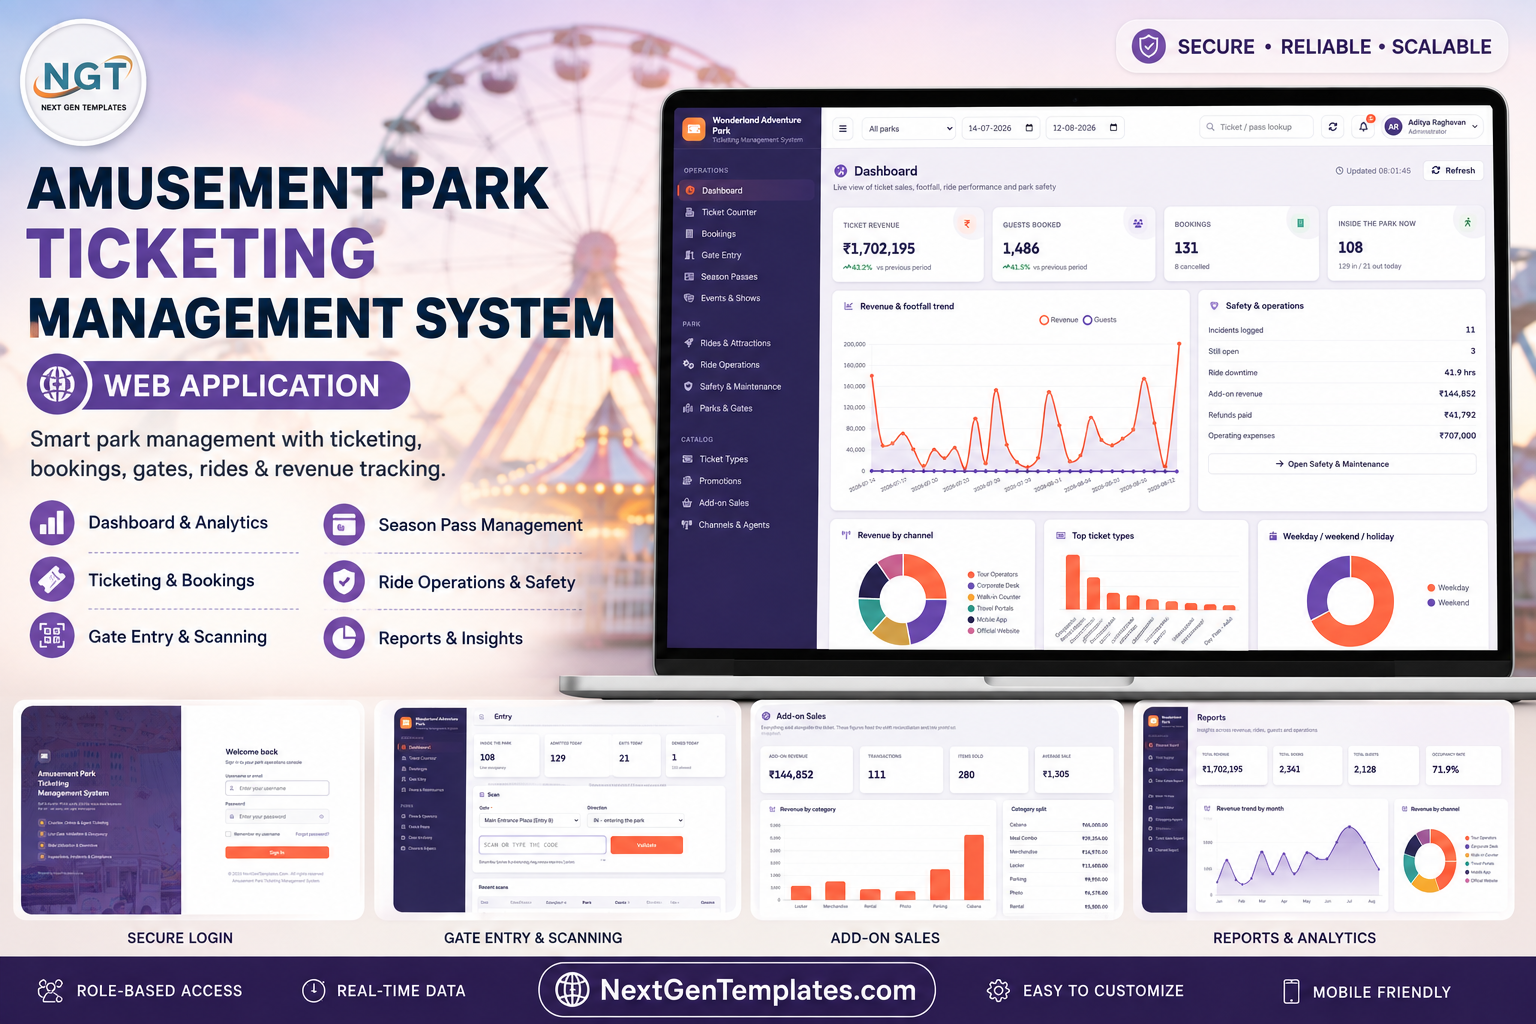
Most small amusement parks do not lose money at the gate because the tickets are mispriced. They lose it because the weekend rate got charged on a Tuesday, because a school group of 22 walked in on 12 scanned codes, because three cash drawers came up short and nobody could prove where, and because the ride that failed its inspection date was still being sold at the counter. The Amusement Park Ticketing Management System Web App closes those gaps in one browser tab. It is 22 screens built on Google Sheets and Google Apps Script, with 5 roles enforced on the server rather than merely hidden from the menu. Its seeded demo database builds 34 sheets and roughly 13,000 rows – 3 parks, 8 gates, 26 ticket types, 28 rides, 320 bookings, 4,279 tickets, 5,567 gate scans, 64 season passes and 347 payments – so every KPI card, chart and report is populated the second you sign in.
Get the Amusement Park Ticketing Management System Web App
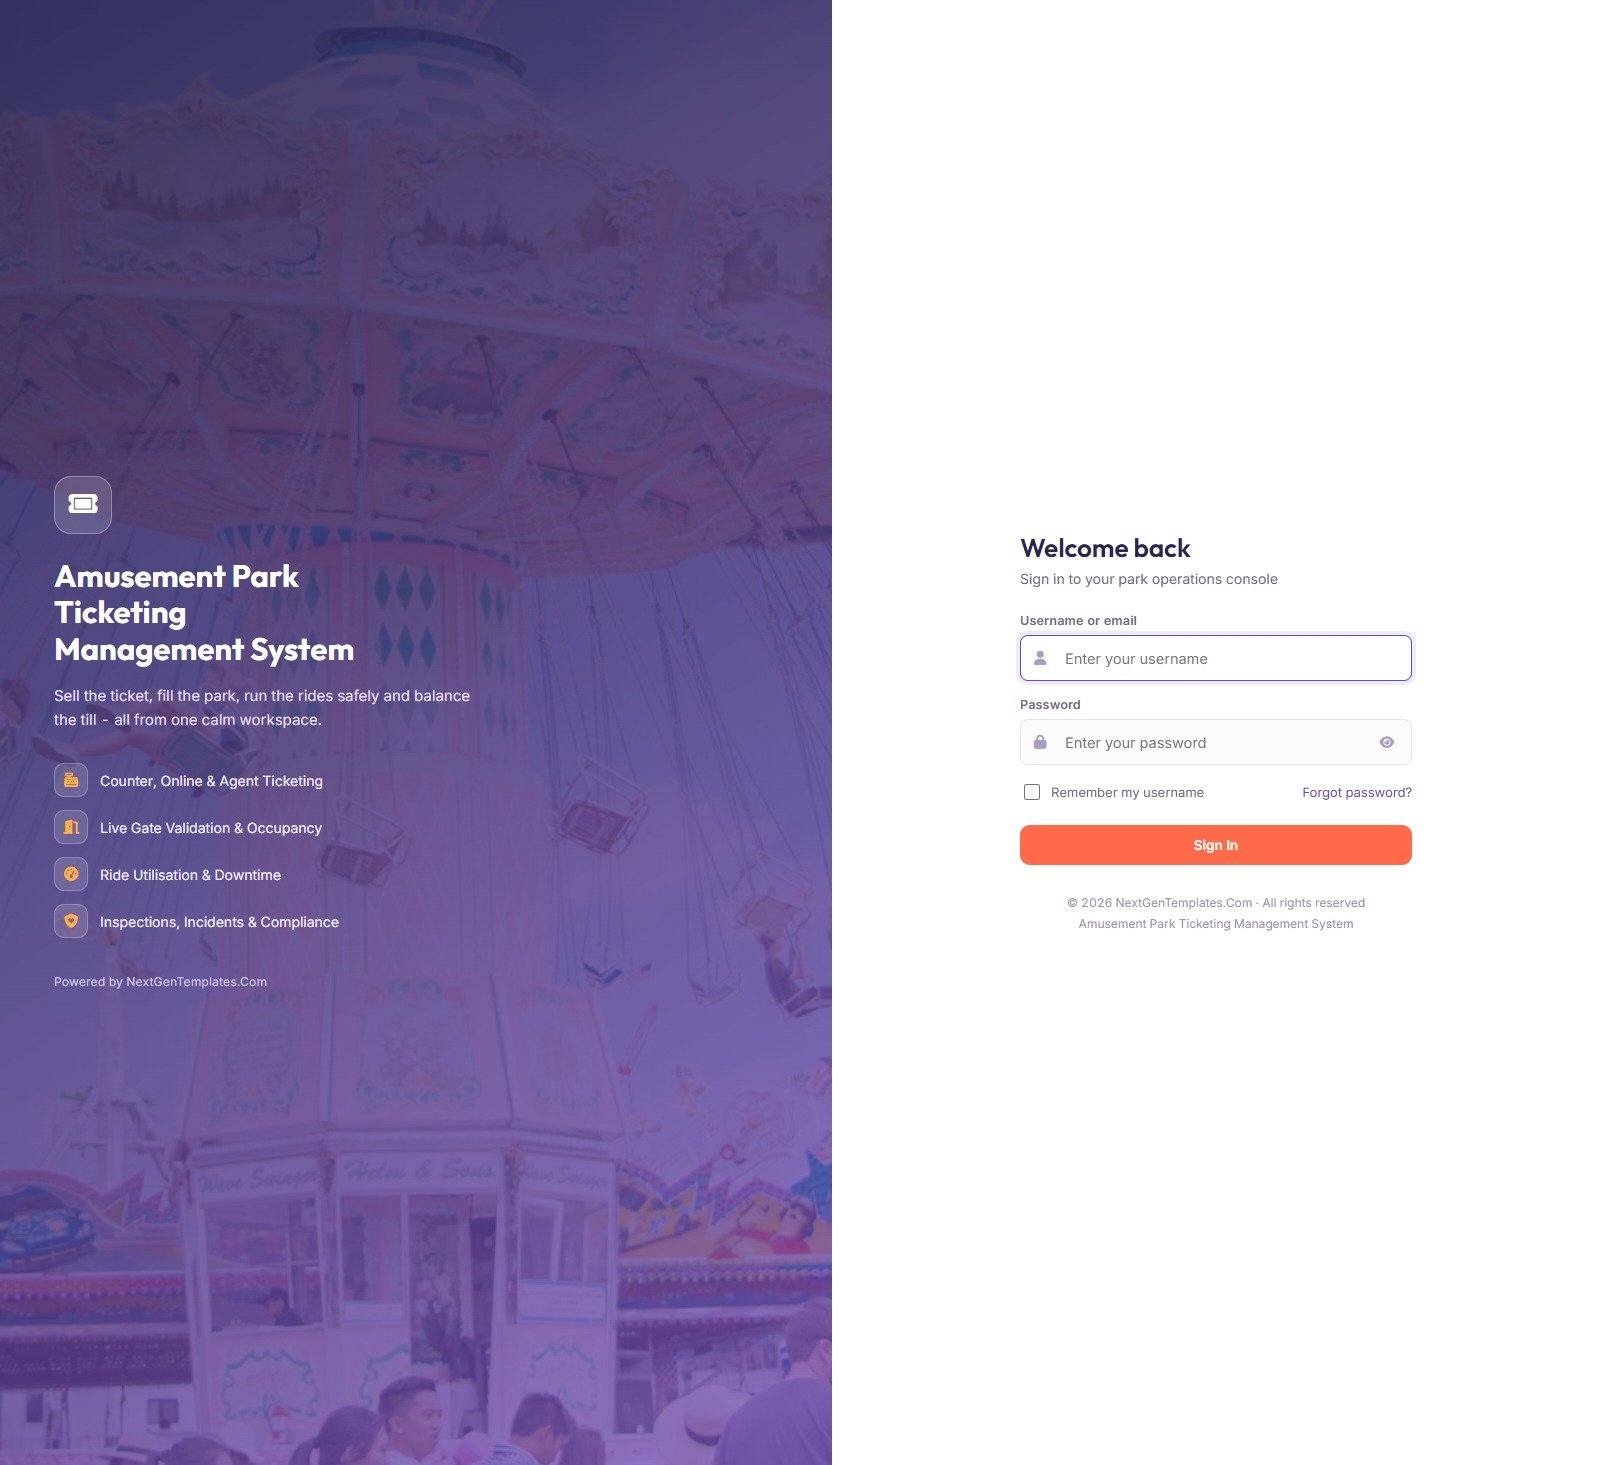
The login screen is deliberately quiet: park branding on the left, one username-and-password form on the right. It never reveals whether the username or the password was wrong, never displays default credentials, and locks an account after five consecutive failed attempts until an Administrator unlocks it.
🚀 Try the Live Demo Before You Buy
We have deployed this web app in our own Google account so you can test every page, every role, every gate scan and every report – with real sample data – before purchasing. No signup, no email required.
🔑 Test Login Credentials
Sign in as admin to reach every module including Settings and User Management, then sign in again as gate to see how tightly a turnstile operator is locked down. That contrast is the whole product. Use counter to sell a ticket and accounts to run the money reports.
💡 These credentials are public on purpose – they are the seeded logins of a shared demo instance that resets periodically, not of anybody’s live park. What you get after purchase: the full source code (Code.gs + Index.html) plus a step-by-step deployment guide so you can deploy your own private instance in your own Google account in under 15 minutes.
Key Features of the Amusement Park Ticketing Management System Web App
- Pricing decided on the server. The Ticket Counter does not trust the browser. It prices the basket against a weekday / weekend / holiday matrix, applies the promo code, adds tax and checks remaining capacity before it will accept a payment.
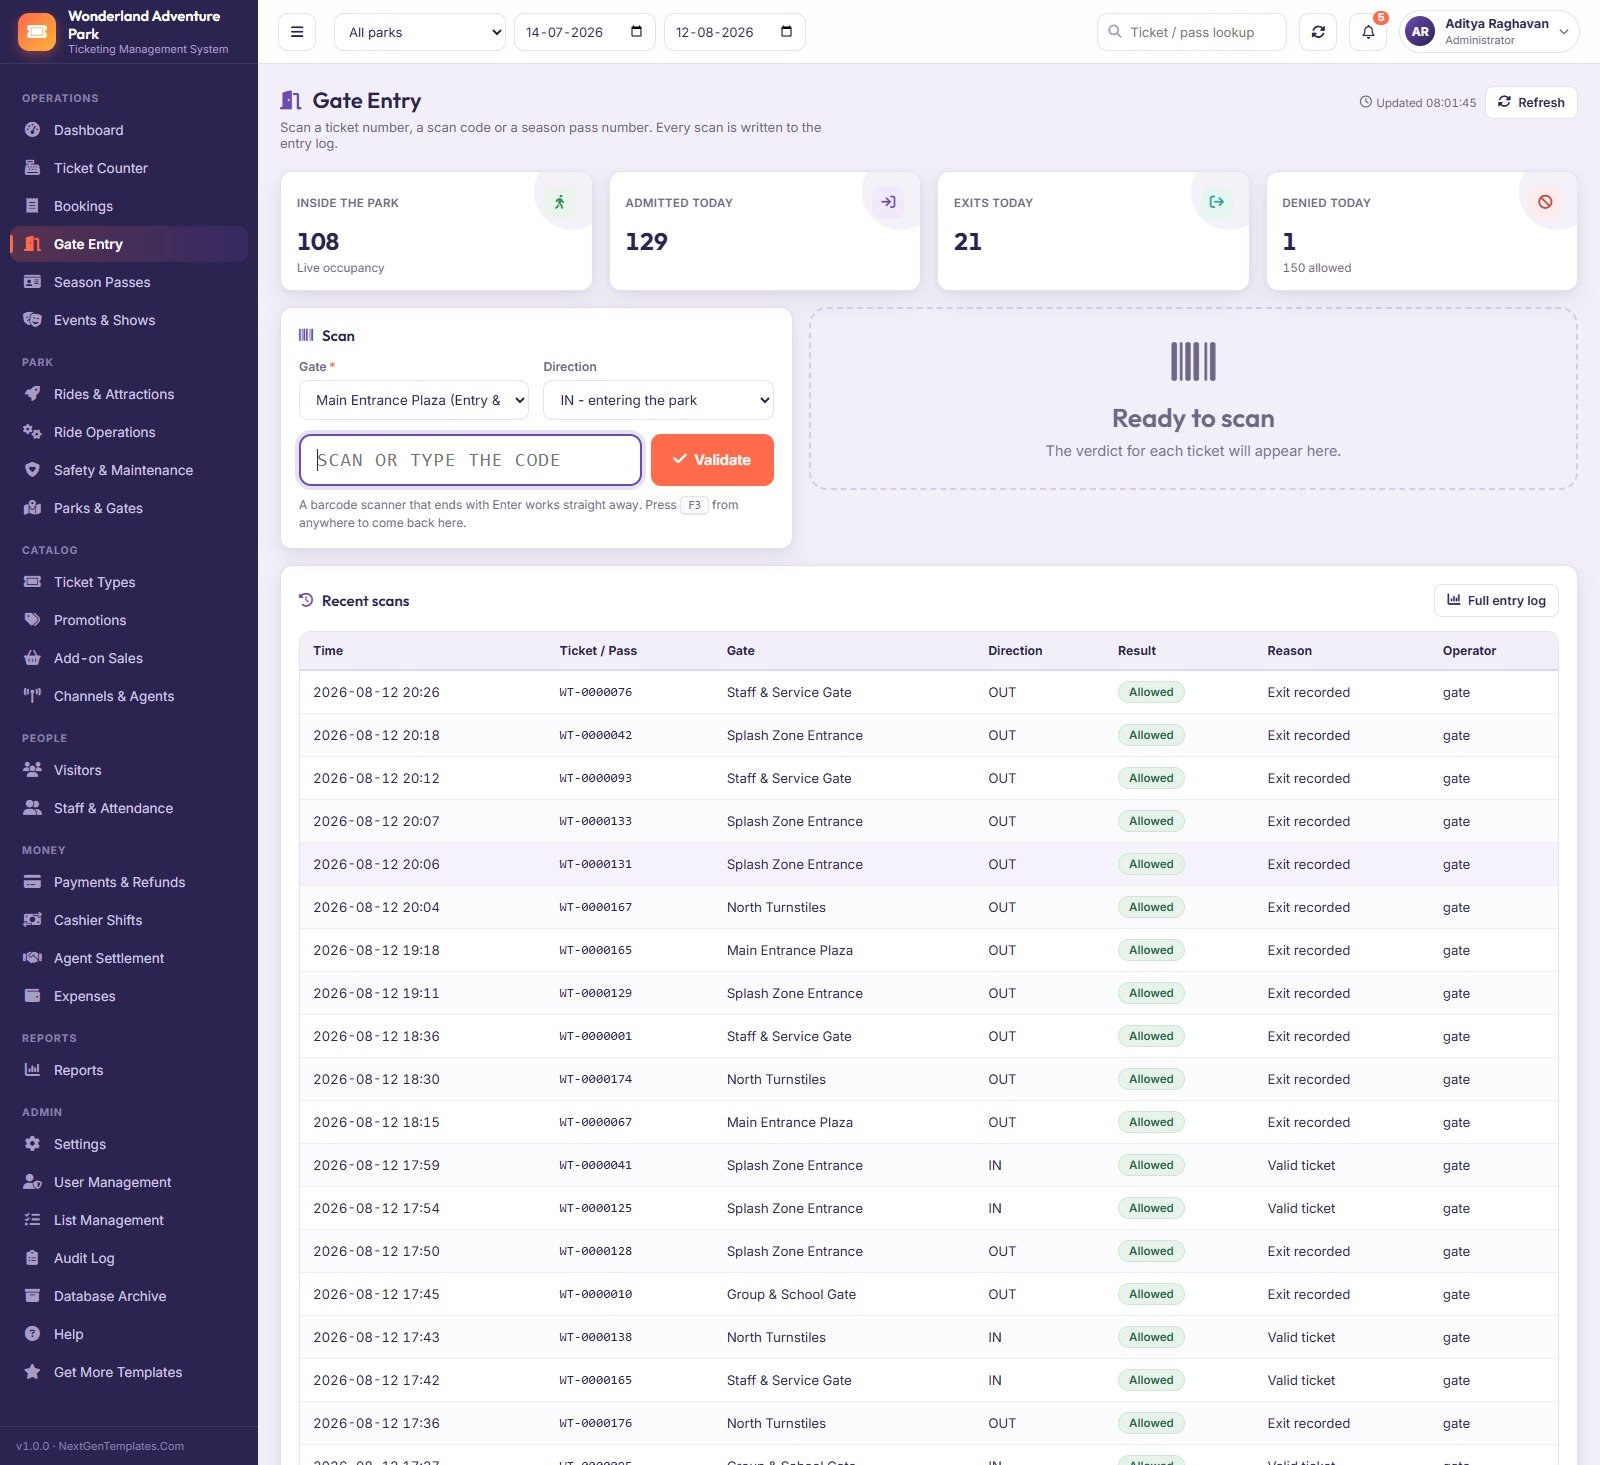
- Gate scanning with a real verdict. A scan returns Allowed or Denied with a reason, writes to the entry log and moves live occupancy. In the demo window: 129 admitted, 21 exited, 1 denied, 108 currently inside.
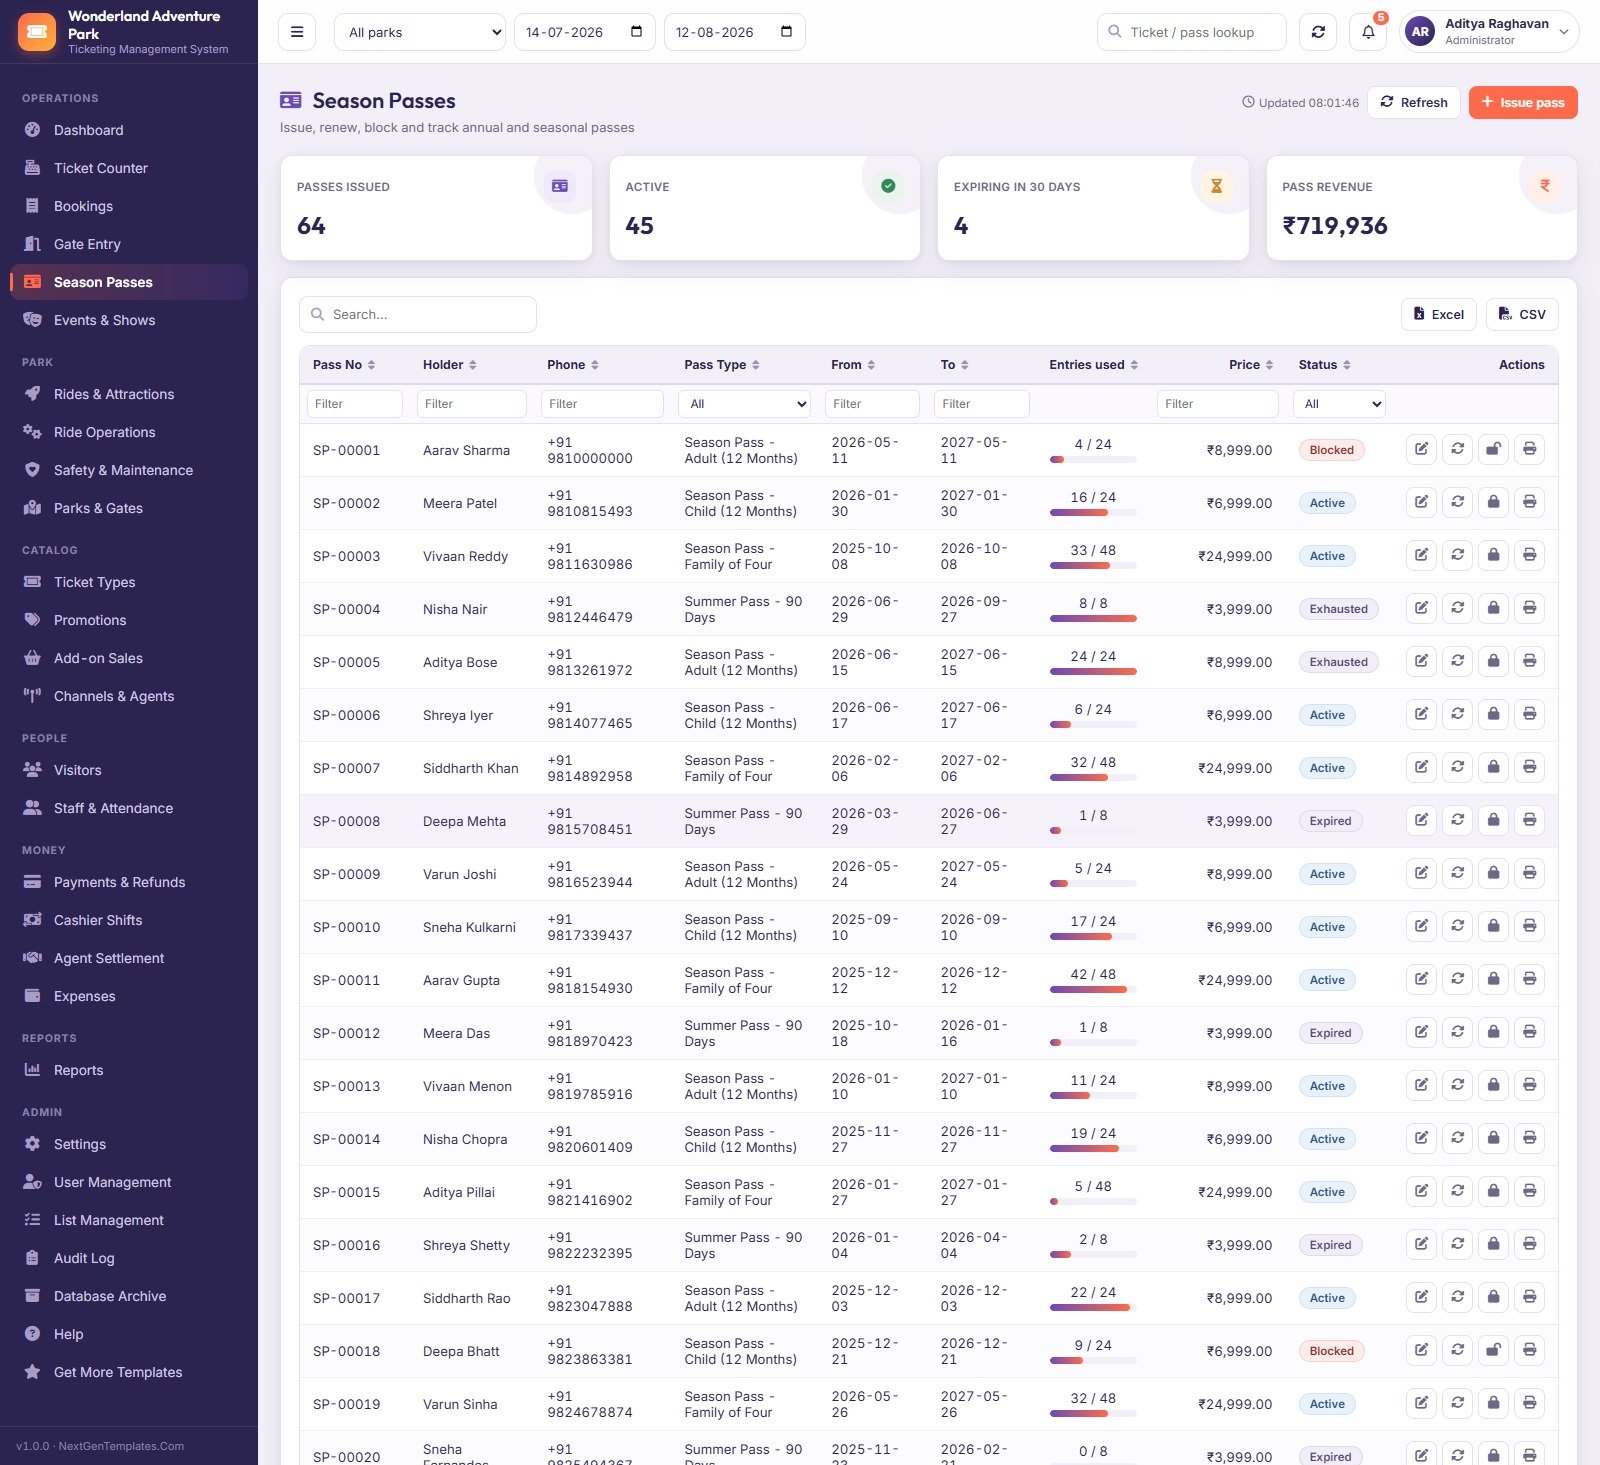
- Entry allowances that burn down. Season and summer passes carry 8, 24 or 48 entries. A pass shows 16 / 24 used and flips itself to Exhausted.
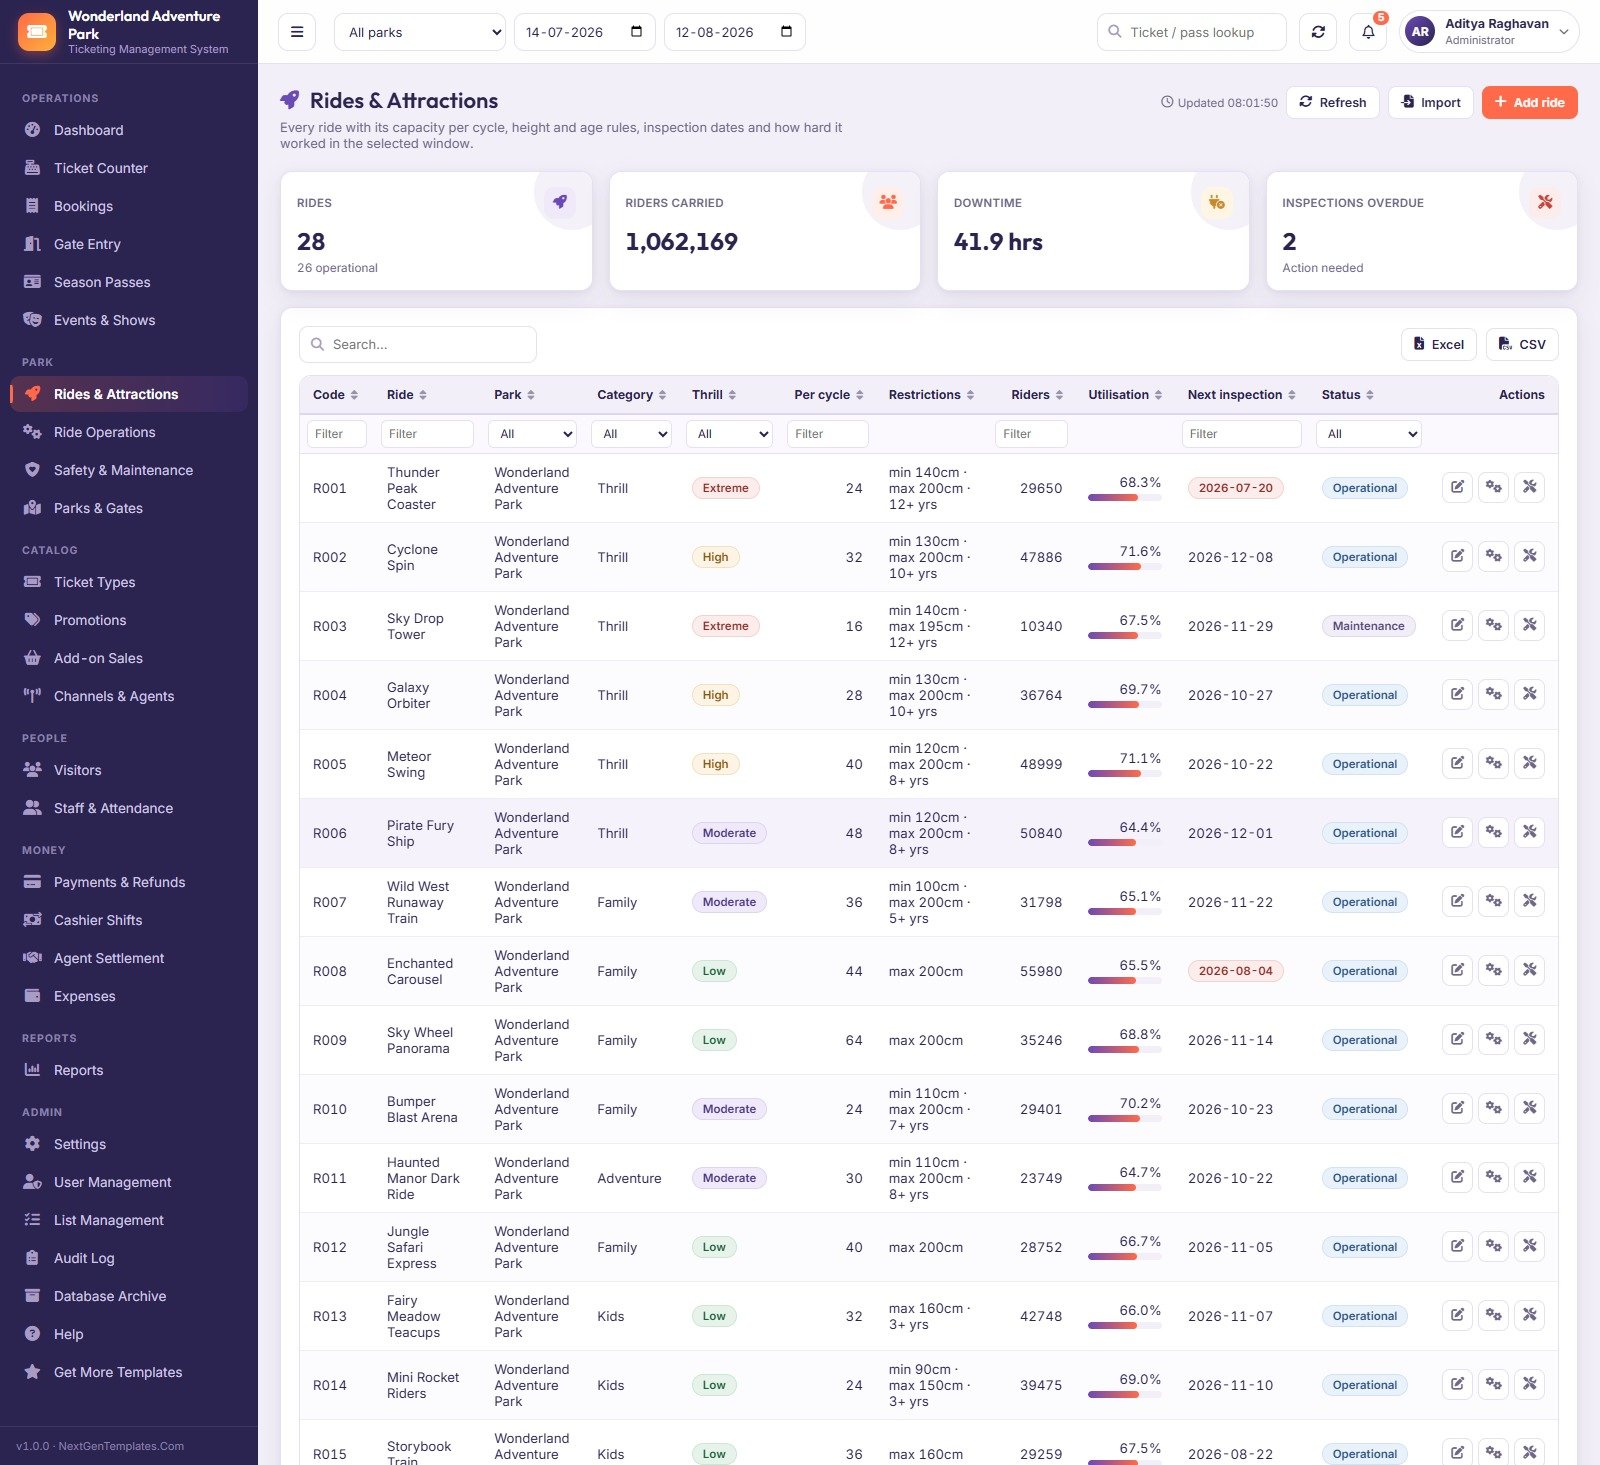
- Ride rules the counter respects. Every ride carries minimum and maximum height, an age limit, riders per cycle and a next-inspection date that renders red when overdue.
- Cash reconciliation that cannot be fudged. A shift recomputes its takings from the payments actually recorded on that counter, then compares against the counted drawer. The demo shows 90 shifts and a net variance of -600 across 13 short drawers.
- Commission that settles. Six channels carry a commission percentage and a settlement cycle; Agent Settlement rolls a month per agent and marks it paid. The demo has 267,571 in commission with 83,010 still to pay.
- Everything is logged. Every create, update, delete, approval and sign-in lands in the Audit Log with user, module, record and a plain-English detail.
- Behaviour is configuration, not code. Ten Settings tabs hold 51 stored settings and List Management holds 198 dropdown values, so currency, tax, capacity mode, print sizes, theme and session timeout are all edits.
Screen-by-Screen Explanation
Dashboard
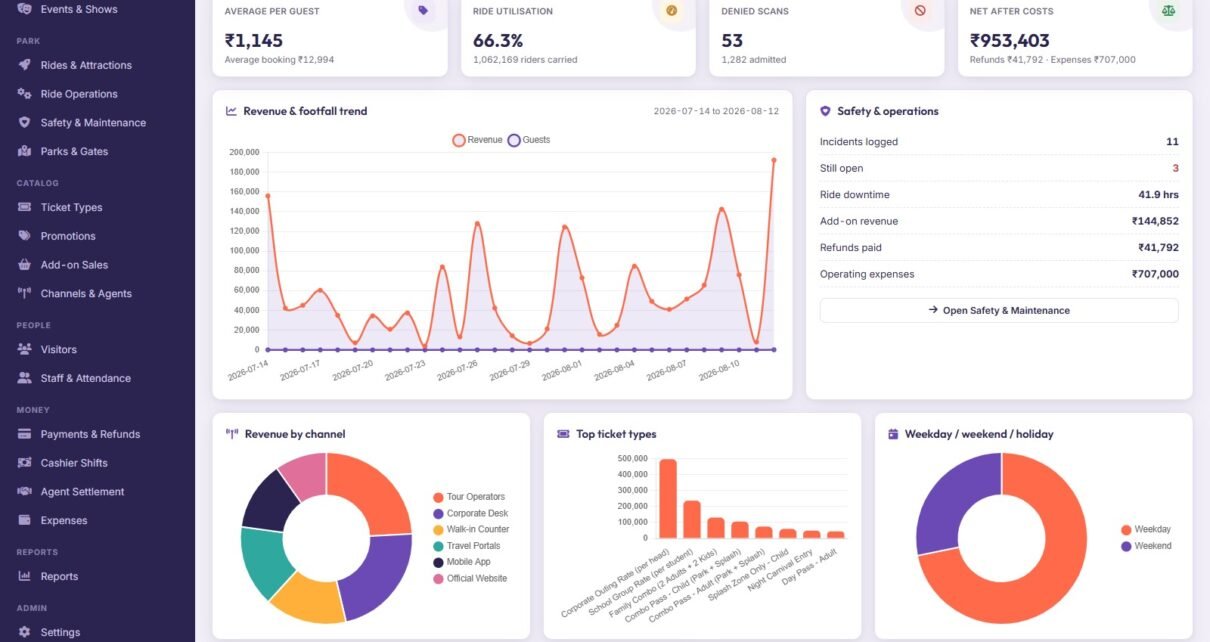
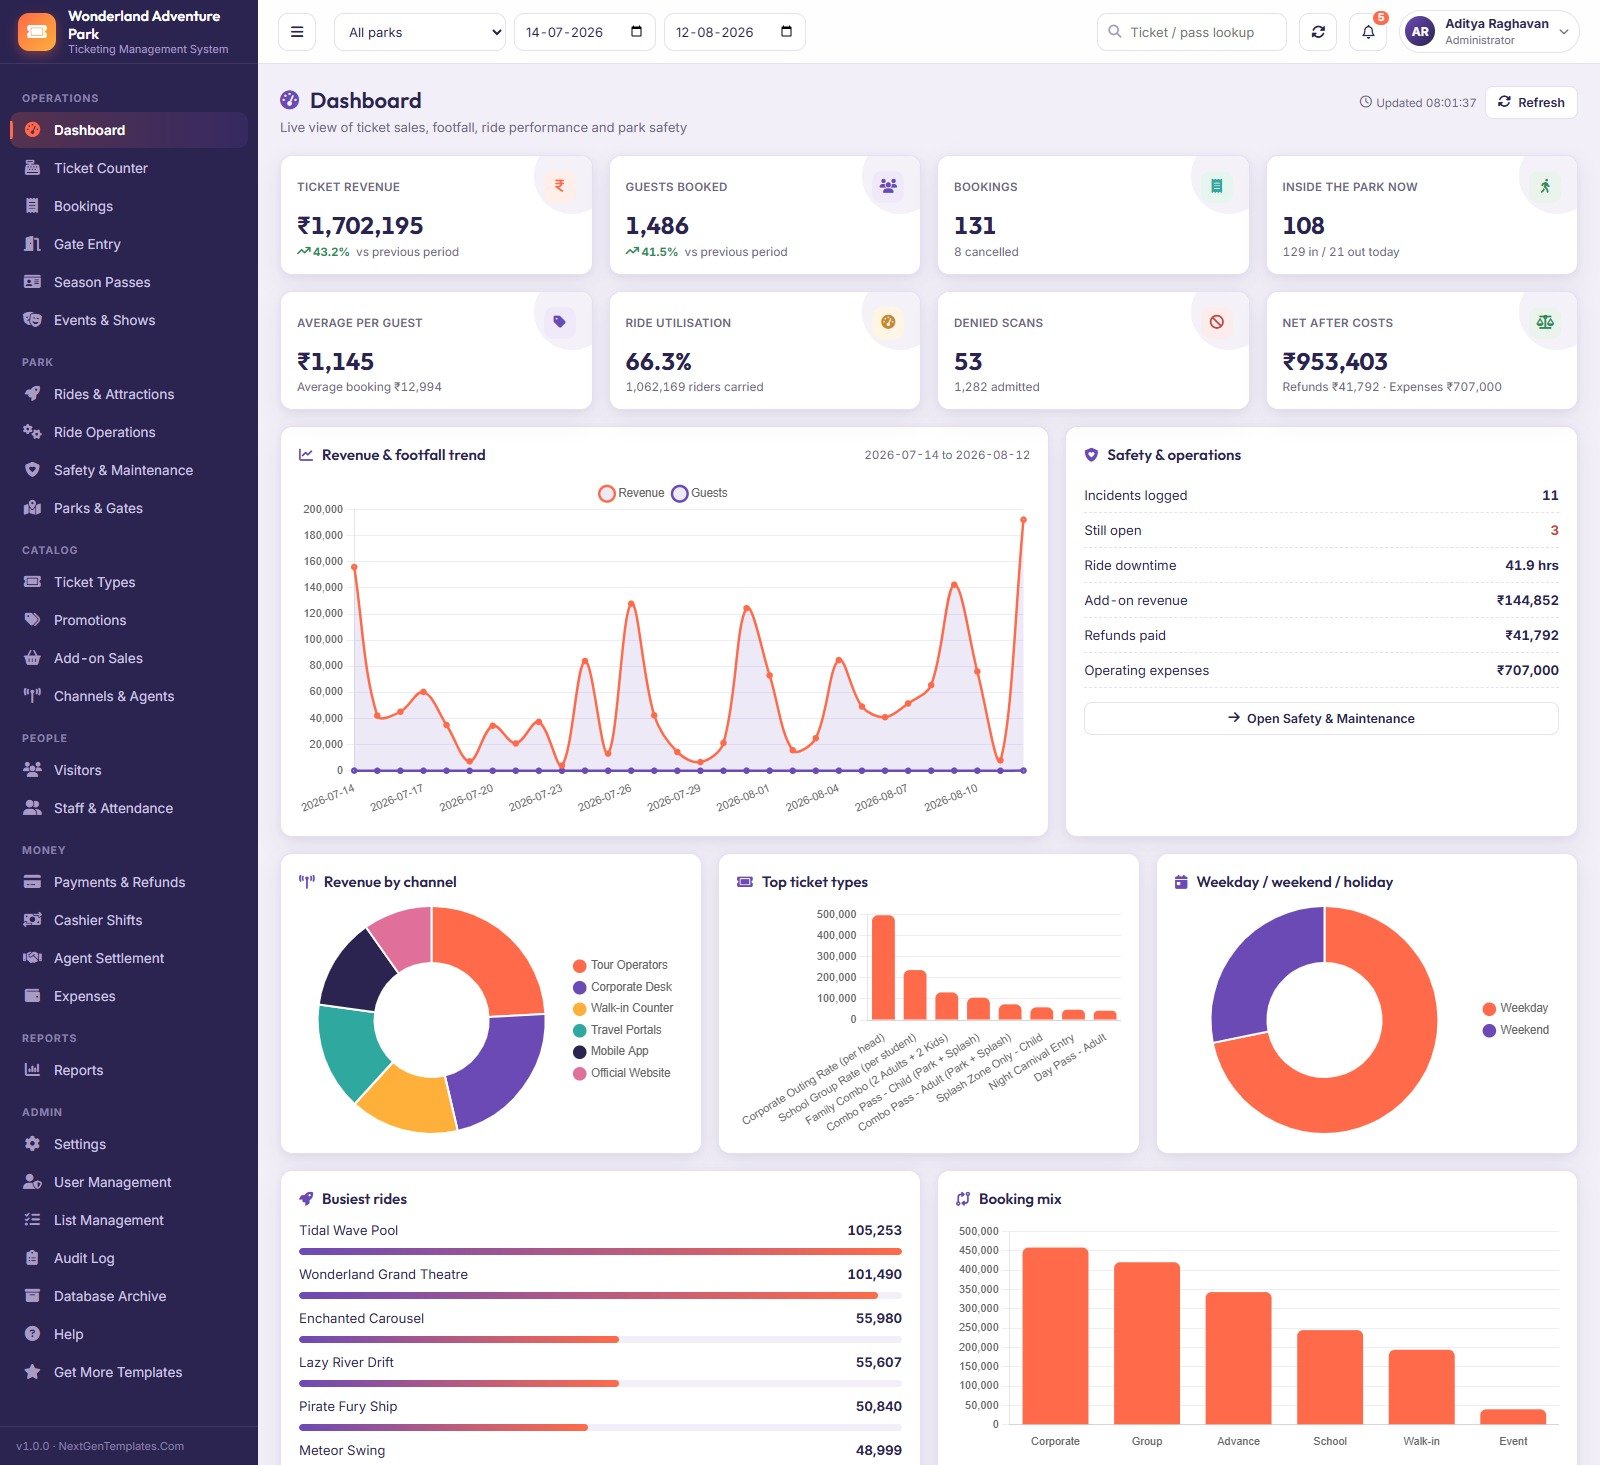
Eight KPI cards over whichever park and date range you set in the top bar: ticket revenue, guests booked, bookings (with cancellations called out), guests inside the park right now, average spend per guest, ride utilisation, denied scans and net after costs. Below them sit a revenue-and-footfall trend line, revenue by channel, top ticket types, a weekday / weekend split, busiest rides as ranked bars, and booking mix. A Safety and operations panel runs down the right: incidents logged, how many are still open, ride downtime in hours, add-on revenue, refunds paid and operating expenses.
Ticket Counter
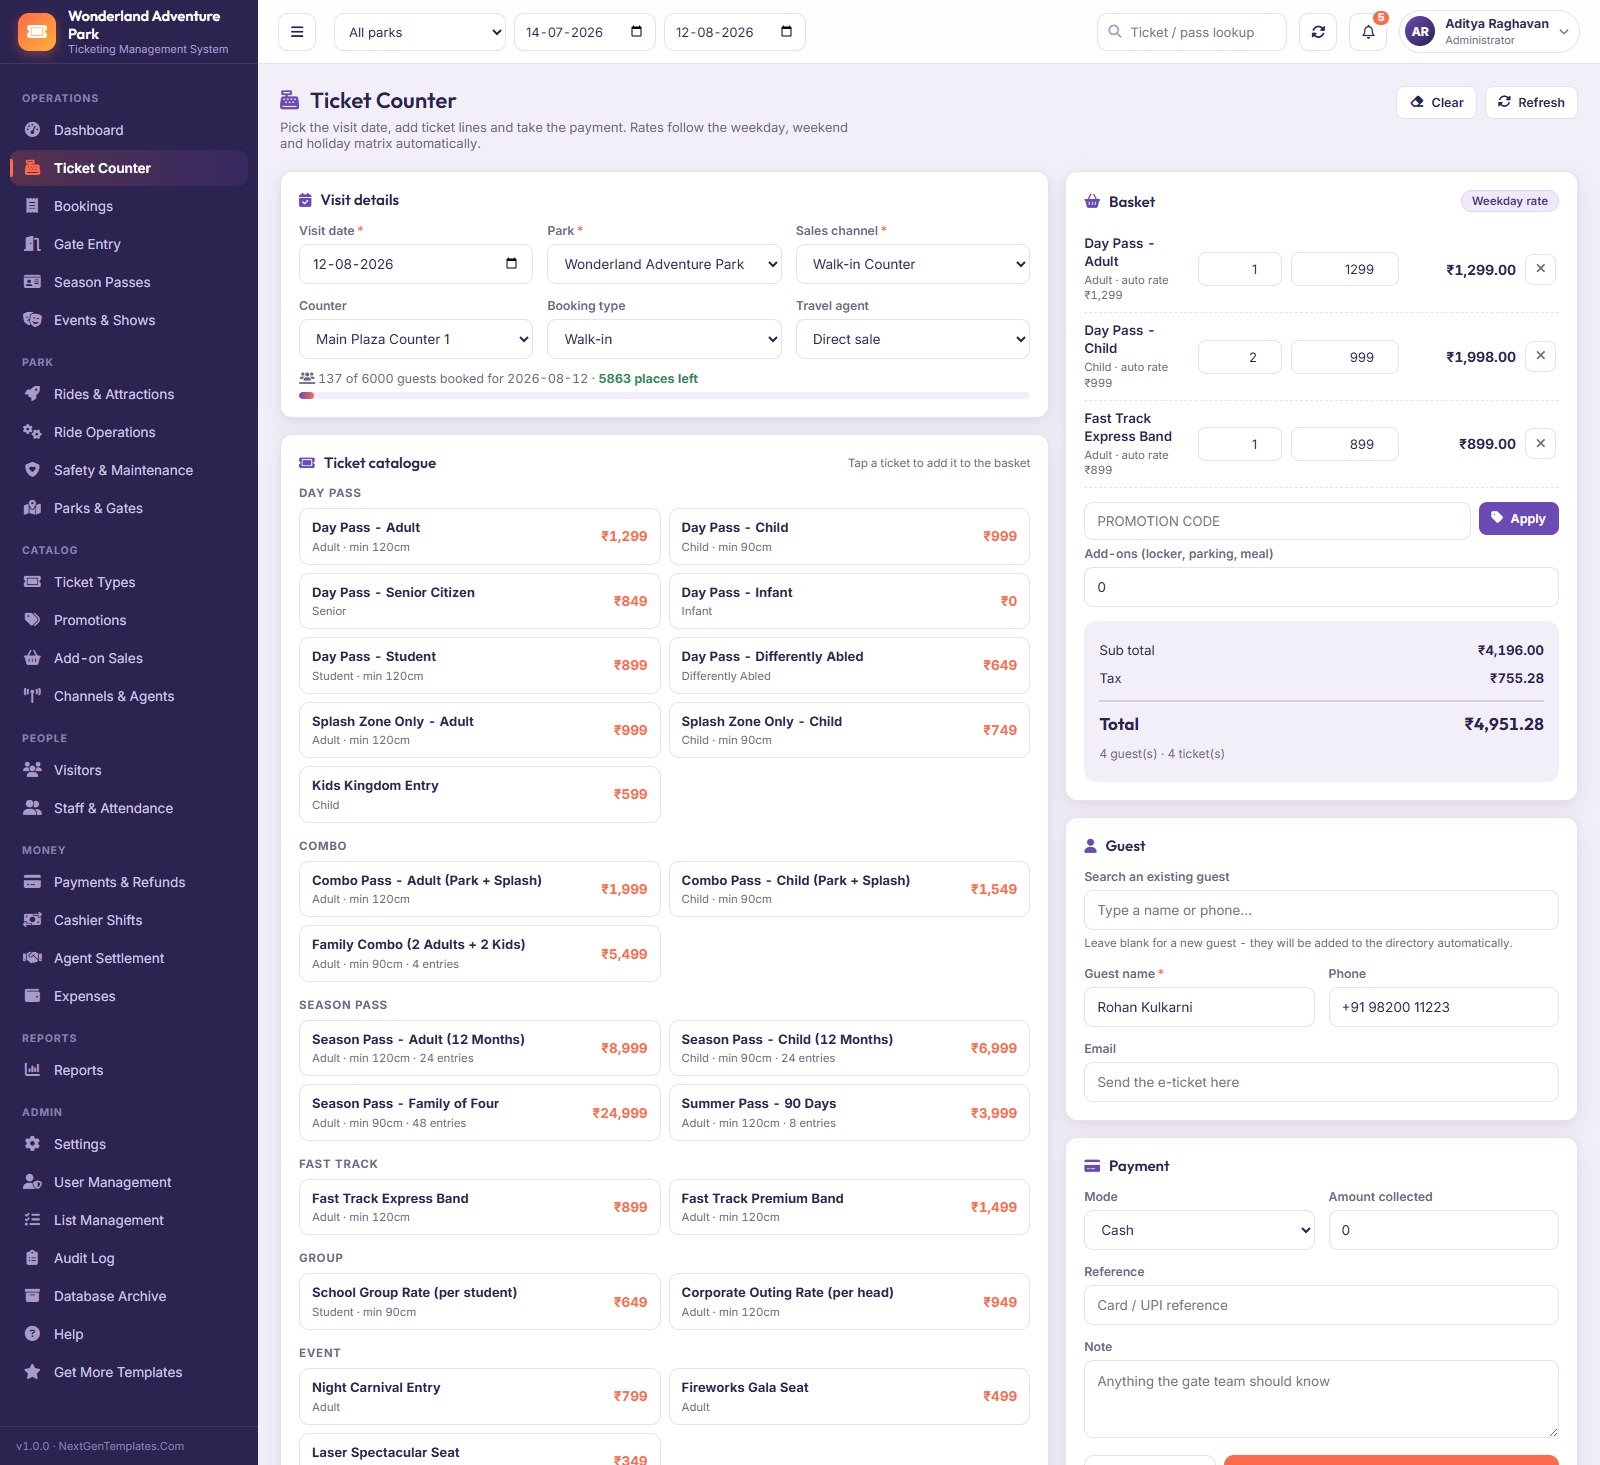
The selling screen, and the one your staff will live in. Set the visit date, park, sales channel, counter and booking type, then tap tickets from a catalogue grouped into Day Pass, Combo, Season Pass, Fast Track, Group and Event – 26 types in the seeded catalogue. A capacity strip reads 137 of 6000 guests booked – 5863 places left and stops an oversell. The basket shows quantity, unit rate, the band it used, promotion code, add-ons, sub total, tax and total, and the guest panel adds a new visitor to the directory automatically if they are not already there.
Bookings
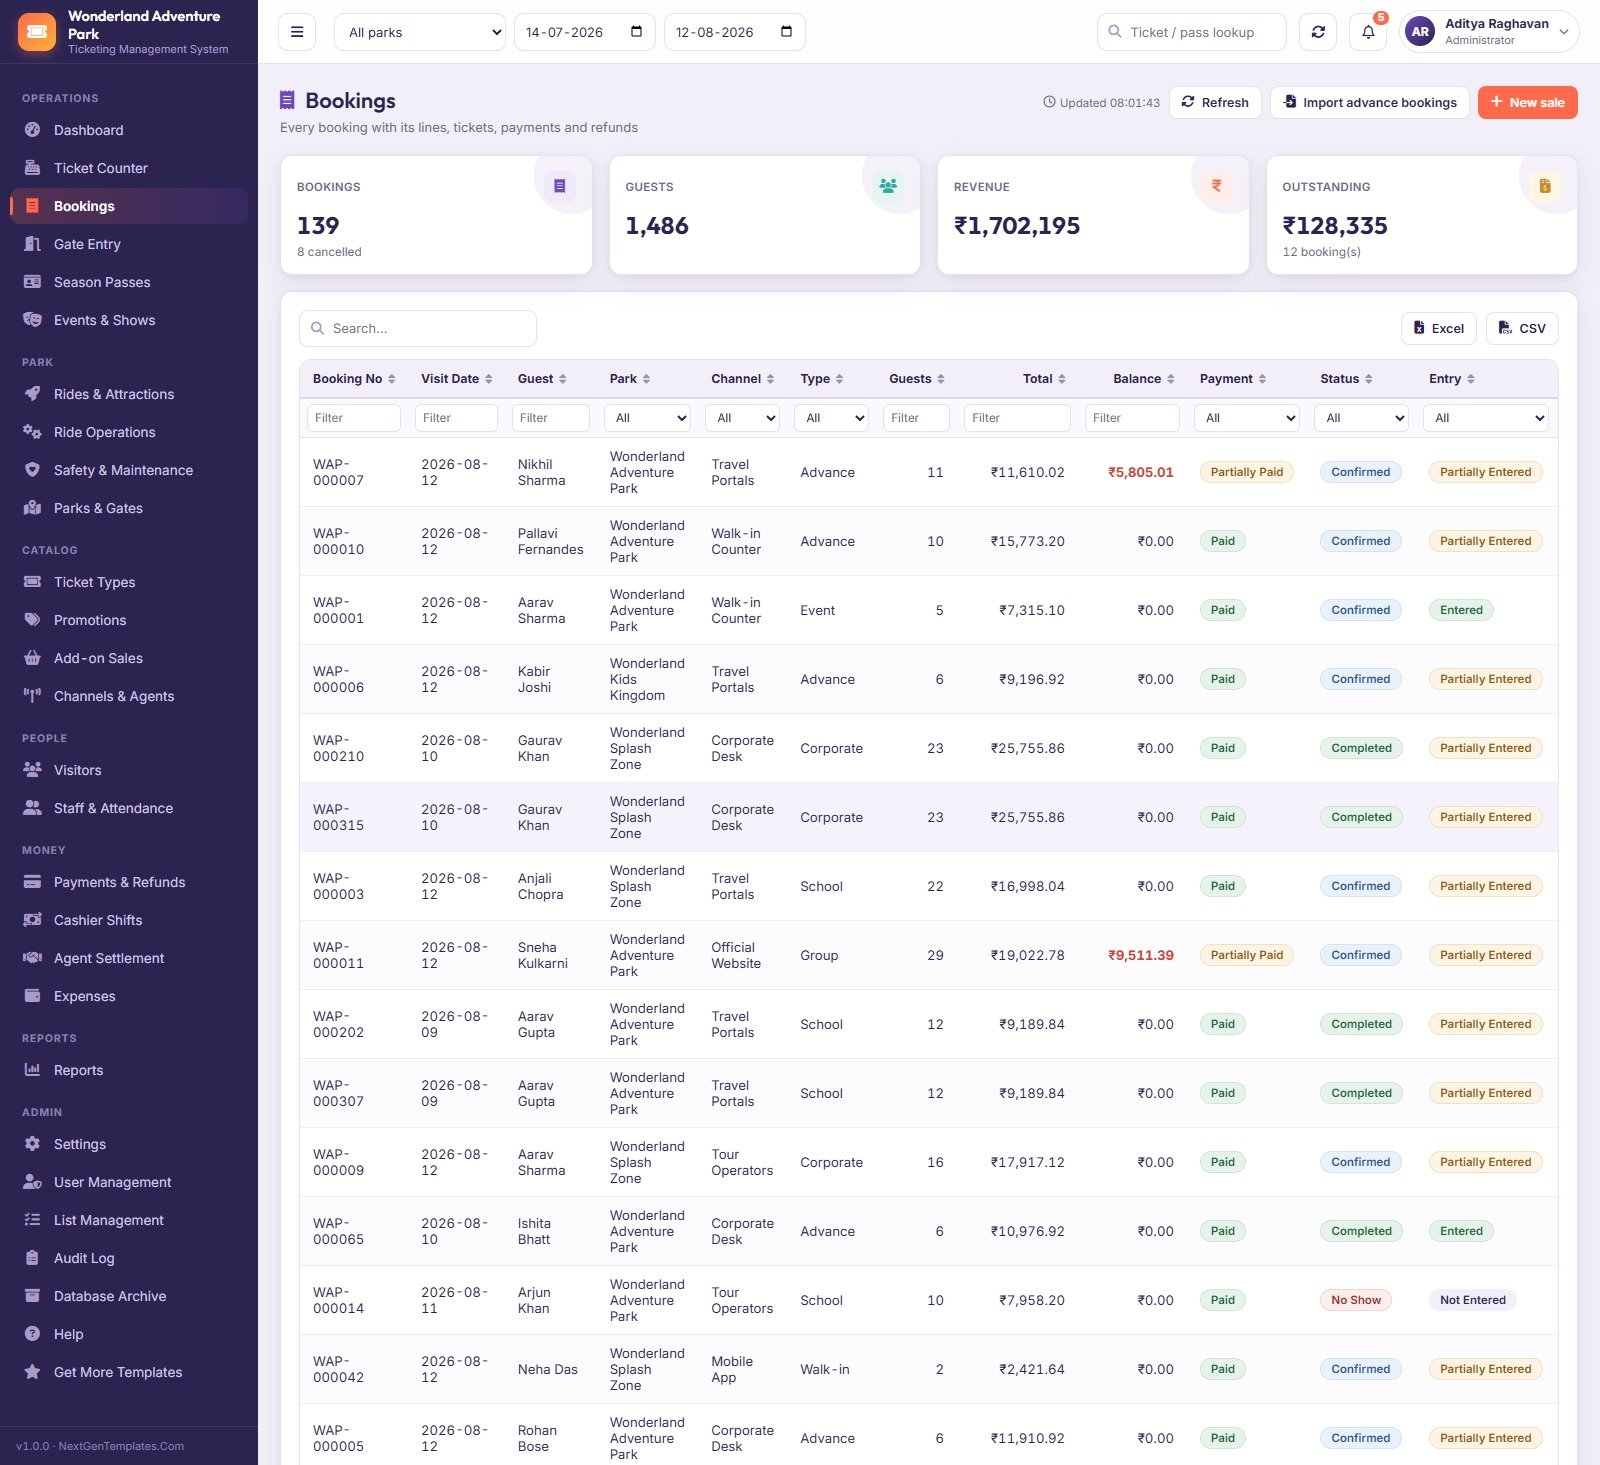
Every booking with its lines, issued tickets, payments, refunds and gate history. Filter by channel, booking type, payment state, status and entry state; cancel with a reason; import advance bookings; export the grid to Excel or CSV. Outstanding balances render in red – the demo carries 128,335 outstanding across 12 bookings – and the Entry column moves from Not Entered through Partially Entered to Entered as the gate scans people in.
Gate Entry
Designed for someone standing at a turnstile with a scanner. Pick the gate and the direction, scan or type the code, and the verdict panel answers immediately. A barcode scanner that ends with Enter works with no configuration, and F3 returns focus to the scanner from anywhere in the app. The recent-scans table logs time, ticket or pass number, gate, direction, result, reason and operator.
Season Passes
Issue, renew, block, unblock and print passes. Each row shows holder, phone, pass type, validity window, an entries-used progress bar, price and a status of Active, Blocked, Exhausted or Expired. The header tracks passes issued, active passes, how many expire in the next 30 days, and total pass revenue.
Rides & Attractions and Ride Operations
Rides & Attractions is the master register: code, park, category, thrill level, riders per cycle, height and age restrictions, riders carried, utilisation percentage, next inspection date and operational status. Ride Operations is the daily log behind it – one row per ride per shift with cycles run, riders carried, fast-track riders and downtime in minutes with a reason such as Mechanical, Safety Check or Staff Shortage. The demo holds 547 sessions, 40,454 cycles and 41.9 hours of downtime across 62 affected sessions.
Safety & Maintenance
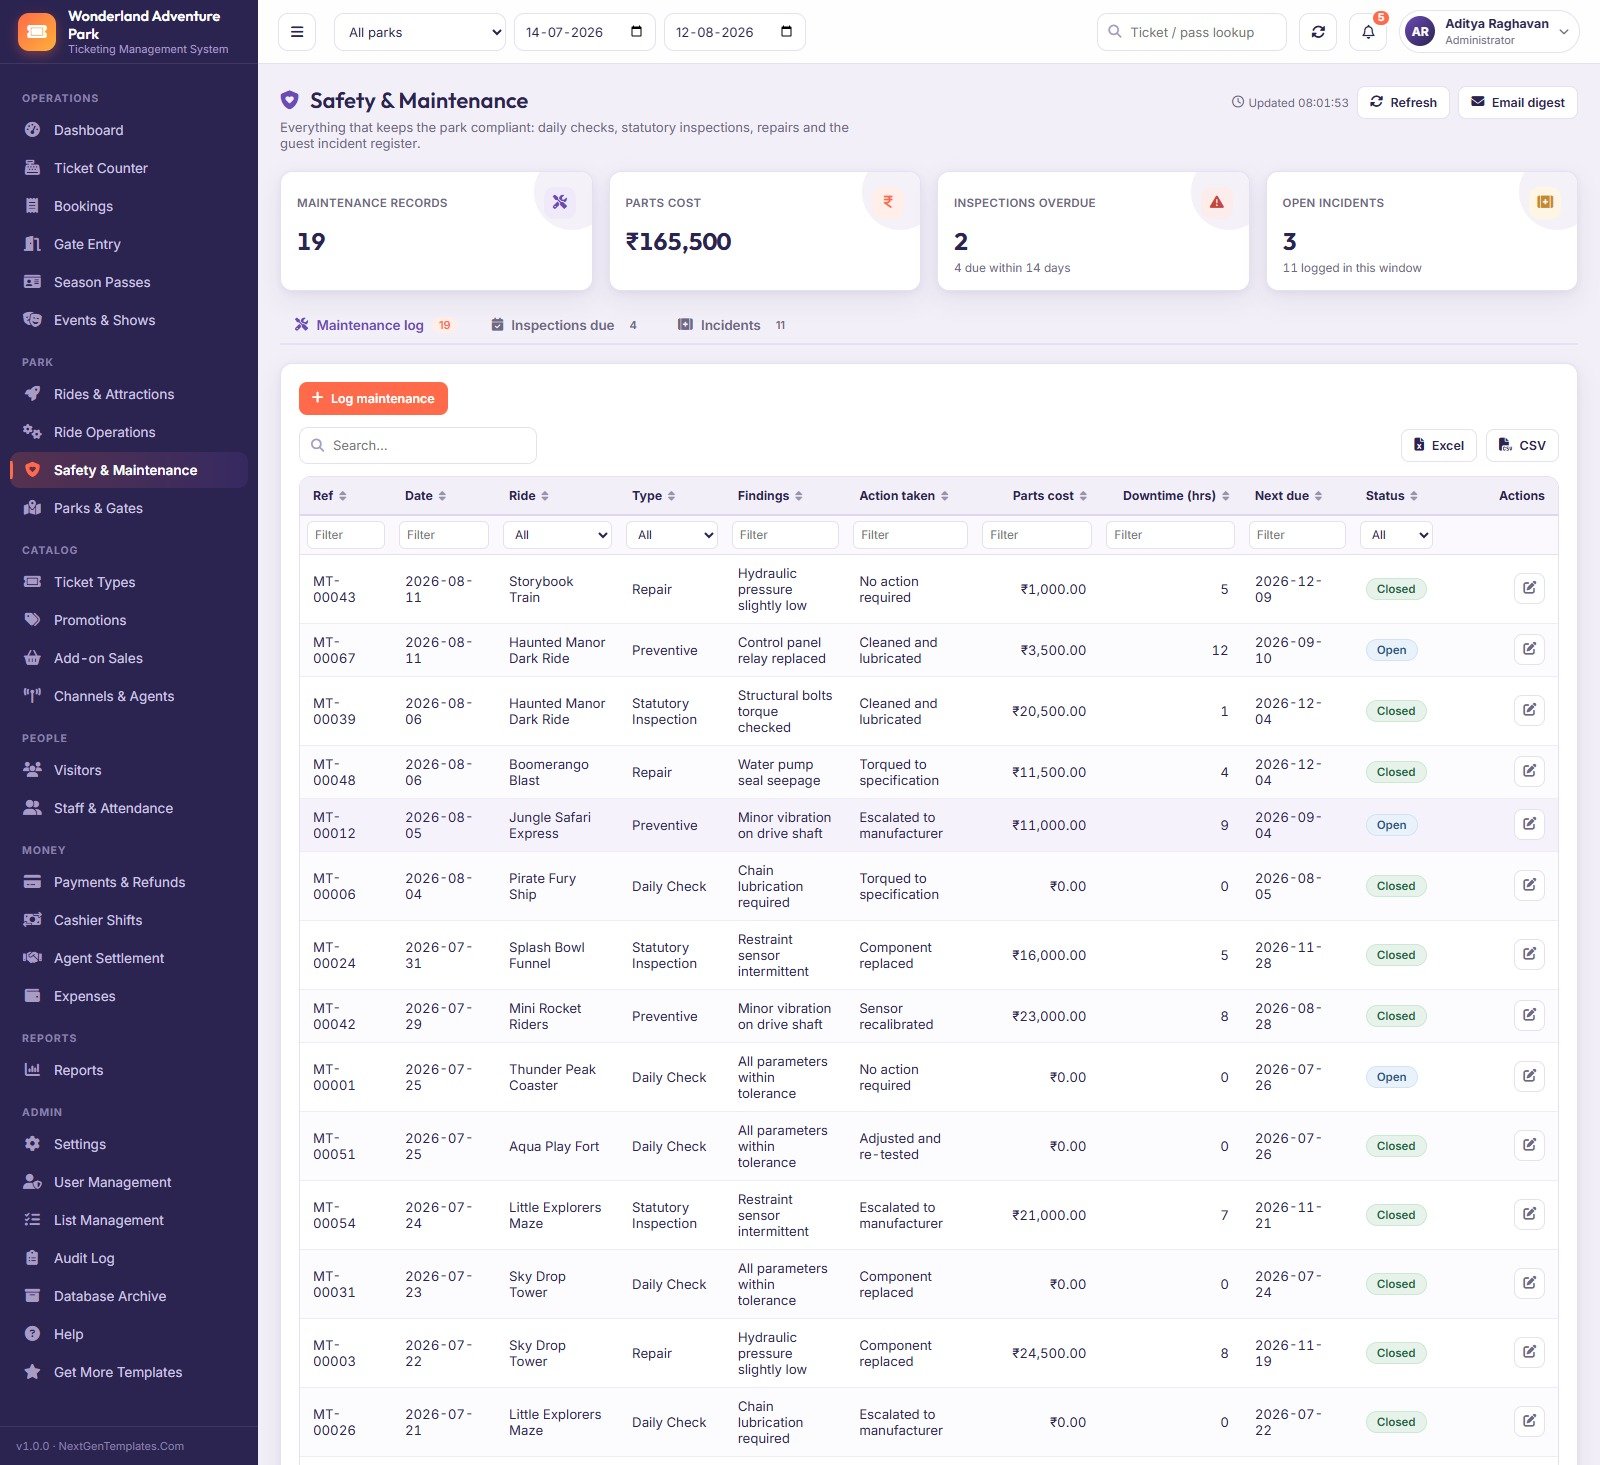
Three registers behind one screen: the maintenance log (findings, action taken, parts cost, downtime hours, next due date, open or closed), inspections due, and the guest incident register. The header counts maintenance records, parts cost, overdue inspections with how many fall due within 14 days, and open incidents. An Email digest button pushes the summary to whoever needs it.
Reports
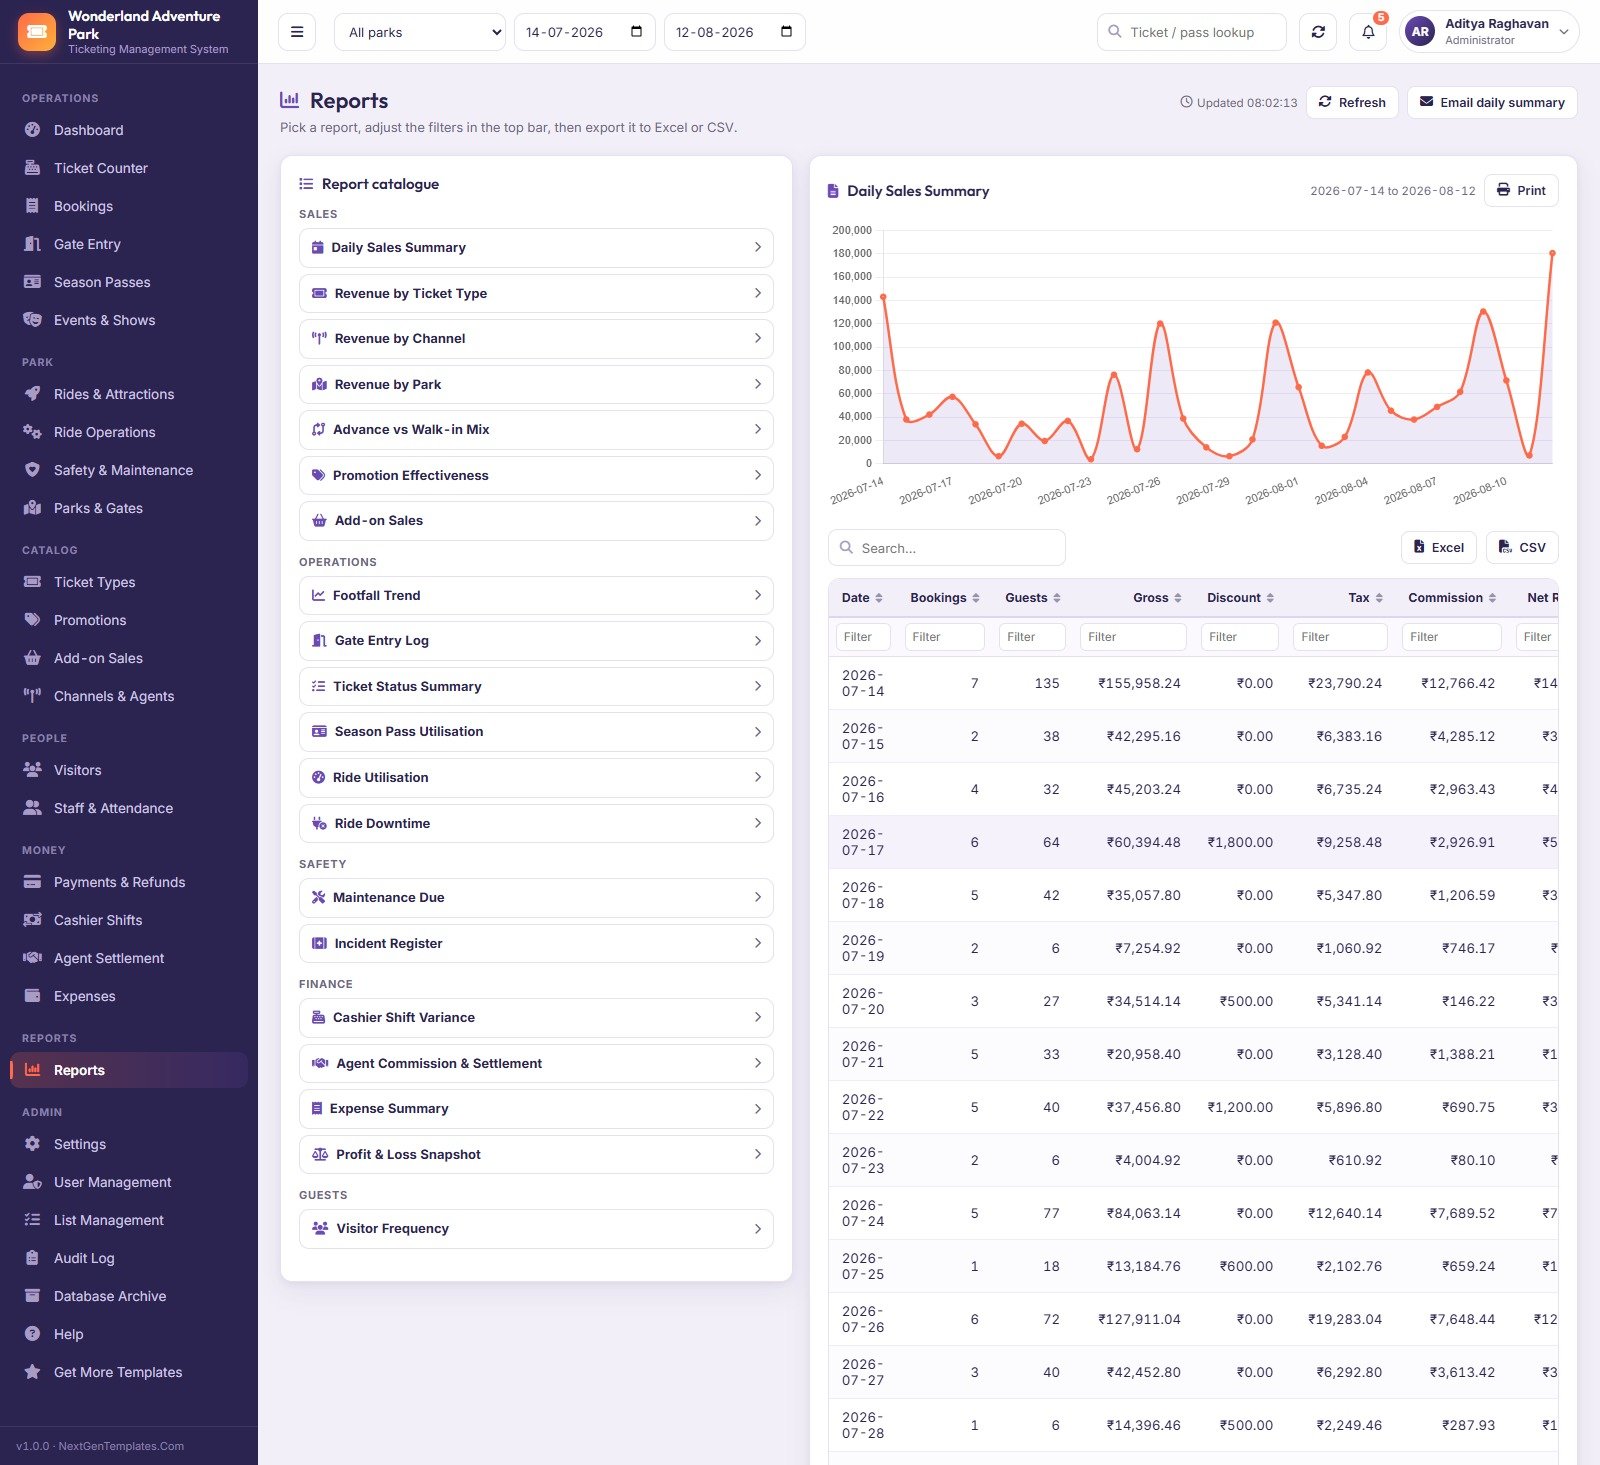
Twenty reports, catalogued down the left, results and a chart on the right, everything obeying the park and date range in the top bar. Sales: Daily Sales Summary, Revenue by Ticket Type, Revenue by Channel, Revenue by Park, Advance vs Walk-in Mix, Promotion Effectiveness, Add-on Sales. Operations: Footfall Trend, Gate Entry Log, Ticket Status Summary, Season Pass Utilisation, Ride Utilisation, Ride Downtime. Safety: Maintenance Due, Incident Register. Finance: Cashier Shift Variance, Agent Commission & Settlement, Expense Summary, Profit & Loss Snapshot. Guests: Visitor Frequency. Each one prints or exports to Excel or CSV.
Settings
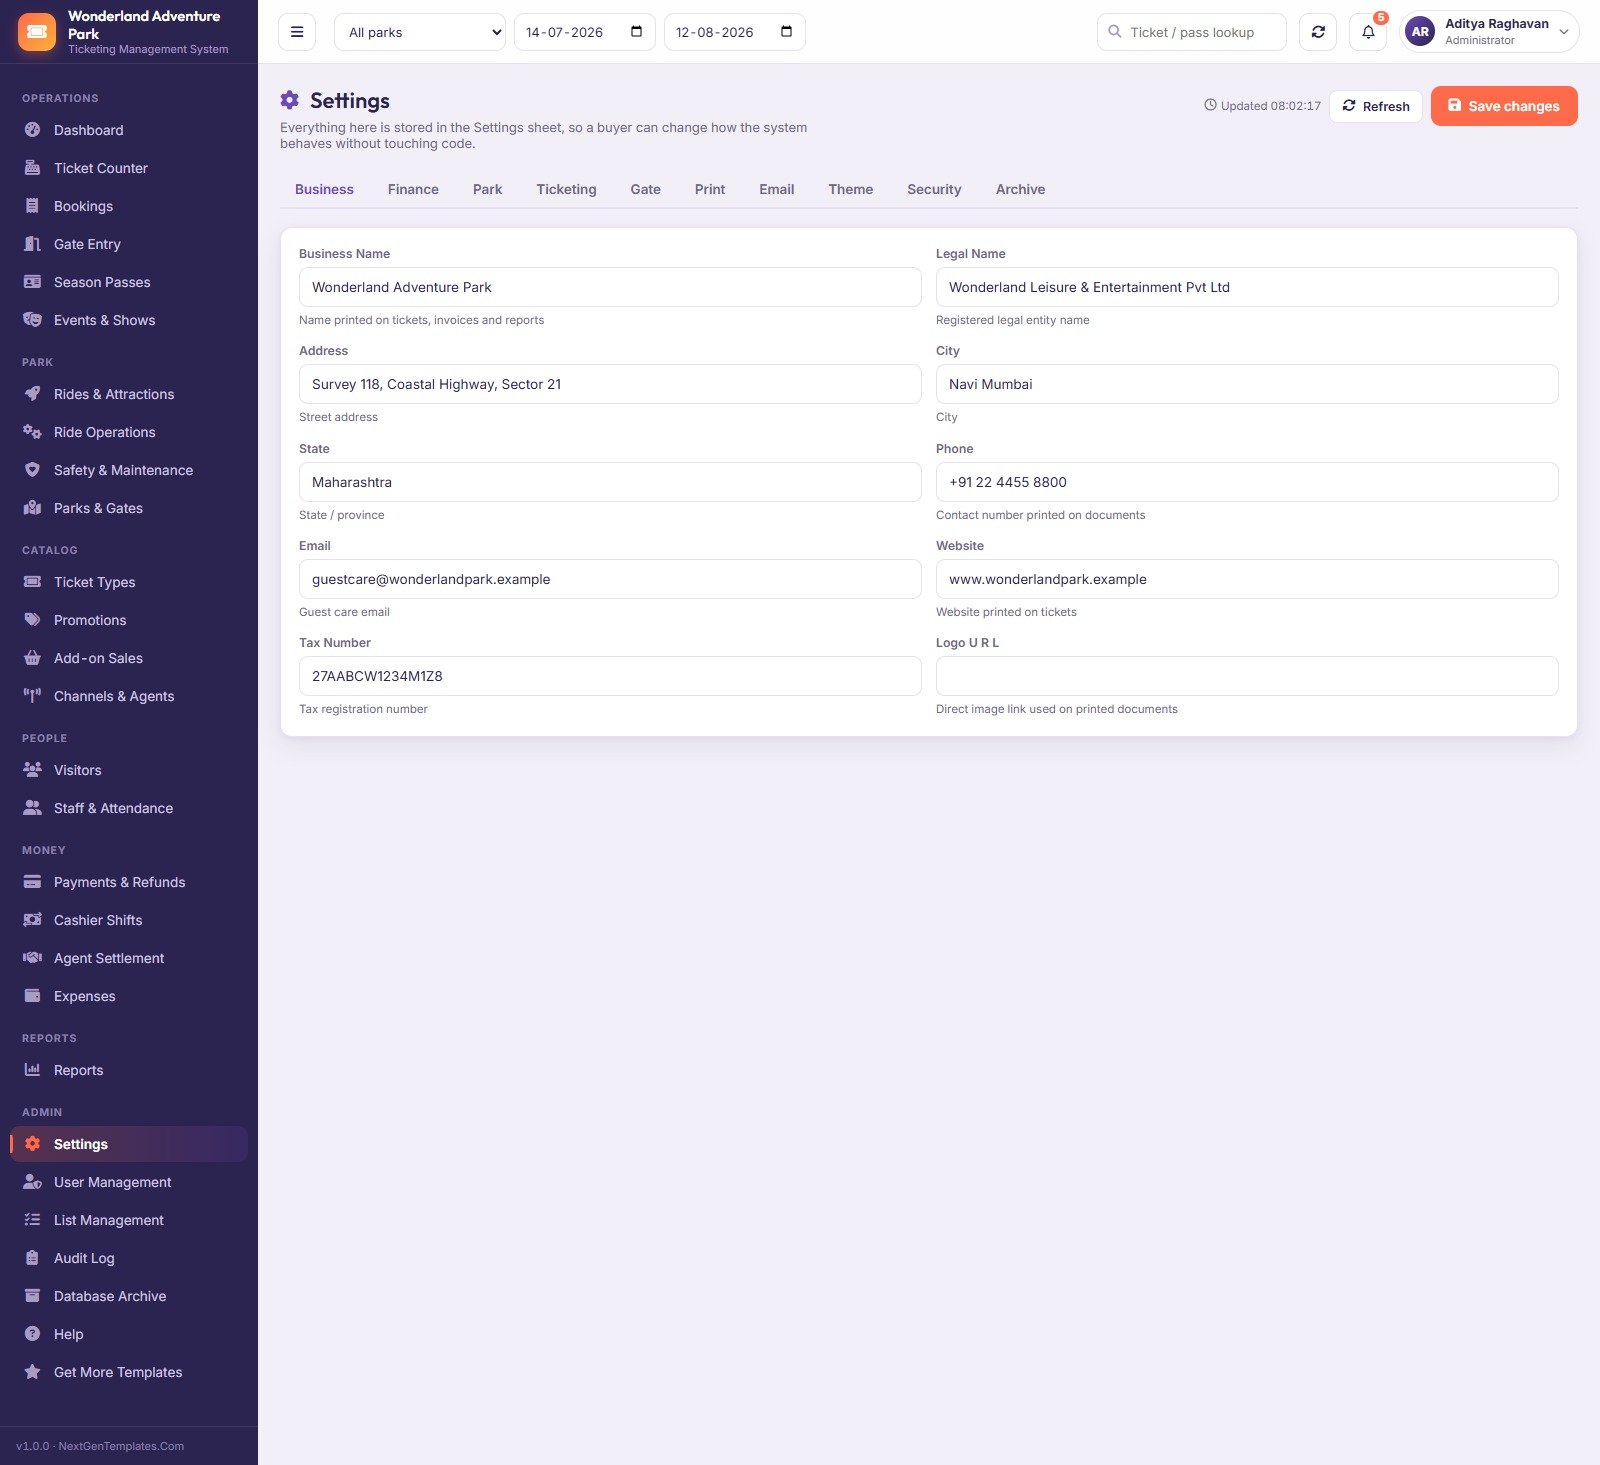
Ten tabs – Business, Finance, Park, Ticketing, Gate, Print, Email, Theme, Security and Archive – storing 51 settings in the Settings sheet. Business profile and logo for printed tickets, currency and tax, capacity mode, ticket print sizes, session timeout and the failed-login lockout threshold all live here, which is why rebranding the system needs no code at all.
The remaining screens
Events & Shows schedules parades, stunt shows, fireworks and seasonal festivals with their own seat capacity, sold count, fill percentage and performer. Parks & Gates holds the physical structure – 3 parks with daily capacities of 6000, 3200 and 1800, plus 8 gates, 6 themed zones and 6 selling counters. Ticket Types is the pricing matrix itself. Promotions stores percent or flat codes with a minimum spend, a discount cap, a validity window, a channel restriction and a usage limit the server enforces. Add-on Sales covers lockers, parking, meals, merchandise, photos, rentals and cabanas. Channels & Agents sets commission and settlement cycles per channel. Visitors is the guest directory with visit count, lifetime spend and tags such as VIP, Frequent, Lapsed and Season Pass Holder. Staff & Attendance holds 30 staff plus a month attendance grid you mark in a single save. Payments & Refunds splits into receipts, outstanding balances and refunds awaiting approval. Cashier Shifts, Agent Settlement and Expenses close the money loop. User Management, List Management, Audit Log, Database Archive and Help make up the admin block.
Web App vs. a Google Sheets Tracker vs. Paid Ticketing SaaS – Feature Comparison
| This Web App | A Google Sheets tracker | Paid ticketing SaaS | |
|---|---|---|---|
| Cost | One payment, yours to keep | Free to cheap | Per-ticket fee or monthly seat pricing |
| Platform | Google Apps Script over Google Sheets | Google Sheets | Vendor cloud |
| Setup time | About 15 minutes, guided | Minutes | Days to weeks, often with onboarding |
| Real-time team collaboration | Yes – concurrent users, per-role menus | Yes, but everyone sees everything | Yes |
| Mobile access | Yes – responsive browser app | Sheets app, awkward for selling | Yes, usually a native app |
| Customizable fields | Yes – Settings, 198 list values, plus the source code | Yes | Only what the vendor exposes |
| Share with link | Yes – your own /exec URL | Yes | Vendor-hosted URL |
| Year-1 cost at 5 users | The purchase price, once | Effectively nothing | Commonly four figures plus per-ticket commission |
| Gate scanning with a verdict | Yes, with reason codes and an entry log | No | Yes |
| Cash drawer variance | Yes – recomputed from real payments | Manual | Usually yes |
| Who owns the data | You – it is a spreadsheet in your Drive | You | The vendor |
Who Should Use This Template
It suits small and mid-size amusement parks, water parks, kids’ play and trampoline zones, adventure parks, zoos and aquariums, museums and heritage sites, and fairs or carnivals – anywhere you sell dated admission, scan people through a gate, run attractions on a rota and reconcile a drawer at closing. It suits an operator running all of that on scattered spreadsheets who wants one console with proper roles. It also suits an Apps Script developer who would rather start from 22 finished screens than a blank editor.
It does not suit you if you need card processing inside the app – this records how a payment was taken, it does not take the card – or if you expect it to drive physical turnstile hardware out of the box. It performs no statutory ride certification, issues no government e-invoices, and makes no safety, insurance or regulatory compliance claim. And a park selling millions of tickets a month has outgrown Google Sheets as a database; be honest with yourself about volume before you buy.
Real-World Use Cases
A three-gate water park fixes its rate leakage. Weekend admission is 300 higher than weekday and counters kept charging the wrong band. With the rate matrix deciding, the mistake disappears – and Advance vs Walk-in Mix then showed that the corporate desk was 23% of guests but 40% of unpaid balances, which moved that channel to prepaid.
A ticket officer handles a school-group morning. Twenty-two students on one booking at the school rate, one scan code per head. The capacity strip prevents an oversell, and the gate team admits students one at a time while the booking’s entry status walks itself from Not Entered to Entered.
An accountant closes the month. Their role blocks them from editing operational records at all, but they approve the refund queue, export Cashier Shift Variance to find the short drawers, roll agent commission up per agent and mark it paid, then pull the Profit & Loss Snapshot with expenses already netted off.
Advantages of the Amusement Park Ticketing Management System Web App
- You own the data and the code. The database is a spreadsheet in your own Drive; the source ships with the download. No licence key, no phone-home, no expiry.
- Permissions are real. A denied module cannot be reached by calling the backend directly – the map is enforced server-side, not just in the menu.
- Passwords are stored properly. Salted SHA-256 digests with a per-user salt, computed with
Utilities.computeDigest. Plain passwords are never written to the spreadsheet and never returned to the browser. - Setup survives Google’s limits. The seeding routine works in stages, saves its place, reports progress and reschedules itself, so the 6-minute script cap on a free Gmail account cannot break the build.
- The demo data reconciles. Booking totals equal the sum of their lines, tickets equal the pax on the booking, entries used never exceed the allowance, settlements equal commission on their bookings. It is a genuine training dataset, not filler.
- Archiving is safe by design. A full copy goes to Drive before anything is removed, and only closed transactions past your cutoff move. Open bookings, unpaid balances and every master table stay live.
Opportunities for Improvement
Being straight about the edges, because you will find them anyway:
- No payment gateway. Payment mode, amount and reference are recorded so the drawer reconciles; the actual card capture happens on your existing terminal.
- No hardware integration. It validates codes you scan into it and it works beautifully with a keyboard-wedge barcode scanner, but it does not open a physical barrier or talk to a turnstile controller.
- Google Sheets is the ceiling. Around 13,000 seeded rows is comfortable and the Archive screen exists to keep it that way, but this is not a high-volume transactional database.
- Currency and locale are demo-set. The seeded data is Indian-rupee, Navi-Mumbai flavoured. Currency, tax and the business profile are all Settings fields, but you will want to change them before your first day.
- Reports are fixed, not a report builder. Twenty reports cover the usual ground and each one exports, but there is no drag-and-drop query designer. Custom reports are a code change – which is fine, since you have the code.
Best Practices
- Sign into the demo as
gatefirst. If the most restricted role still shows you what you need, the permission model is right for your park. - Change all five passwords before anything else, then clear the seeded transactional sheets. Reseed Demo Data brings the samples back whenever you want a training environment.
- Get Parks & Gates and Ticket Types right on day one. Every other screen depends on them; retro-fitting a price matrix after you have sold live tickets is unpleasant.
- Close shifts daily, not weekly. The variance number is only useful while somebody still remembers the day.
- Deploy a new version after every code change. Apps Script serves the last deployed version, not your editor – use Deploy > Manage deployments > Edit > Version: New version. Google documents the deployment model in the official Apps Script web apps guide.
- Archive once a season rather than never. The backup copy runs first, so there is no risk in it.
Explore Relevant Templates
- Adventure Sports Booking Management System Web App – the nearest sibling, built around slot bookings, waivers and instructor rosters.
- Airport Transfer Management System Web App – if you run or contract guest shuttles.
- Hospital Management System Web App – the largest system in the range, if you want to see how far the pattern scales.
- Transportation Services Dashboard in Google Sheets – a lighter, reporting-only take on movement and capacity.
Curious how systems like this are put together? The NextGenTemplates Academy learning paths build the underlying spreadsheet skills step by step, using practice files.
Get the Amusement Park Ticketing Management System Web App
Frequently Asked Questions
Can I try it before buying?
Yes – the green box above is a live deployment with the full seeded database, and all five logins work. Use it exactly as a buyer would. It resets periodically, so treat anything you enter there as temporary.
Do I need to know how to code?
No. Deployment is copy, paste, save and deploy, roughly 15 minutes with the included guide, and there is a step-by-step deployment video. Everyday changes – currency, tax, print sizes, dropdown values, role permissions – are all screens.
Does it process card payments?
No. It records the payment mode, amount and reference so the cash drawer reconciles. It is not a payment gateway and it is not PCI-certified.
Will it make my park compliant with ride safety regulations?
No. It is a record-keeping tool that stores inspection dates, maintenance findings, downtime and incidents in one place. It performs no certification, grants no statutory approval and satisfies no specific safety standard on your behalf.
How many users can it handle?
It ships with 5 seeded users across 5 roles and you can add as many as you need; the practical limit is Google’s own quota on your account rather than the app. Sessions time out after 60 minutes of inactivity by default, configurable in Settings > Security.
Can I rebrand it?
Yes. Settings > Business sets the name, address, contact details and the logo URL printed on tickets and reports, and Settings > Theme changes the look. Because the source is included, deeper restyling is possible – and NextGenTemplates will do it for you on request.
What is actually in the download?
A ZIP containing Code.cs.txt (the complete Apps Script backend), Index.txt (the entire front end) and the printed user manual as a PDF.
About the Author
Built by PK – Microsoft Certified Professional with 15+ years of Excel, Google Sheets, and Power BI experience. Founder of NextGenTemplates, reaching 300K+ subscribers across YouTube channels. Every template is hand-built and tested before release.
Conclusion
A park ticketing system earns its keep in the small refusals: the wrong rate it will not charge, the oversold day it will not accept, the denied scan it explains, the short drawer it names. The Amusement Park Ticketing Management System Web App puts all of that behind one login, on infrastructure you already have, with the source code in your hands and no per-ticket commission going anywhere. Start with the live demo – sign in as gate, then as admin, and see the difference in ten seconds. If it fits, get the Amusement Park Ticketing Management System Web App on NextGenTemplates and deploy your own private instance today.