Solar installation performance rarely depends on one number. A team can sign more contracts while cycle time rises, cost per watt misses target, or first-time inspection results weaken. The Solar Panel Installation KPI Scorecard in Google Sheets puts 10 commercial and operating measures into one compact monthly view. Each card shows actual performance, target, change, status, and a twelve-month mini chart. A separate trend page compares actual, target, and prior year for MTD and YTD. The template is a reporting tool for prepared figures, not a CRM, engineering model, safety system, or compliance record.
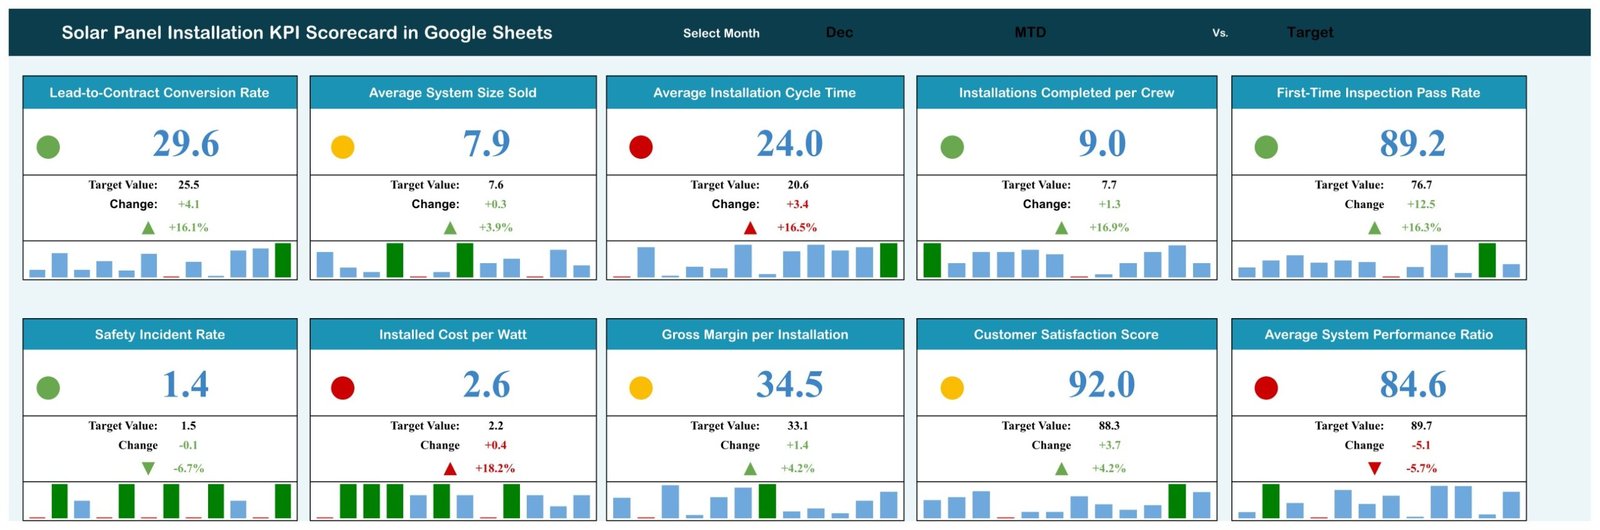
Ten solar installation KPI cards for the selected month
Key Features of Solar Panel Installation KPI Scorecard in Google Sheets
The scorecard is organized for a monthly management discussion. Select a month, scan status across ten cards, then open the trend page when a metric needs context. The definition and data areas make the source logic visible instead of hiding it inside a subscription platform.
- 10 ready-made KPIs spanning sales, installation operations, quality, safety, finance, customer experience, and system performance.
- Actual versus target with absolute change, percentage change, and a colored status indicator.
- Month selector for January through December.
- Twelve-month mini charts inside every KPI card.
- MTD and YTD trend charts comparing actual, target, and previous-year values.
- Direction-aware scoring for both upper-the-better and lower-the-better metrics.
- Definition control for KPI group, name, unit, formula, meaning, and type.
- Transparent input structure for monthly MTD and YTD actual, target, and prior-year figures.
Scorecard Pages Explained
Main KPI Scorecard
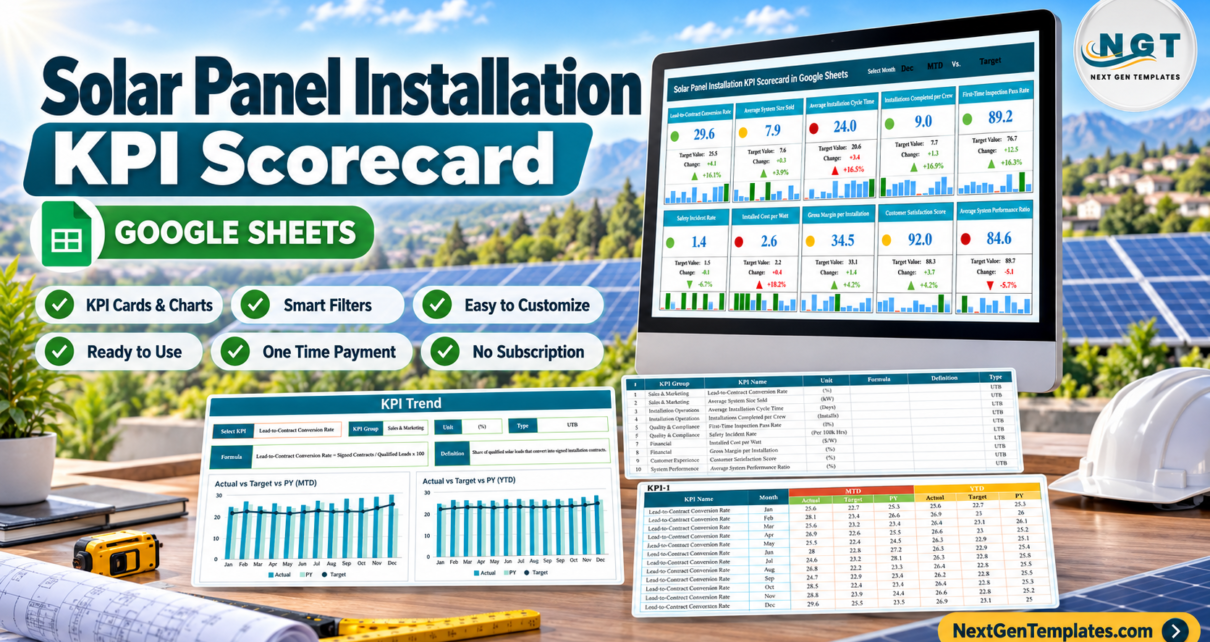
The main page presents two rows of five cards. In the demonstration December view, Lead-to-Contract Conversion Rate is 29.6 against a target of 25.5; Average Installation Cycle Time is 24.0 days against 20.6; Installed Cost per Watt is 2.6 against 2.2; and Average System Performance Ratio is 84.6 against 89.7. Those examples show why the scorecard separates upper-the-better from lower-the-better logic.
The full KPI set is Lead-to-Contract Conversion Rate, Average System Size Sold, Average Installation Cycle Time, Installations Completed per Crew, First-Time Inspection Pass Rate, Safety Incident Rate, Installed Cost per Watt, Gross Margin per Installation, Customer Satisfaction Score, and Average System Performance Ratio. These are editable sample definitions, not prescribed benchmarks or industry standards.
KPI Trend
The trend view focuses on one selected KPI. It displays the KPI group, unit, type, formula, and definition above two charts. The first chart compares monthly actual, previous year, and target for MTD. The second does the same for YTD. The sample selection is Lead-to-Contract Conversion Rate, defined as signed contracts divided by qualified leads, multiplied by 100.
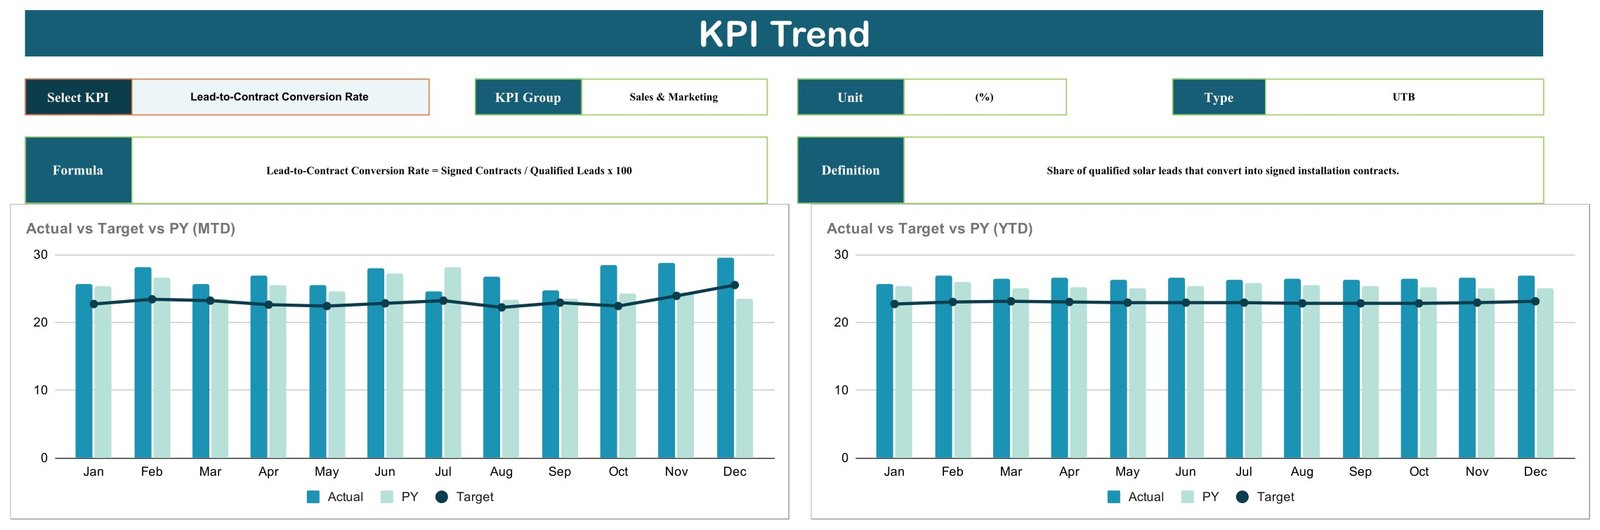
Selected-KPI trend against target and previous year
KPI Definition List
The definition table groups the ten metrics into Sales & Marketing, Installation Operations, Quality & Compliance, Financial, Customer Experience, and System Performance. Each row includes unit, formula text, definition, and whether the KPI is UTB or LTB. For example, installation cycle time, safety incident rate, and installed cost per watt are marked lower-the-better, while conversion, crew completion, margin, satisfaction, and performance ratio are upper-the-better.

Definition control for all ten metrics
Monthly KPI Data
The data area is arranged by KPI and month. Each section holds MTD actual, target, and prior year alongside YTD actual, target, and prior year. This structure feeds the cards and trend view. The figures shown in the screenshots are demonstration data and should be replaced with verified internal values.

Monthly actual, target, and prior-year inputs
Solar Panel Installation KPI Scorecard in Google Sheets vs. Excel vs. Paid Solar CRM – Feature Comparison
| Feature | Google Sheets scorecard | Excel alternative | Paid solar CRM or project platform |
|---|---|---|---|
| Pricing model | One-time $8.99 sale price | Usually one-time | Monthly or annual subscription |
| Platform | Browser or Google Sheets app | Microsoft Excel | Vendor web and mobile apps |
| Setup | Create a copy and replace sample values | Download and configure | Account setup and onboarding |
| Real-time collaboration | Native Google sharing | Depends on storage and version | Usually included |
| Formula transparency | Visible and editable | Visible and editable | Often vendor-controlled |
| Lead, design, permit, and project workflow | Not included | Not normally included | Often included |
| Live energy monitoring | Not included | Not normally included | May require a separate platform |
| Best use | Monthly KPI review | Desktop reporting | End-to-end operations |
Who Should Use This Template
Solar installation owners and general managers can use the scorecard as a compact operating review. Sales managers can watch conversion and average system size. Installation managers can balance cycle time and crew throughput. Quality and safety leads can maintain approved inspection and incident measures. Finance teams can review cost per watt and gross margin, while customer-experience teams can follow satisfaction.
It is best for teams that already produce reliable monthly totals. It is not designed for lead records, customer information, proposals, engineering design, permits, crew scheduling, inventory, accounting, field inspections, incident investigation, or automated energy production monitoring.
Real-World Use Cases
Asha, the installation director
Asha reviews cycle time and completed installations per crew together. If speed improves but first-time inspection performance weakens, she can investigate the operational cause rather than celebrating throughput alone.
Marco, the sales manager
Marco selects Lead-to-Contract Conversion Rate on the trend page and compares MTD and YTD patterns with targets and prior year. He can then examine lead qualification and contract processes in the source system.
Elena, the finance lead
Elena reviews installed cost per watt and gross margin per installation with the formula definitions visible. That helps keep management reporting consistent when cost allocation rules change.
Advantages of This Google Sheets KPI Scorecard
The compact card layout makes exceptions visible quickly. Direction-aware logic prevents a lower cycle time or incident rate from being scored like revenue. MTD and YTD trend views reduce the risk of treating a one-month event as a long-term pattern. Because definitions and monthly values remain visible in Google Sheets, managers can audit the reporting structure and collaborate without another per-user subscription.
Opportunities for Improvement
A customized version could add branch, crew, market, or project-type breakdowns; import approved summaries from another spreadsheet; or include a data-quality checklist. Automated CRM, permit, accounting, safety, or monitoring integrations would require additional development. The scorecard also does not store explanatory commentary, so teams may want a separate action log for owners, causes, due dates, and follow-up decisions.
Best Practices
- Approve definitions first: document numerator, denominator, unit, owner, data source, frequency, and UTB/LTB direction.
- Use controlled targets: replace sample targets with values approved by the responsible manager.
- Close each reporting month: establish when inputs are final and who verifies them.
- Protect formula areas: test structural changes in a spare copy and restrict edit access where appropriate.
- Manage sharing: follow Google’s guidance for sharing files from Google Drive and apply suitable permissions.
- Keep source records: do not use a summary KPI as a substitute for inspection, safety, engineering, financial, or regulatory documentation.
Explore Relevant Templates
For a broader energy view, compare the Solar Energy KPI Scorecard in Google Sheets and its step-by-step article. The Renewable Resource KPI Dashboard adds a dashboard-style analysis layer. Project teams may prefer the Solar Project Construction Dashboard. Desktop and BI teams can also consider the Solar Energy Dashboard in Excel or Power BI edition.
Frequently Asked Questions
How many KPIs are included?
The demonstrated scorecard contains 10 KPIs across six business groups. Labels and definitions can be adapted carefully.
Is this the same as a KPI dashboard?
No. This is the compact KPI scorecard family. It focuses on cards, one selected-KPI trend view, definitions, and monthly data rather than the broader analysis pages of the KPI dashboard line.
Does it connect automatically to a solar CRM or inverter?
No. The scorecard uses values entered in its data structure. It has no built-in CRM, project-platform, inverter, telemetry, or accounting connection.
Can my team collaborate in real time?
Yes. Standard Google Sheets sharing supports simultaneous editing, subject to the permissions set by the file owner.
Does it prove inspection, safety, or code compliance?
No. First-Time Inspection Pass Rate and Safety Incident Rate are management summaries based on data you supply. The template does not determine AHJ approval, OSHA compliance, code conformity, engineering adequacy, or legal compliance.
What do I receive?
The product download is a PDF containing the link used to create your own editable Google Sheets copy.
About the Author
Built by PK – Microsoft Certified Professional with 15+ years of Excel, Google Sheets, and Power BI experience. Founder of NextGenTemplates, reaching 300K+ subscribers across YouTube channels. Every template is hand-built and tested before release.
Conclusion
The Solar Panel Installation KPI Scorecard in Google Sheets gives installation businesses a focused way to review ten commercial and operational measures without adding another subscription. Its value comes from disciplined definitions and verified inputs, not from replacing the systems that produce those facts. View the one-time-purchase scorecard, create your copy, and tailor the definitions to your approved process. For more spreadsheet tutorials, visit PK: An Excel Expert on YouTube.