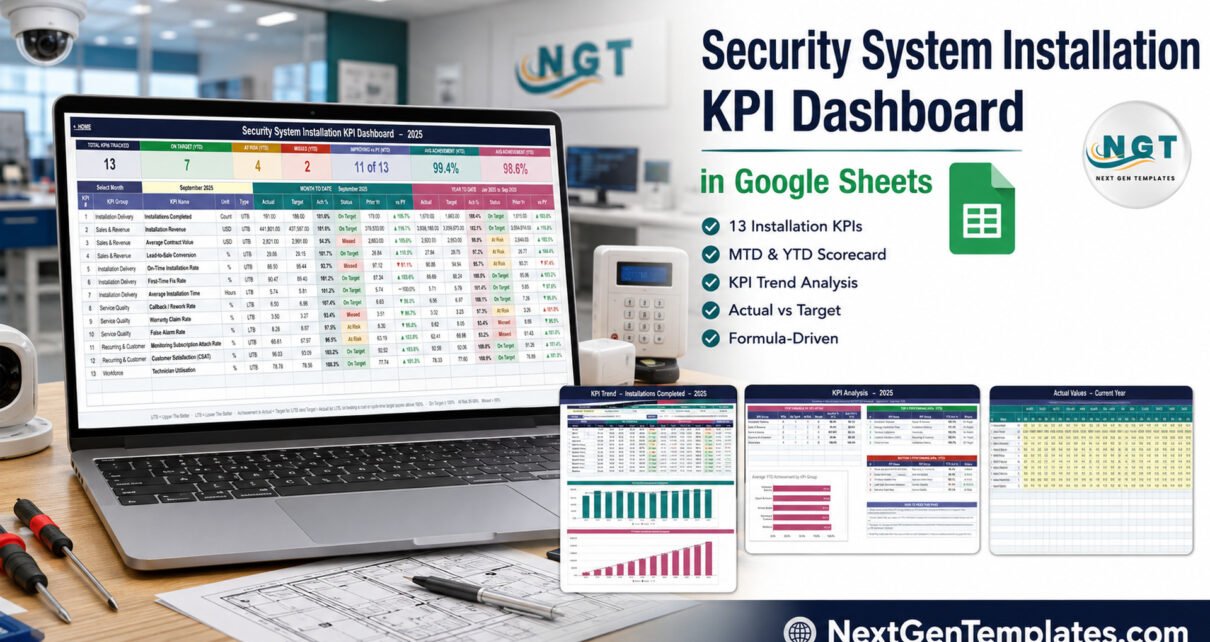
13 KPIs, 5 business groups, 12 monthly periods, and two reporting horizons are combined in the Security System Installation KPI Dashboard in Google Sheets. It turns monthly actual, target, and prior-year totals into an MTD and YTD management scorecard with traffic lights, trends, and ranked exceptions. For a CCTV, alarm, access-control, or integrated security installer, that means one repeatable monthly conversation instead of separate sales, delivery, callback, and technician spreadsheets.
This article walks through the real workbook, explains every supplied KPI, and makes the limitations clear. The security installation KPI template is a reporting layer: it does not schedule jobs, monitor alarms, hold customer credentials, or prove compliance.

Key Features of the Security System Installation KPI Dashboard in Google Sheets
- 13 security system installation KPIs across Installation Delivery, Sales & Revenue, Service Quality, Recurring & Customer, and Workforce.
- MTD and YTD views showing Actual, Target, Achievement %, Status, Prior Year, and comparison with Prior Year.
- Direction-aware formulas for 9 upper-the-better and 4 lower-the-better metrics.
- Three status bands: On Target from 100%, At Risk from 95% to 99%, and Missed below 95% in the supplied formulas.
- One month selector that drives the dashboard, KPI Trend, and KPI Analysis pages.
- Three monthly input tables for current-year actuals, targets, and prior-year values.
- Editable KPI definitions with formula, description, owner, priority, frequency, and UTB/LTB type.
- Browser-based collaboration using ordinary Google Drive permissions, with no add-on or Apps Script required.
Dashboard Pages Explanation
Home
The Home page is an index and a short operating guide. It confirms coverage of 13 KPIs, MTD plus YTD reporting, and formula-driven operation. Navigation is grouped into three reporting pages, three editable input sheets, and the KPI Definition, Read Me, and Get More Templates pages. Its three-step start sequence is simple: enter data, pick a month, and read the scorecard.
KPI Dashboard
The main page shows every KPI in a single grid. The supplied September 2025 example reports 7 On Target, 4 At Risk, and 2 Missed on YTD; 11 of 13 improving against prior year; 99.4% average MTD achievement; and 98.6% average YTD achievement. These figures are fictional sample data and should not be treated as industry standards.

Each row includes its group, name, unit, and scoring direction. For UTB metrics, achievement is Actual divided by Target. For LTB metrics, it is Target divided by Actual. That distinction matters: a faster installation or a lower callback rate should improve the score, not reduce it.
KPI Trend
Select one KPI and the page displays all 12 months of MTD and cumulative YTD Actual, Target, Prior Year, Achievement %, and Status. The screenshot uses Installations Completed and adds an MTD chart and a YTD chart underneath. The definition, formula, owner, priority, frequency, group, unit, and direction stay visible above the table, so the trend is not separated from its meaning.

KPI Analysis
This page rolls the 13 metrics into the five supplied groups, showing KPI count, On Target, At Risk, Missed, average MTD achievement, and average YTD achievement. It also ranks the top five and bottom five by YTD achievement. In the sample, Installation Revenue leads at 102.1%, while Monitoring Subscription Attach Rate sits at 93.2%. Again, these are demonstration values, not benchmarks.

KPI Input – Actual, Target, and PY
The three input sheets separate current-year actuals, monthly targets, and prior-year comparison values. The Actual screenshot shows yellow monthly cells and calculated YTD totals. Keeping inputs separate makes the calculation path easier to audit and reduces the temptation to overwrite the dashboard formulas.

KPI Definition
The definition table is the workbook’s master list. It contains KPI Number, Group, Name, Unit, Formula, Definition, Type, Owner, Priority, and Frequency. The supplied metrics are:
- Installations Completed
- Installation Revenue
- Average Contract Value
- Lead-to-Sale Conversion
- On-Time Installation Rate
- First-Time Fix Rate
- Average Installation Time
- Callback / Rework Rate
- Warranty Claim Rate
- False Alarm Rate
- Monitoring Subscription Attach Rate
- Customer Satisfaction (CSAT)
- Technician Utilisation

Security System Installation KPI Dashboard vs. Excel vs. Paid Field-Service Software – Feature Comparison
| Area | This Google Sheets KPI dashboard | Excel KPI workbook | Paid field-service platform |
|---|---|---|---|
| Price model | $8.99 sale price, one time | Template plus Microsoft 365 if needed | Recurring subscription |
| Setup | Make a copy and replace monthly totals | Download and edit locally | Configuration and onboarding |
| Team access | Google Drive sharing | Usually OneDrive or a shared file | Seat-based accounts |
| Custom KPI definitions | Editable in cells | Editable in the workbook | Varies by plan |
| Five-user year-one template cost | $8.99 total | Template plus licences | Usually hundreds or more |
| Live job records | No | No | Often yes |
| Scheduling and dispatch | No | No | Often yes |
| Best fit | Monthly management review from approved totals | Local/offline reporting | End-to-end operational workflow |
Who Should Use This Template
The workbook fits a security installation business that can assemble monthly totals but does not want another per-user reporting subscription. A company owner can see sales, delivery, service quality, recurring plans, and technician use on one page. An operations manager can review installation speed and completion quality. A sales director can separate revenue, contract value, and conversion. A quality manager can follow callbacks, warranty claims, and false alarms with lower-the-better logic.
It is not the right tool if you need job-level scheduling, dispatch, quoting, customer records, site surveys, monitoring-centre events, alarm response, camera footage, access credentials, inventory, invoicing, technician time capture, or automated integrations. It also does not certify work against licensing, electrical, fire or life-safety, privacy, insurer, or manufacturer requirements.
Real-World Use Cases
Monthly owner review
An owner can compare Installations Completed, Installation Revenue, and Average Contract Value before deciding whether a revenue gap comes from volume, deal size, or both.
Delivery and first-visit quality
An operations manager can pair On-Time Installation Rate with First-Time Fix Rate and Average Installation Time. That keeps speed from being judged without completion quality.
Post-installation service review
A quality manager can review Callback / Rework Rate, Warranty Claim Rate, and False Alarm Rate together. All three are marked lower-the-better, preventing an inverted traffic light.
Recurring revenue conversation
A sales or monitoring manager can compare Monitoring Subscription Attach Rate with Customer Satisfaction to understand whether recurring-plan adoption is moving alongside customer experience.
Advantages of the Security System Installation KPI Dashboard in Google Sheets
The biggest advantage is transparency. The formulas, direction flags, thresholds, and source inputs remain visible. The dashboard separates MTD from YTD, which reduces the risk of judging one weak month without context. Prior-year comparisons add another reference point without requiring a database. Because the file lives in Google Drive, selected colleagues can review the same copy; Google explains the available sharing roles and permissions.
The template is also intentionally narrow. It does not attempt to replace operational software. That makes it faster to understand for a team that already has approved monthly totals and only needs a consistent management view.
Opportunities for Improvement
Monthly values are entered manually, so teams with high transaction volumes may prefer an automated BI pipeline. The workbook reports aggregates rather than jobs, sites, customers, systems, or technicians. It does not preserve audit evidence beyond normal spreadsheet revision history. The status bands are shared formulas and should be reviewed before use; a 95% boundary is not automatically suitable for every metric. Currency is shown in USD in the supplied sample, so another currency requires formatting changes.
A future edition could add a structured import sheet, optional quarterly view, protected input ranges, or a data-validation check for missing months. Those are not claimed features in the current product.
Best Practices
- Agree each formula, owner, direction, and data source before replacing the sample data.
- Use approved aggregate totals and keep customer names, addresses, credentials, camera data, and incident details outside this workbook.
- Restrict edit access to the people maintaining inputs; give view access to review participants.
- Protect formula cells after customization and keep an untouched master copy.
- Review UTB/LTB direction whenever a KPI is renamed or replaced.
- Label commentary separately from the numeric source so explanations do not overwrite inputs.
- Replace all fictional values before presenting the dashboard as business performance.
Explore Relevant Templates
- Security System Installation KPI Scorecard in Google Sheets – a separate card-based format for the same trade.
- CCTV Installation KPI Scorecard in Google Sheets – a focused CCTV scorecard.
- Fire Safety Services KPI Dashboard in Google Sheets – another service-operations KPI dashboard.
- Elevator Maintenance KPI Dashboard in Google Sheets – a maintenance-service KPI example.
- Glass Installation KPI Dashboard in Google Sheets – another installation-trade dashboard.
Frequently Asked Questions
Is this the KPI Dashboard or KPI Scorecard?
This is the KPI Dashboard: it includes a month-driven MTD/YTD grid, Trend page, Analysis page, and three monthly input sheets. The scorecard linked above is a separate product and not included.
Can I edit the KPI list?
Yes. Use KPI Definition as the master register and keep names consistent across the input tables. Test the dashboard after changing any formula or direction flag.
How are lower-is-better metrics scored?
For LTB rows, achievement is Target divided by Actual. Average Installation Time, Callback / Rework Rate, Warranty Claim Rate, and False Alarm Rate are the four supplied LTB metrics.
Does it connect to my CRM, monitoring, or job system?
No. The workbook has no API or live integration. Approved monthly totals are entered manually.
Does it store customer or security-system data?
Not in the supplied design. It contains aggregate KPI values, not names, addresses, device identifiers, credentials, footage, alarm events, or incident records.
Are the sample numbers real benchmarks?
No. They are fictional data used to demonstrate formulas, traffic lights, and charts.
Does an On Target result prove compliance?
No. It is an internal management status only, not certification, inspection, audit evidence, or regulatory advice.
About the Author
Built by PK – Microsoft Certified Professional with 15+ years of Excel, Google Sheets, and Power BI experience. Founder of NextGenTemplates, reaching 300K+ subscribers across YouTube channels. Every template is hand-built and tested before release.
Conclusion
The Security System Installation KPI Dashboard in Google Sheets gives installation businesses a focused monthly review of 13 metrics without pretending to be operational or compliance software. If your team already has approved totals and wants visible formulas, MTD/YTD context, direction-aware traffic lights, trends, and ranked exceptions, it is a practical reporting layer.
View the Security System Installation KPI Dashboard in Google Sheets on NextGenTemplates. For more spreadsheet tutorials, visit PK: An Excel Expert on YouTube.
Last updated: September 11, 2026.