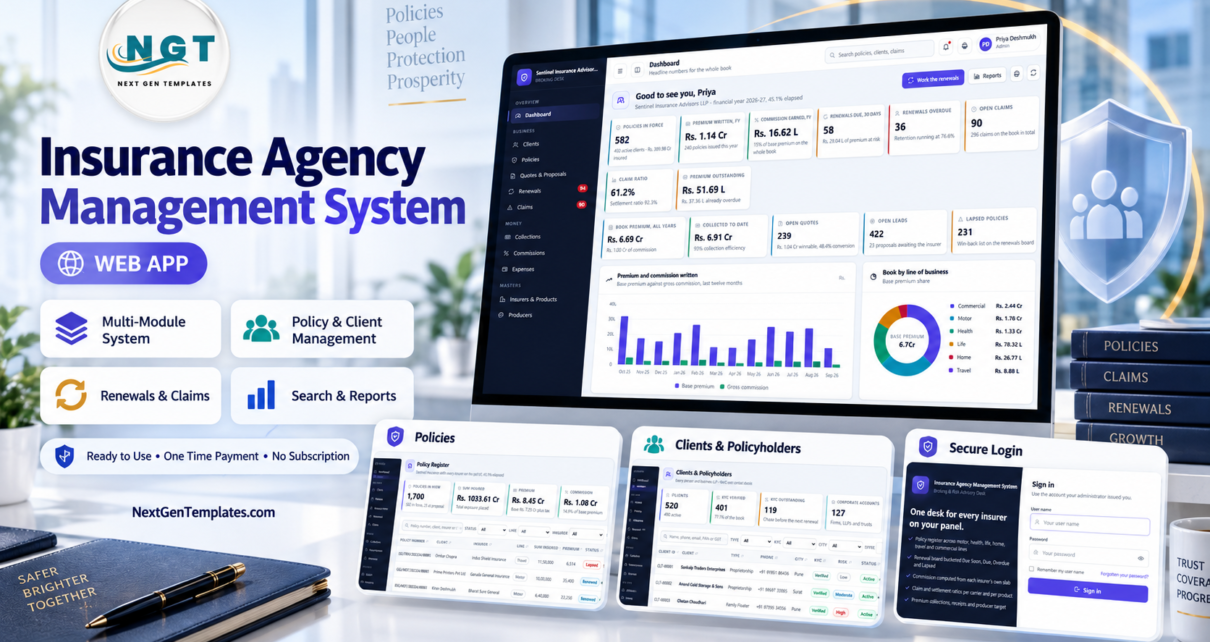
An insurance agency runs on four clocks at once. One counts down to each policy’s expiry, one tracks each open claim, one follows premium instalments, and one follows the commission each insurer still owes. Most small brokerages keep those clocks in four different spreadsheets and a WhatsApp group. The Insurance Agency Management System Web App is an insurance agency management system built on Google Apps Script that puts all four on one screen. This walkthrough covers every module of the shipped build, including the parts that are less flattering.
Everything shown is the demonstration dataset: a fictional Pune brokerage called Sentinel Insurance Advisors LLP, with 14 fictional carriers, 520 clients, 1,700 policies and 11,777 rows in all. Every name, phone number, licence number and registration code in it is fictional sample data.
Try the Live Demo
This is a real deployment of the same build, seeded with fictional demonstration data. Sign in with any of the accounts below.
Demo sign-in details: all eight seeded accounts
| Role | Username | Password | Reaches |
|---|---|---|---|
| Admin | admin |
Admin#2026 |
Everything, incl. users, settings, audit log, archive |
| Manager | manager |
Manager#2026 |
The whole business, no user admin or settings |
| Operations | ops |
Ops#2026 |
Servicing desk: clients, KYC, policies, quotes, renewals |
| Claims Officer | claims |
Claims#2026 |
Claims only, with read access to policy and client |
| Accounts | accounts |
Accounts#2026 |
Collections, commissions, expenses, reports |
| Agent | agent |
Agent#2026 |
Own book only |
| Agent | agent2 |
Agent#2026 |
Own book only, a different producer |
| Viewer | viewer |
Viewer#2026 |
Read only across the business |
These logins are public deliberately. The demo is a shared instance with fictional sample data that resets. It is not a customer’s system, and your own copy builds a private database in your own Google Drive.
What the insurance agency management system dashboard tells you
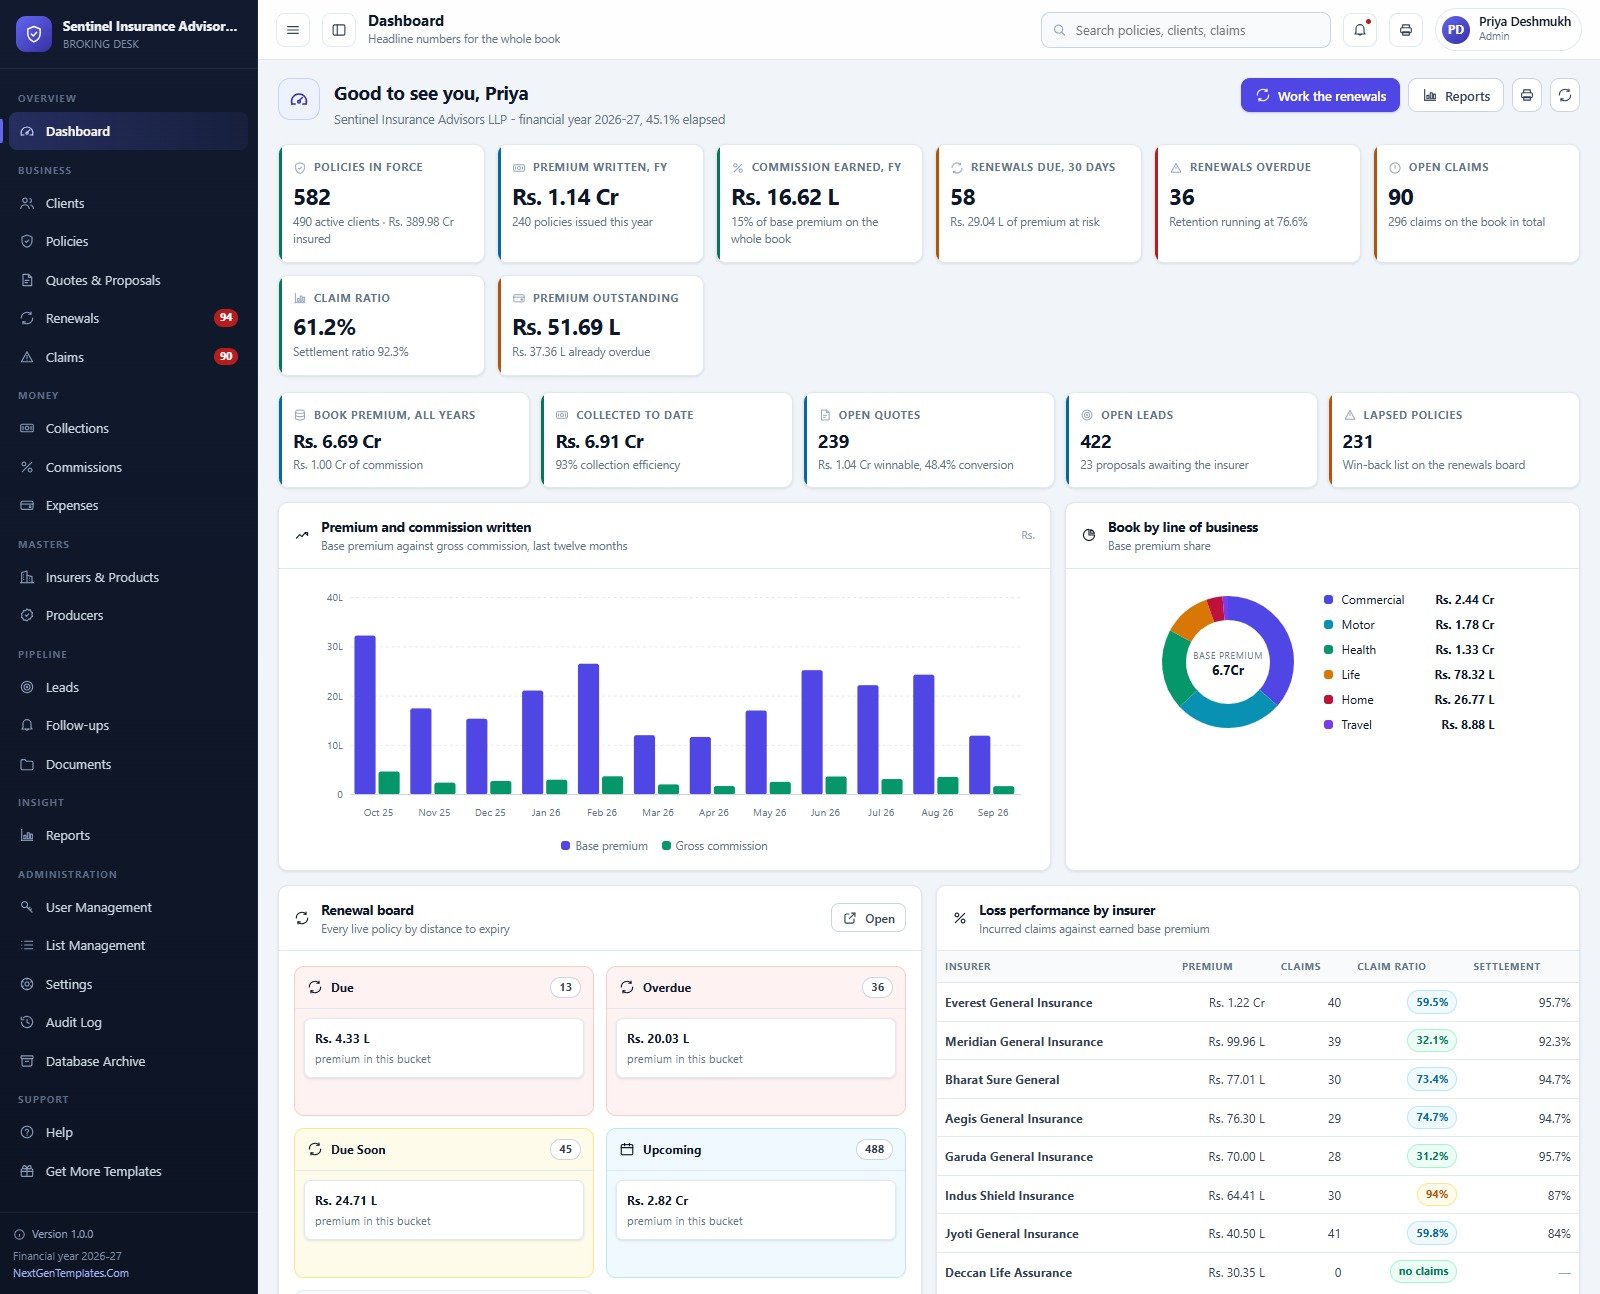
The dashboard greets the signed-in user and states how far the financial year has run: 45.1% elapsed in the demo. The first row of cards is the conversation a principal officer has every Monday. It shows 582 policies in force, Rs. 1.14 Cr of premium written this financial year from 240 new policies, and Rs. 16.62 L of commission earned. It also shows 58 renewals due within 30 days with Rs. 29.04 L of premium at risk, 36 renewals overdue, and 90 open claims out of 296 on the book. A second row adds the claim ratio (61.2%, with a 92.3% settlement ratio) and Rs. 51.69 L of premium outstanding, of which Rs. 37.36 L is already overdue.
Below that come book premium for all years, collected to date with a 93% collection efficiency, 239 open quotes, 422 open leads and 231 lapsed policies, which doubles as a win-back list. A twelve-month chart plots base premium against gross commission. A donut splits the book across Commercial, Motor, Health, Life, Home and Travel. The loss-performance-by-insurer table shows premium, claim count, claim ratio and settlement ratio for each carrier, and that is the table to bring to a renewal negotiation with an insurer.
Clients, policies and quotes
The Clients screen holds every person and business the agency covers: individuals, family floaters, proprietorships, partnerships, private limited firms, LLPs and trusts. Each record carries KYC status (Verified, Pending or Rejected), a risk band, live policy count and lifetime premium. In the demo, 401 of 520 clients are KYC verified and 119 are outstanding, with the card reminding the desk to chase them before the next renewal.
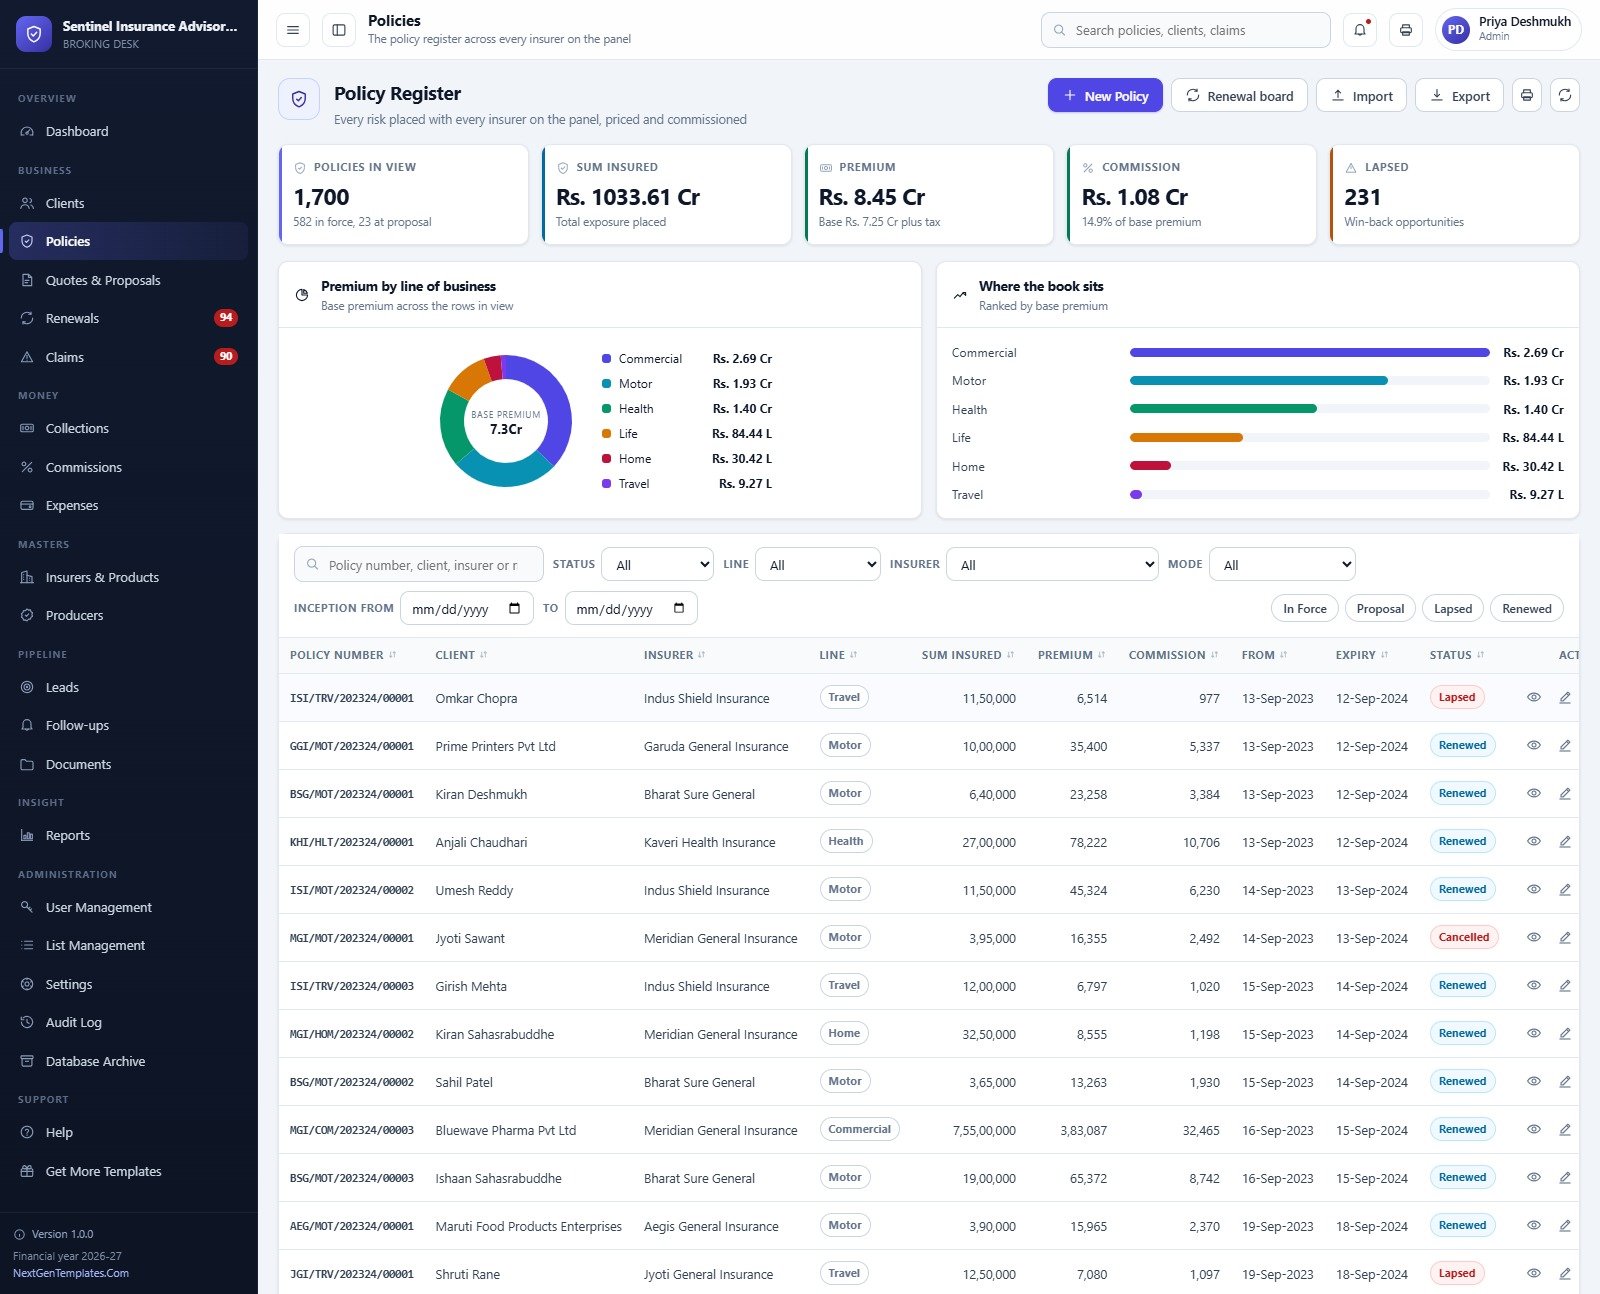
The Policy Register is the heart of the system. It holds all 1,700 policies across six lines and every insurer on the panel, with policy number, client, insurer, line, sum insured, premium, commission, dates and status. A donut and a ranked bar show where the book sits. Filters cover status, line, insurer, payment mode and inception date, plus quick chips for In Force, Proposal, Lapsed and Renewed. Commission is not typed in by hand: it comes from the insurer’s commission slab for that product, and the most specific slab wins.
Quotes and Proposals is the pipeline before a policy exists. Stages run from Enquiry through Quoted, Proposal Sent and Negotiation to Won, Lost or Expired. Each quote shows the commission it would earn, and the header shows conversion (48.4% in the demo) and the commission at stake if every open quote converts.
Renewals and claims
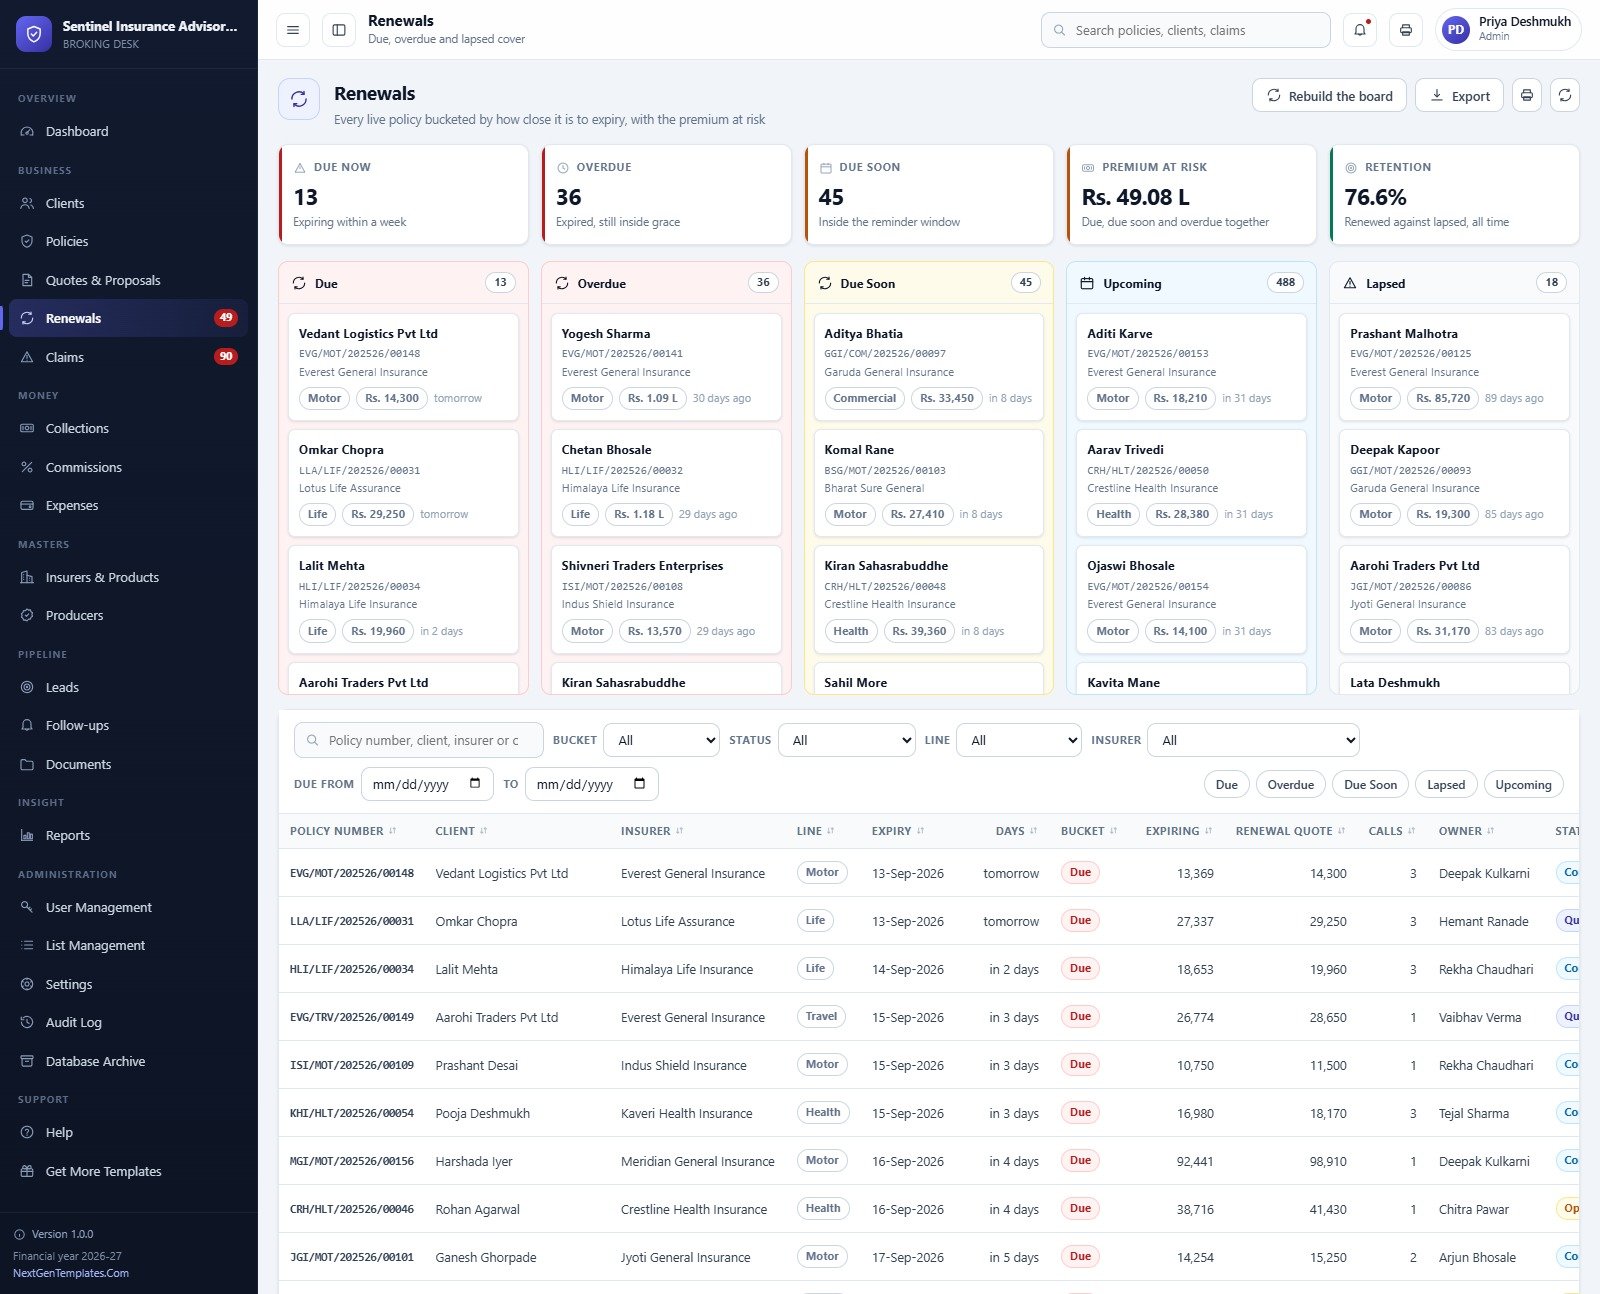
The renewal board is what protects retention. Every live policy lands in one of five buckets: Due (within a week), Overdue (expired but still inside the grace period), Due Soon (inside the reminder window), Upcoming, or Lapsed. Each card shows the client, policy number, insurer, line, renewal quote and how many days are left. The table underneath adds expiring premium, call count and owner. All three day windows are settings, so an agency that chases 45 days out can say so.
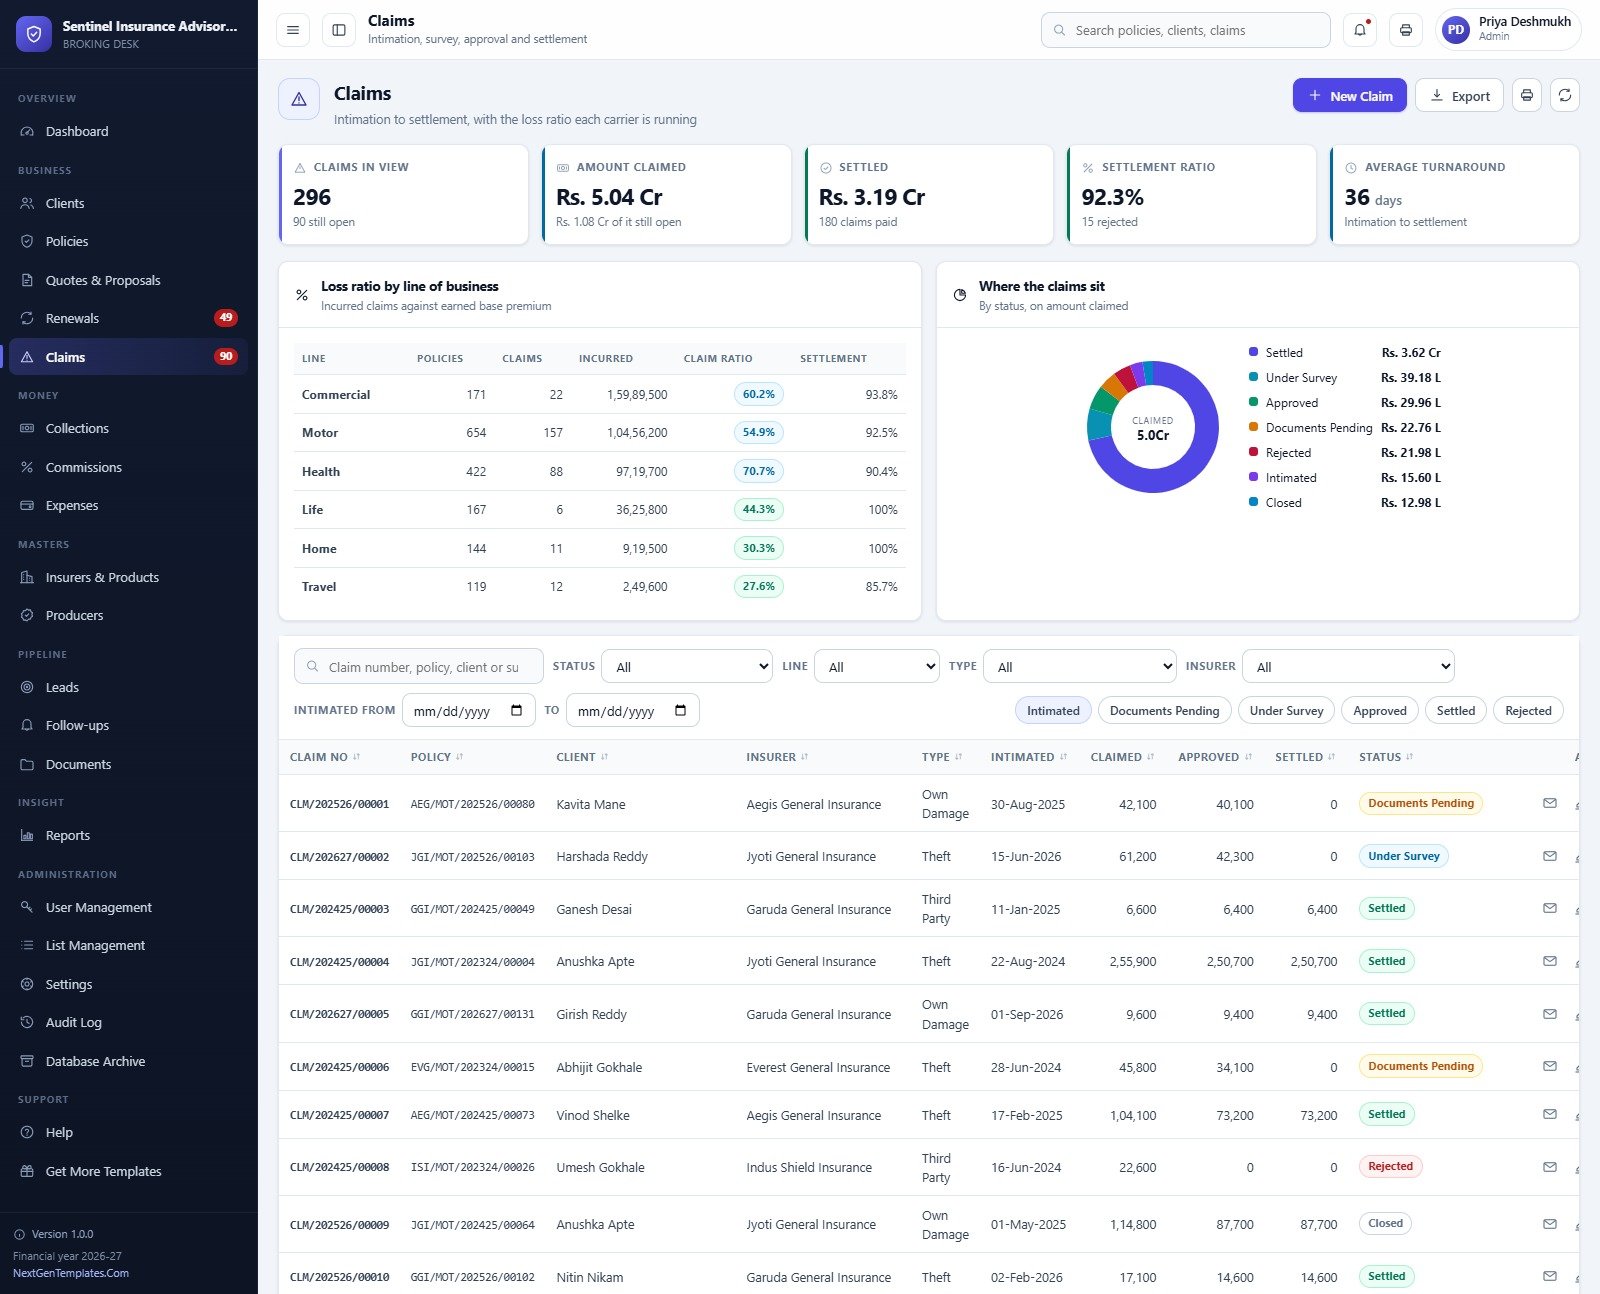
Claims run from intimation to settlement through Intimated, Documents Pending, Under Survey, Approved, Settled, Rejected and Closed. The screen shows amount claimed, amount settled, settlement ratio and average turnaround (36 days in the demo), plus a loss ratio table by line of business. Claim rows record claimed, approved and settled amounts separately, so a partial settlement is visible at a glance. One point matters here: the system records what the insurer decided. It does not adjudicate a claim.
Collections, commissions and expenses
Premium Collections raises instalments against every live policy and records receipts by mode: NEFT/RTGS, UPI, Cheque, Credit Card, Net Banking, Cash, Debit Card or Standing Instruction. The header shows what has been collected, what is outstanding, what is overdue, collection efficiency, and what is due this month. Receipts print or go out by email.
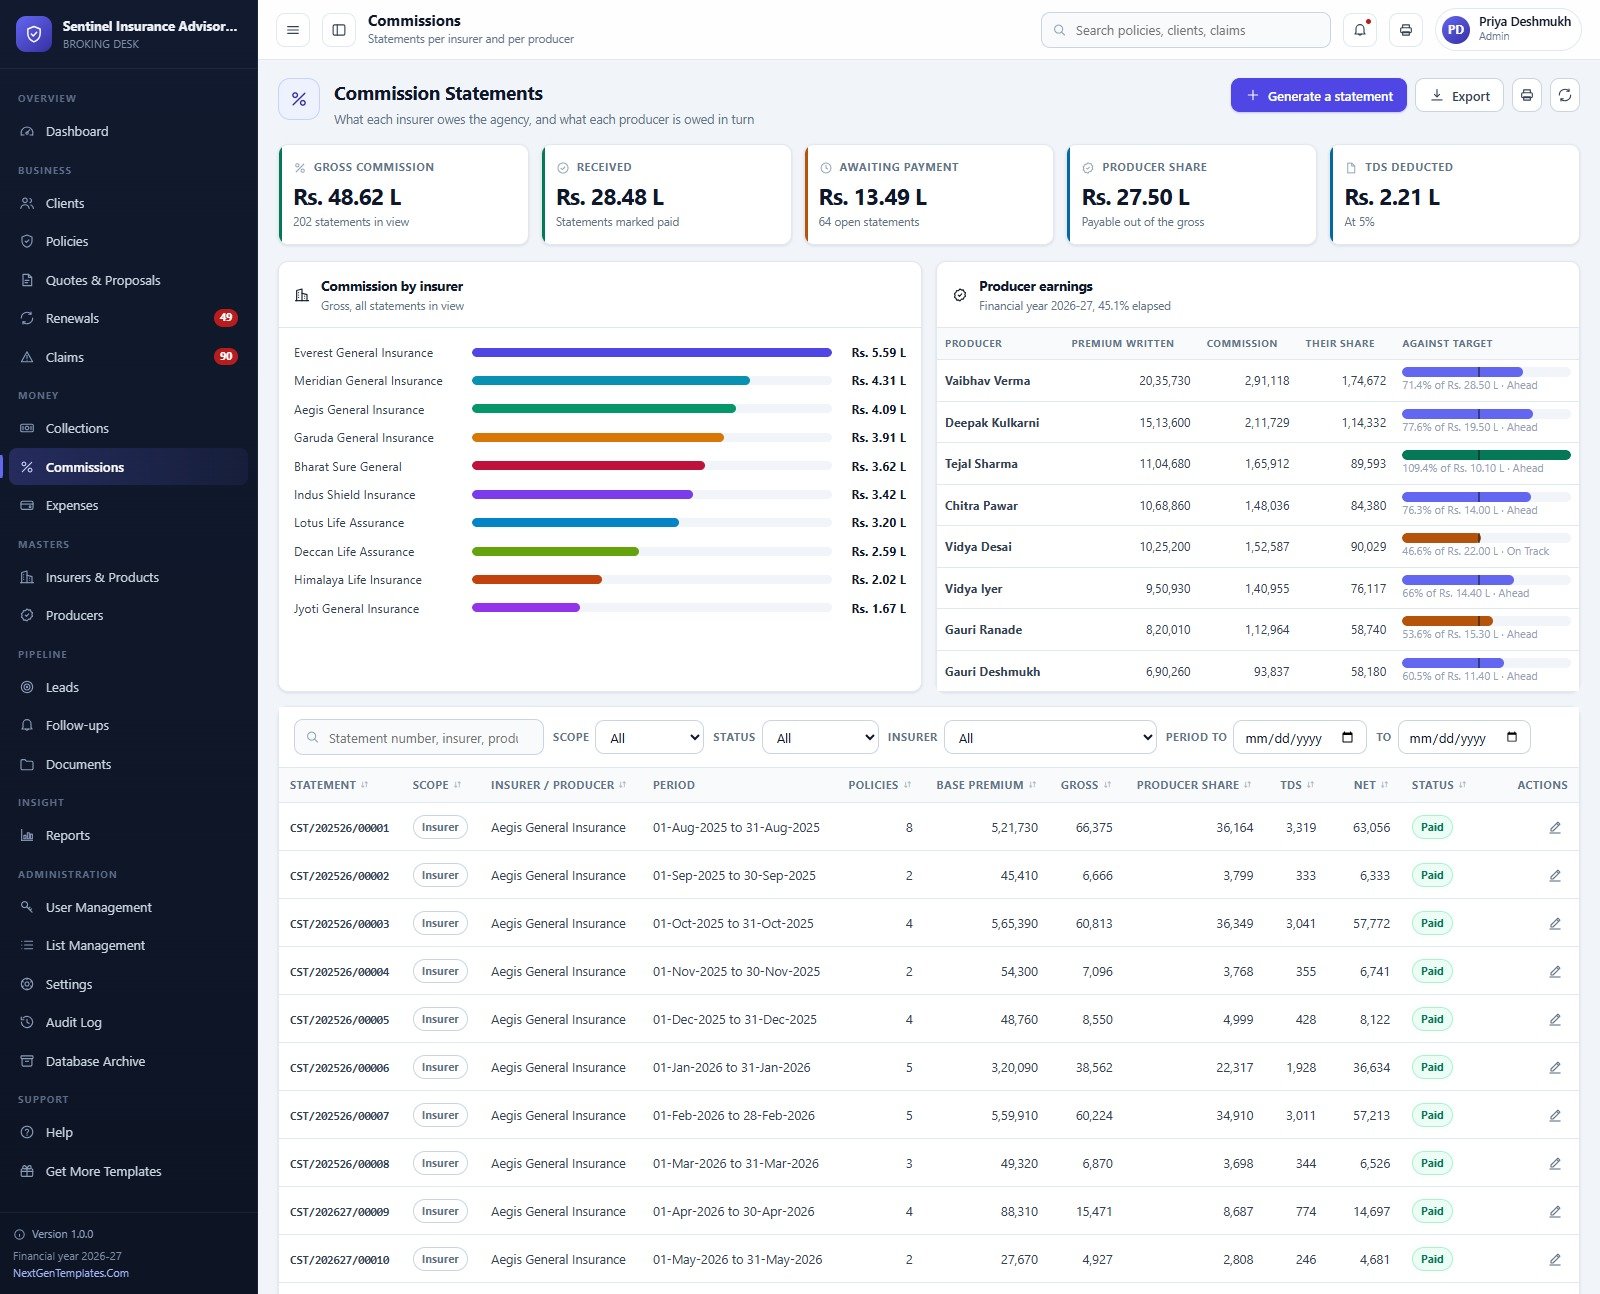
Commission Statements answer two questions: what each insurer owes the agency, and what the agency owes each producer. Statements carry base premium, gross commission, producer share, TDS at the rate you set, net amount and paid status. A producer earnings panel shows each person’s premium written, commission, share and progress against target.
Office Expenses closes the loop. Vouchers cover twelve categories, from salaries and rent to software subscriptions and bank charges, each with tax, payment mode, approver and status, and a monthly run-rate chart shows what the desk costs against the commission it earns.
Producers, leads, follow-ups and documents
The Producers screen tracks relationship managers and point-of-sale persons, with designation, financial-year target, premium written, pace against a straight-line target, policy count and licence expiry date. A card counts licences expiring in the next ninety days.
Leads carry source (website, referral, walk-in, telecalling, social media, existing client, bank tie-up, exhibition), interest line, estimated premium, a score out of 100, stage and next call. Follow-ups combine leads, renewals, claims and quotes into one call list for the whole desk, with channel, due date, owner, outcome and priority. The Document Library links policy schedules, proposal forms, KYC papers, survey reports and discharge vouchers to their client, policy or claim, and stores the files in a Google Drive folder tree.
Reports, roles and the audit trail
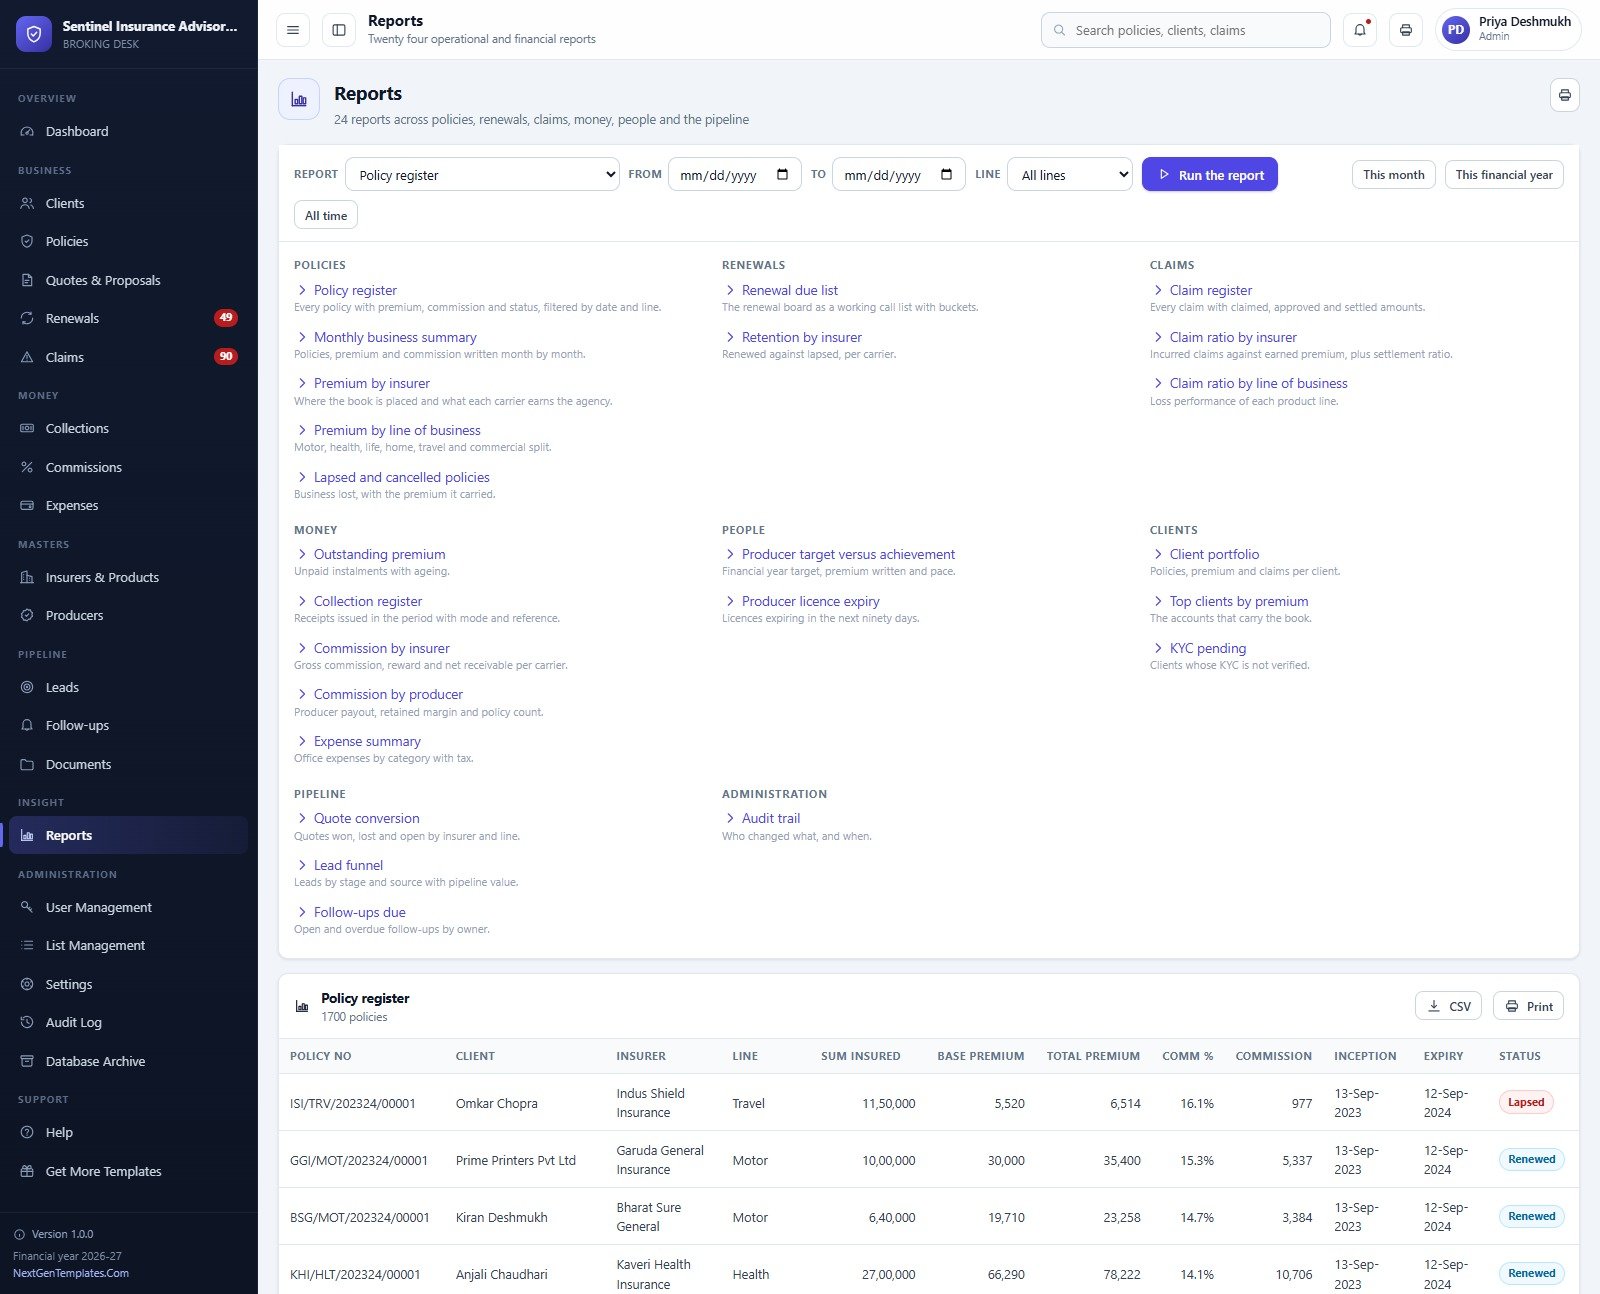
There are 24 reports, grouped into Policies, Renewals, Claims, Money, People, Clients, Pipeline and Administration. They cover the policy register, monthly business summary, premium by insurer and by line, lapsed and cancelled policies, the renewal due list, retention by insurer, claim ratio by insurer and by line, outstanding premium, collection register, commission by insurer and by producer, expense summary, producer target versus achievement, producer licence expiry, client portfolio, top clients, KYC pending, quote conversion, lead funnel, follow-ups due and the audit trail. Each runs for a date range and line of business, then exports to CSV or prints.
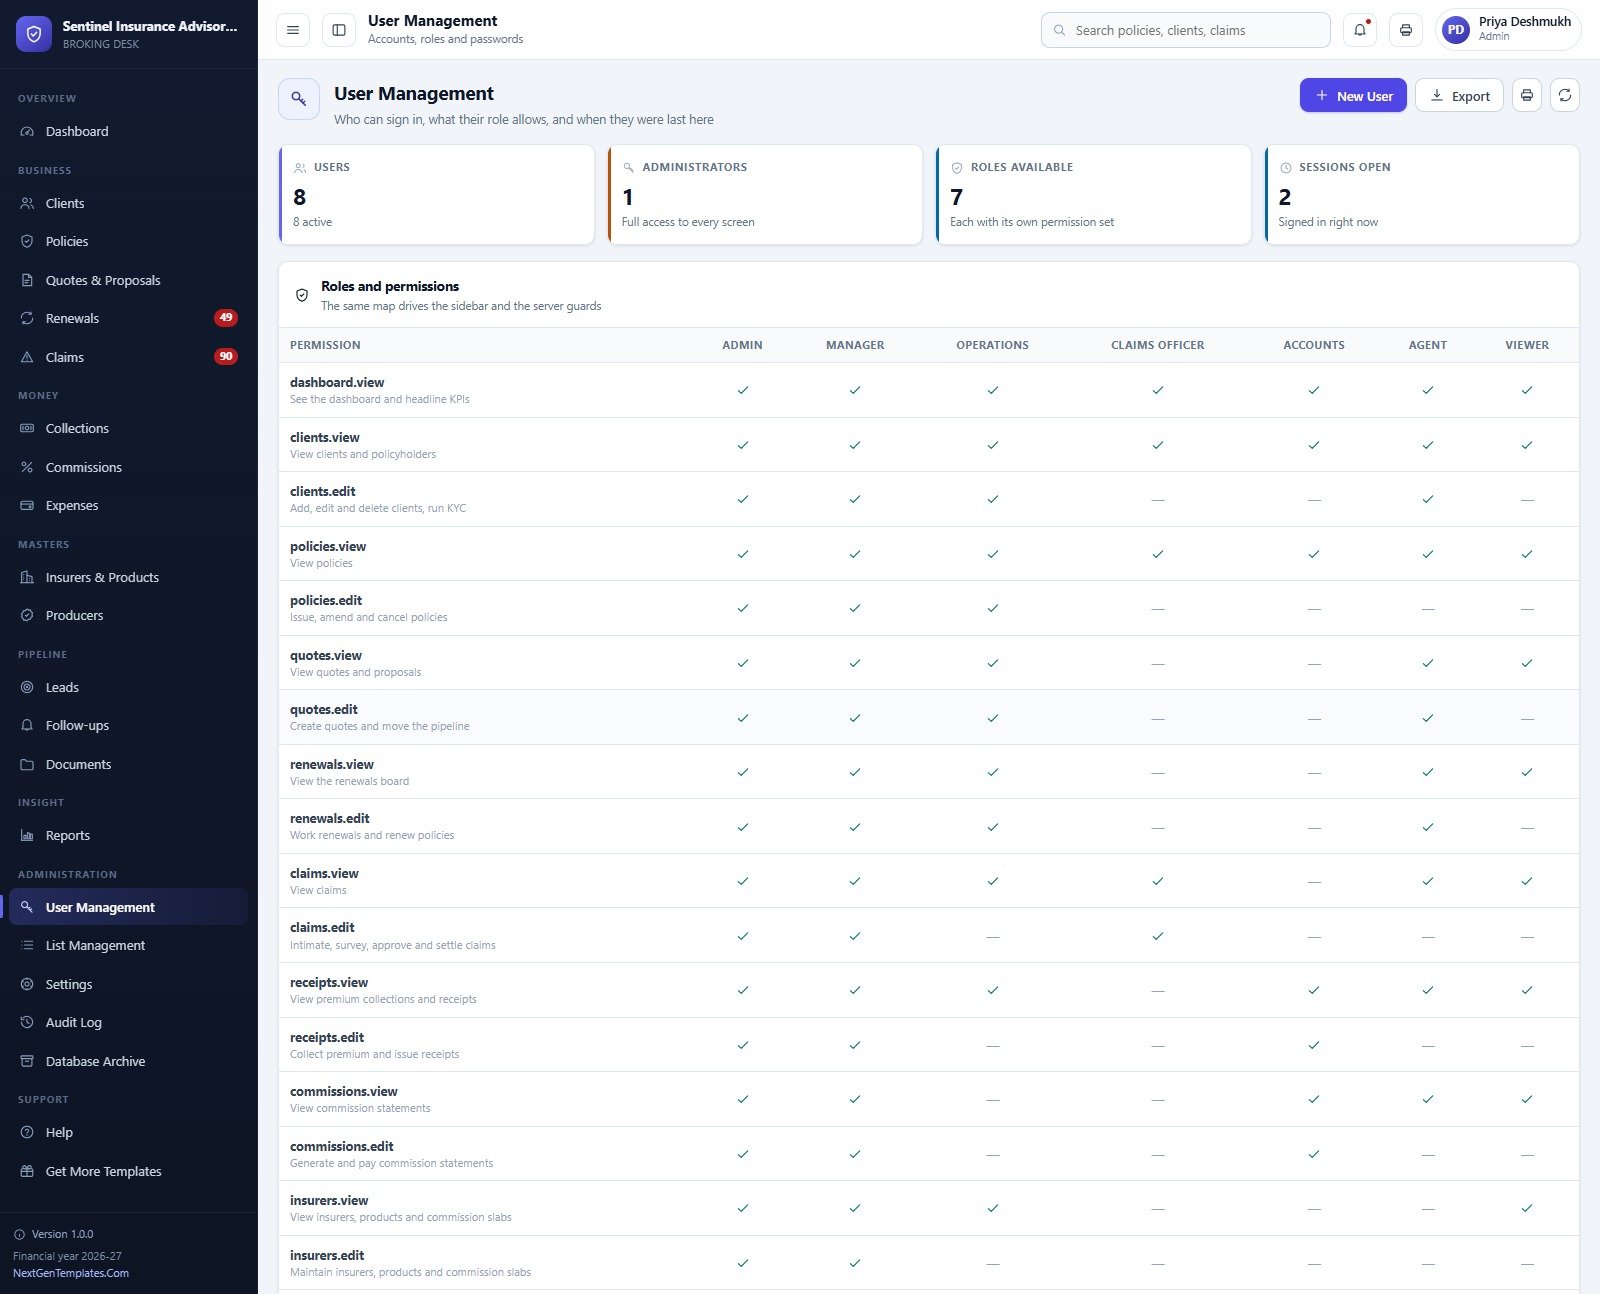
Roles are enforced, not decorative. Seven roles share a catalogue of 35 permissions, and the same map drives the sidebar and the server-side guard. That means a Claims Officer who types a collections call at the server is refused, and the refusal lands in the audit log. An Agent account linked to a producer sees only that producer’s policies, renewals, claims, collections and commissions. Passwords are stored as salted SHA-256 hashes. The Database Archive copies the whole spreadsheet to Drive before it removes closed transactions older than the retention window (18 months by default), never touches master data, and leaves behind any policy with an open claim or unpaid instalment.
Three honest caveats
- Premium totals differ between screens because they count different rows. The dashboard’s book premium for all years reads Rs. 6.69 Cr, the Insurers screen shows Rs. 7.15 Cr of base premium placed, and the Policies screen shows Rs. 7.25 Cr across all 1,700 rows in view. Read each card’s subtitle before quoting a figure.
- The seeded audit history is synthetic. A handful of demo entries show a role doing something its permission set would refuse, such as the claims account renewing a policy. The guard itself is enforced, so this affects only the generated sample history, not what your copy records.
- Some numbers do reconcile neatly. The dashboard’s 58 renewals due in 30 days equals the board’s 13 Due plus 45 Due Soon, and 36 overdue matches on both screens.
What it deliberately does not do
It is not an insurer’s policy administration system: it issues nothing on an insurer’s behalf and has no insurer portal or API connection. It makes no licensing, compliance or regulatory-certification claim. It is a record-keeping and workflow tool, and your obligations as an intermediary stay yours. The licence numbers and registration codes in the demo are fictional placeholders. It has no payment gateway, because collection modes are recorded after the fact. It is not accounting software and files no GST or TDS return. Follow-ups by WhatsApp, SMS or phone are logged, not sent, and only email goes out, through your own Google account. There is no policyholder portal.
Most important of all: you are responsible for protecting policyholder data. Your copy stores client details, KYC documents and claim or medical papers in your own Google account. What you collect, who can see it, how long you keep it and how you meet the data-protection law that applies to you are the buyer’s decisions and the buyer’s duty. Use the roles, keep Drive sharing tight, and do not load real client records into a shared demo.
Getting it running
Create a new Apps Script project, paste Code.cs.txt over Code.gs, add an HTML file named exactly Index and paste Index.txt into it. Deploy as a Web app (Execute as: Me, Who has access: Anyone) and accept the Sheets, Drive and Gmail permission prompt. Run setup once, from the First run panel on the sign-in card or by running setup() in the editor. It builds a 22-table database with the demonstration data, and because it is staged and resumable, a timeout is not fatal. Then sign in as admin, change all eight passwords, and set your agency details, currency and digit grouping, print size (3 inch, 4 inch or A4), renewal windows, commission ceiling, producer share and TDS rate. Replace the sample carriers with your own panel and slabs, and attach dailyHousekeeping() to a daily trigger.
After any later code edit, publish a new version from Manage deployments. Saving in the editor does not update the live app.
Related insurance templates on this blog
If you want the analytics view rather than the operational desk, we have written these up:
- Insurance Agency Dashboard in Google Sheets, an analytics dashboard for agency performance.
- Insurance Policy Analytics Dashboard in Google Sheets, for policy-level analysis.
- Insurance Policy and Premium Tracker in Google Sheets, a one-page tracker for a small book.
- Credit Union Member Management System Web App, a financial-services web app on the same architecture.
- Accounting Firm Client Management System Web App, if your practice is advisory rather than insurance.
The verdict on this insurance agency management system
For an independent agency or a multi-insurer brokerage that currently reconciles renewals, claims and commission across several spreadsheets, this is a complete desk you own outright. It has 22 screens, 22 tables, 7 roles, 35 permissions and 24 reports, with no server and no monthly fee. The honest way to judge it is not a feature list. Open the demo, sign in as an agent, then as the claims officer, and see whether the separation matches how your office actually works.
Get the Insurance Agency Management System Web App on NextGenTemplates.com, or try the live demo first and decide from the inside.