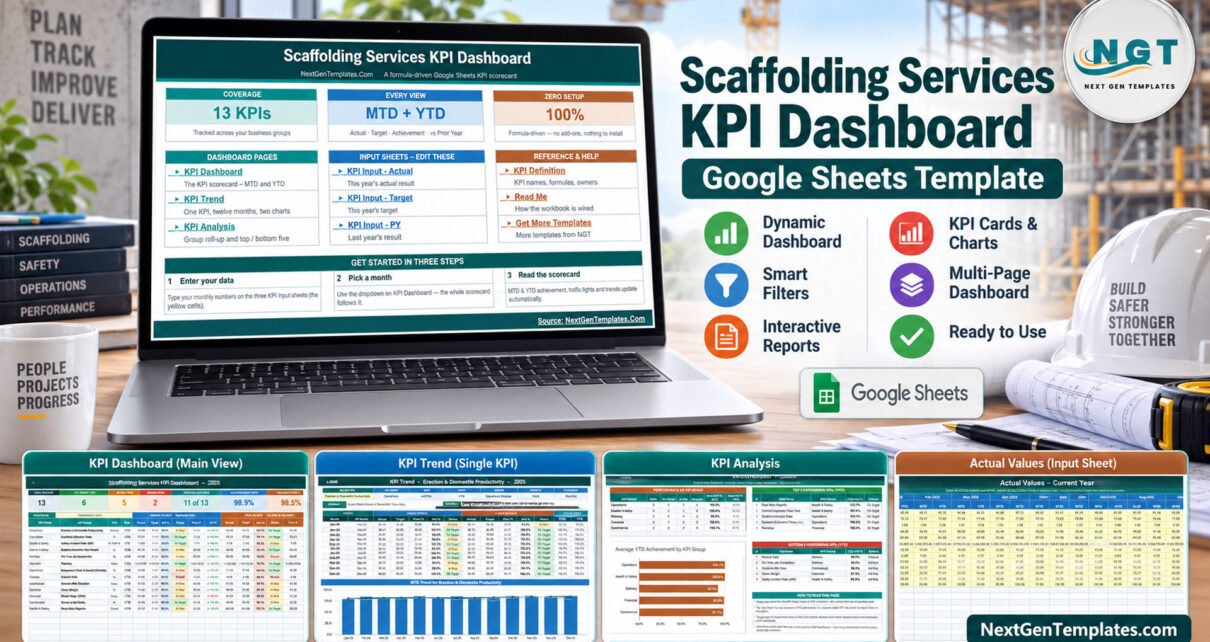
Most scaffolding companies can tell you last month’s revenue. Far fewer can say, on the same page, how many square metres a crew erected per crew-day, how much of the scaffold stock was actually out on hire, how many jobs were handed over on time and how many days customers took to pay. The Scaffolding Services KPI Dashboard in Google Sheets puts those numbers side by side: 13 KPIs in five groups, Month-to-Date and Year-to-Date, with traffic lights and a prior-year comparison.Scaffolding Services KPI Dashboard in Google Sheets
This guide walks through what is in the template, the 13 KPIs it tracks, what each page does, how to set it up and where it stops. Everything below is taken from the real build and its 2025 sample data.
Get the Scaffolding Services KPI Dashboard in Google Sheets
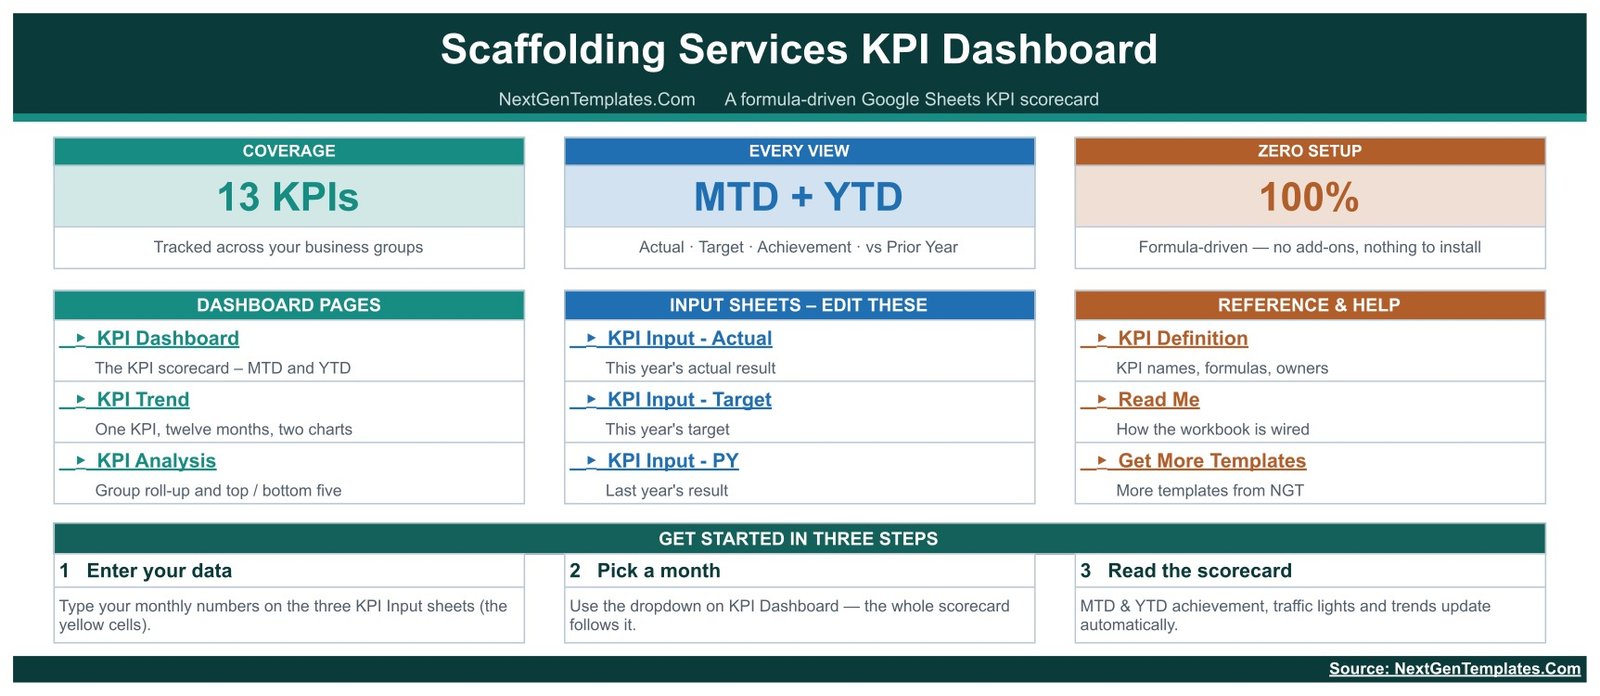
Key Features of the Scaffolding Services KPI Dashboard in Google Sheets
- 13 KPIs in five groups – Operations (3), Health & Safety (3), Delivery (2), Financial (3) and Commercial (2).Scaffolding Services KPI Dashboard in Google Sheets
- MTD and YTD on one row – actual, target, achievement %, status, prior year and vs PY for both periods.
- One month dropdown – the scorecard, the trend page and the analysis page all follow the month you pick.
- UTB and LTB scoring – 10 KPIs are upper-the-better and 3 are lower-the-better, so a falling incident rate or debtor-days figure scores as a win.
- Traffic lights – On Target from 100%, At Risk from 95% to 99%, Missed below 95%.
- Seven header cards – totals, status counts, KPIs improving against last year and average achievement MTD and YTD.Scaffolding Services KPI Dashboard in Google Sheets
- Native formulas only – no add-ons, no Apps Script, no connected data source.
It belongs to our KPI Dashboard family: a month-picker scorecard with a KPI Trend page and a KPI Analysis page. It is not the same product as the Scaffolding Services KPI Scorecard in Google Sheets, which uses a different layout, and it is not one of our analytical dashboards built on a transaction table.
The 13 KPIs Explained
Every KPI carries a unit, a type (UTB or LTB), an owner, a priority, a frequency, a written formula and a definition, all stored on the KPI Definition sheet.Scaffolding Services KPI Dashboard in Google Sheets
Operations (3 KPIs)
- Erection & Dismantle Productivity (m2/Day, UTB) – square metres erected and dismantled divided by crew-days. Owner: Operations Manager.
- Scaffold Utilisation Rate (%, UTB) – scaffold on hire on site as a share of total scaffold stock. Owner: Hire Desk Manager.Scaffolding Services KPI Dashboard in Google Sheets
- Equipment (Tube & Board) Utilisation (%, UTB) – tubes and boards issued as a share of the tube and board stock owned. Owner: Yard Manager.Scaffolding Services KPI Dashboard in Google Sheets
Health & Safety (3 KPIs)
- Safety Incident Rate (AIR) (per 100K hours, LTB) – reportable incidents per 100,000 hours worked.
- Scaffold Inspection Pass Rate (%, UTB) – inspections passed first time as a share of inspections carried out.
- Near-Miss Reports (Count, UTB) – near-miss events logged by crews. The template treats more reporting as a sign of a healthier reporting culture.
These rows only report figures you type in. The template does not run, schedule or record inspections or incidents.Scaffolding Services KPI Dashboard in Google Sheets
Delivery (2 KPIs)
- On-Time Job Completion (%, UTB) – jobs completed by the agreed date as a share of jobs completed.
- Rework Rate (%, LTB) – scaffolds requiring rework as a share of scaffolds erected.
Financial (3 KPIs)
- Revenue (USD, UTB) – erection fees plus hire charges plus dismantle fees.
- Gross Margin (%, UTB) – revenue less direct cost, as a share of revenue.
- Debtor Days (DSO) (Days, LTB) – accounts receivable divided by revenue, times days in the period.Scaffolding Services KPI Dashboard in Google Sheets
Commercial (2 KPIs)
- Average Hire Duration (Days, UTB) – total days on hire divided by the number of live contracts.
- Quote-to-Win Rate (%, UTB) – quotes won as a share of quotes submitted.
Dashboard Pages Explanation
Home
The start page links to the three dashboard pages (KPI Dashboard, KPI Trend, KPI Analysis), the three input sheets (KPI Input – Actual, KPI Input – Target, KPI Input – PY) and the reference sheets (KPI Definition, Read Me, Get More Templates). A three-step panel explains the workflow: enter your data, pick a month, read the scorecard.Scaffolding Services KPI Dashboard in Google Sheets
KPI Dashboard
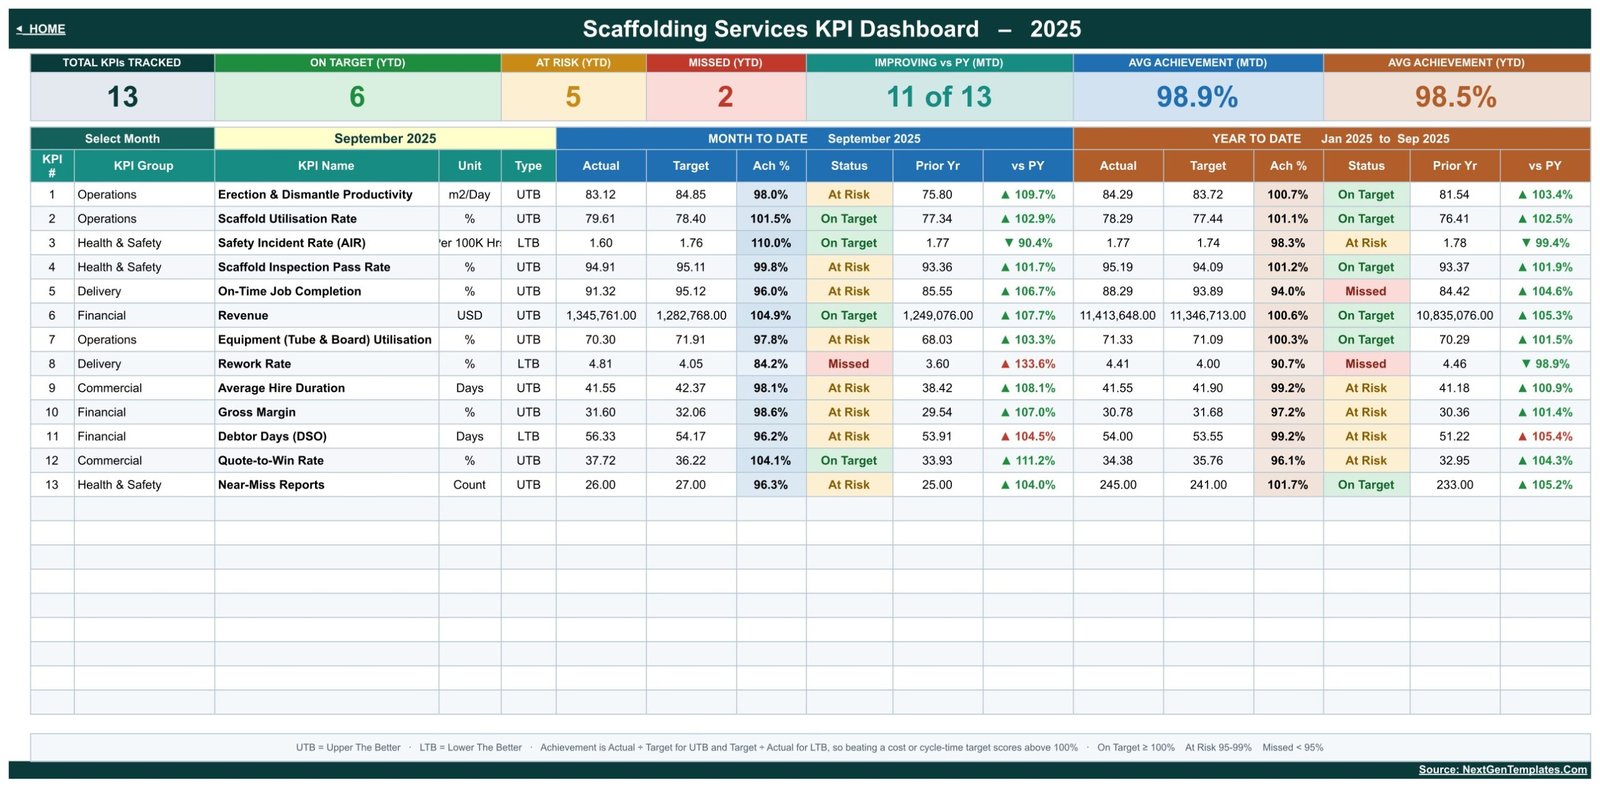
The scorecard. With September 2025 selected, the header cards show 13 KPIs tracked, 6 On Target, 5 At Risk and 2 Missed year to date, 11 of 13 KPIs improving against the prior year month to date, and average achievement of 98.9% MTD and 98.5% YTD. Below them, each KPI has its group, unit and type, then the MTD block (actual, target, achievement %, status, prior year, vs PY) and the same six columns for YTD. A legend at the bottom explains UTB, LTB and the thresholds.Scaffolding Services KPI Dashboard in Google Sheets
KPI Trend
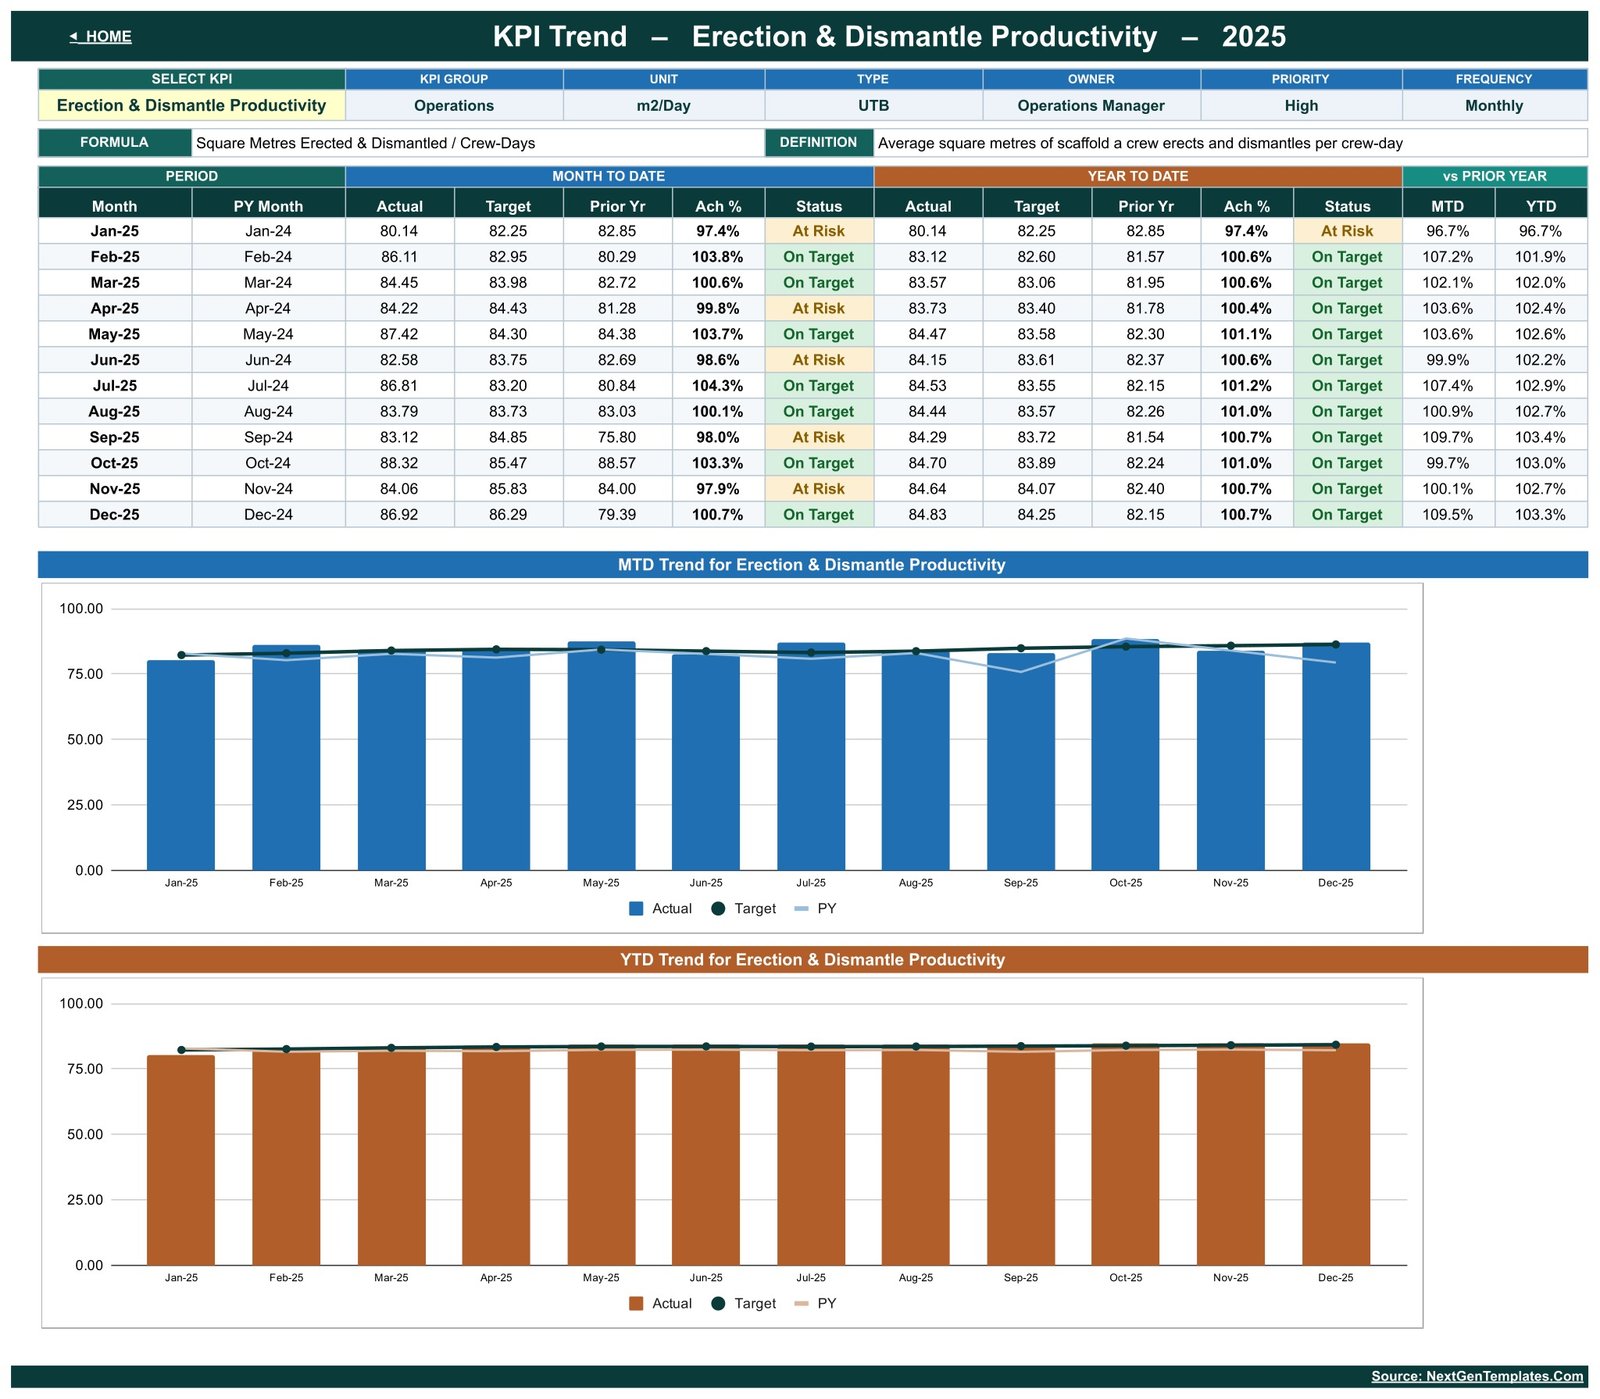
Select one KPI and the page fills its group, unit, type, owner, priority, frequency, formula and definition. A twelve-month table lists MTD and YTD actual, target, prior year, achievement and status, plus vs PY for MTD and YTD. Two charts follow: MTD Actual vs Target and PY by Month and YTD Actual vs Target and PY by Month, each with actual as columns and target and prior year as lines.Scaffolding Services KPI Dashboard in Google Sheets
KPI Analysis
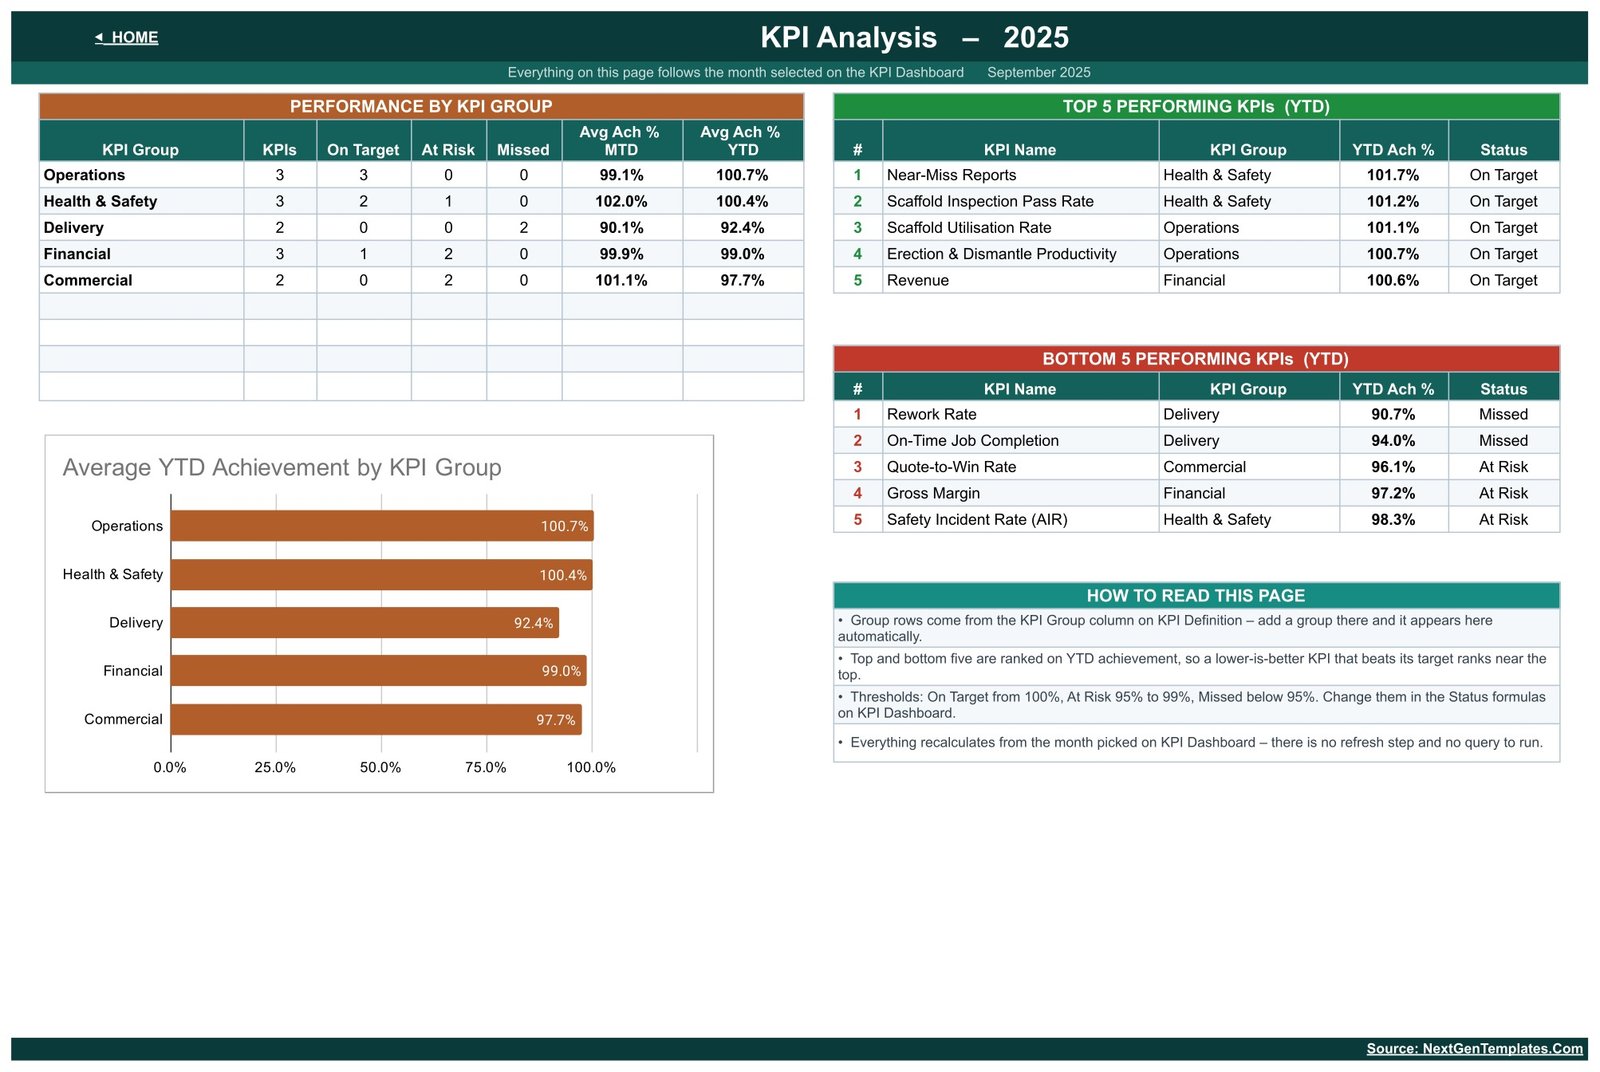
Performance by KPI Group counts KPIs, On Target, At Risk and Missed per group with average MTD and YTD achievement. The Average YTD Achievement by KPI Group chart shows the same in bars. In the sample, Operations leads at 100.7% and Delivery trails at 92.4%. The Top 5 Performing KPIs (YTD) start with Near-Miss Reports at 101.7%, and the Bottom 5 start with Rework Rate at 90.7% and On-Time Job Completion at 94.0%.
Input sheets and KPI Definition
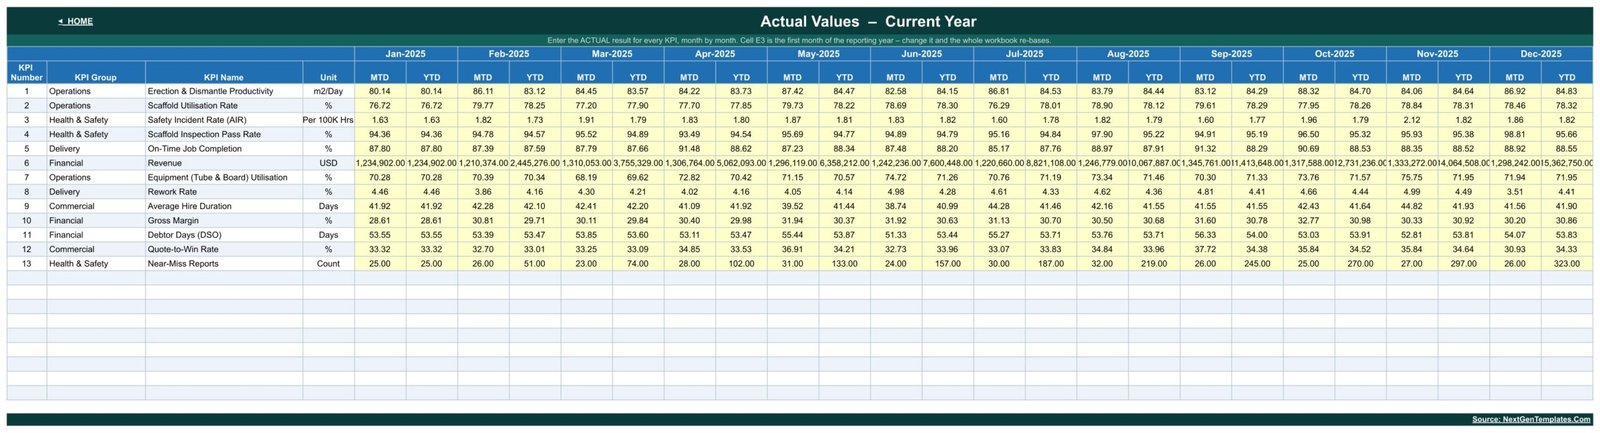
The three input sheets share one layout: one row per KPI and an MTD and a YTD column for each month. You type only in the yellow cells. Cell E3 holds the first month of the reporting year; change it and the workbook re-bases. The KPI Definition sheet is the master list, so adding, renaming or deleting a KPI there flows through to every other sheet.
Scaffolding Services KPI Dashboard vs. Excel KPI Workbook vs. Paid Contractor Software – Feature Comparison
| Criteria | This Google Sheets template | Excel KPI workbook | Paid contractor / hire software |
|---|---|---|---|
| Cost | One-time purchase | One-time purchase plus Excel licence | Recurring subscription |
| Platform | Google Sheets in a browser | Excel desktop | Vendor web app |
| Setup time | Make a copy, type your numbers | Download and open | Onboarding and configuration |
| Real-time team collaboration | Yes | Limited without cloud sync | Yes |
| Mobile access | Google Sheets app | Excel app | Vendor app |
| Customisable KPIs | Yes, one master list | Yes | Within vendor limits |
| Share with link | Yes | Via cloud storage | Per user seat |
| MTD, YTD and prior-year scorecard | Built in | Depends on workbook | Often a custom report |
| Job scheduling, hire tickets, inspections | Not included | Not included | Usually included |
Who Should Use This Template
- Owners and managing directors of scaffolding contractors who want one monthly performance page.
- Contracts managers watching on-time completion and rework.
- Hire desk and yard managers tracking scaffold utilisation, tube and board utilisation and hire duration.
- Finance directors and credit controllers following gross margin and debtor days.
- Estimating managers reporting quote-to-win rate.
Real-World Use Cases
Monthly board pack. A managing director picks the month, exports the KPI Dashboard page and opens the meeting on the red rows. In the sample month that means Rework Rate and On-Time Job Completion, both Missed year to date.
Yard and hire review. A hire desk manager opens KPI Trend on Scaffold Utilisation Rate, then on Average Hire Duration, and compares each month against the same month last year.
Cash collection. A credit controller follows Debtor Days (DSO), a lower-the-better KPI. Days going down score above 100%.
Advantages of the Scaffolding Services KPI Dashboard
- Operations, safety, delivery, finance and sales numbers on one page instead of five reports.
- MTD and YTD together, so one bad month does not hide a good year or the other way round.
- Prior-year comparison built into every row.
- Runs in any browser with a Google account and shares like any Google Sheet.
- Fully editable KPI list with owners and formulas written down.
Opportunities for Improvement
- It is monthly. There is no daily, weekly or per-job view.
- Numbers are typed in. It does not connect to hire, accounting or job management software.
- It covers one reporting year per copy.
- It is a management reporting template on sample data, not a scaffold inspection register, design or load tool, or a safety record.
Best Practices
- Agree each KPI formula and owner on KPI Definition before entering any figures.
- Set realistic targets on KPI Input – Target. The thresholds are relative to target, so targets decide the colours.
- Enter the month’s figures by a fixed date so the scorecard is ready for the same meeting every month.
- Check each KPI’s UTB/LTB type after adding it. A wrong direction flips its status.
- Use Google Sheets sharing to give managers view access and restrict edit access to the input sheets.
Explore Relevant Templates
- Scaffolding Services KPI Scorecard in Google Sheets – the scorecard family for the same trade.
- Masonry Contractor KPI Dashboard in Google Sheets
- Home Renovation Contractor KPI Dashboard in Google Sheets
- Window and Door Installation KPI Dashboard in Google Sheets
To get more from KPI reporting in a spreadsheet, the Excel Pivot Tables & Dashboards course on NextGenTemplates Academy teaches the charting and summarising skills step by step.
Get the Scaffolding Services KPI Dashboard in Google Sheets
Frequently Asked Questions
Is this a KPI dashboard or a KPI scorecard?
It is the KPI Dashboard edition: a month-picker MTD/YTD scorecard with traffic lights, a KPI Trend page and a KPI Analysis page. The Scaffolding Services KPI Scorecard is a separate template.
Do I need Apps Script or an add-on?
No. It runs on native Google Sheets formulas.
Can I add or remove KPIs?
Yes. Edit the KPI Definition sheet and add matching rows on the three input sheets.
What if my financial year starts in April?
Change cell E3 on KPI Input – Actual and every month column re-bases.
Is the data real?
No. The 2025 figures are illustrative sample data. Replace them with your own.
Does it replace inspection or safety records?
No. It reports the numbers you enter. Keep inspection, incident and certification records in the systems your business requires.
About the Author
Built by PK – Microsoft Certified Professional with 15+ years of Excel, Google Sheets, and Power BI experience. Founder of NextGenTemplates, reaching 300K+ subscribers across YouTube channels. Every template is hand-built and tested before release.
Conclusion
The Scaffolding Services KPI Dashboard in Google Sheets gives a scaffolding business one monthly page for 13 KPIs: productivity, utilisation, safety reporting, delivery, margin, cash collection and sales conversion, with MTD, YTD and prior-year comparison in the same row. Replace the sample data, pick a month and the scorecard, trend and analysis pages follow.