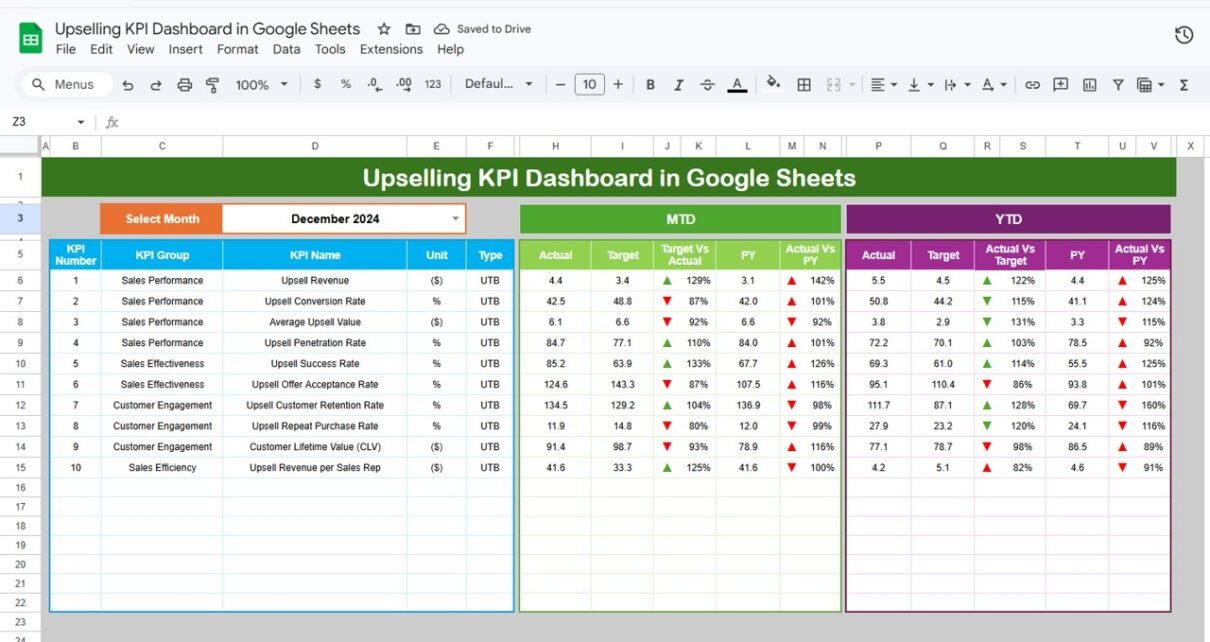
Gene therapy programs operate in a highly complex, data-driven, and compliance-sensitive environment. Tracking performance manually across experiments, trials, manufacturing, and quality metrics often leads to delays, errors, and missed insights. That is exactly why the Gene Therapy KPI Dashboard in Google Sheets is a powerful, ready-to-use solution for research teams, biotech companies, and life-science organizations. […]
Google Sheets
Employee Leave Dashboard in Google Sheets
Managing employee leave efficiently is critical for maintaining productivity, controlling costs, and ensuring workforce well-being. However, many HR teams still rely on scattered spreadsheets or manual calculations, which makes tracking leave data slow and error-prone. That is exactly where the Employee Leave Dashboard in Google Sheets becomes a powerful solution. This ready-to-use Google Sheets dashboard […]
Office Emergency Preparedness Dashboard in Google Sheets
Emergency preparedness is no longer optional for modern organizations. From natural disasters and cyber incidents to fire hazards and power outages, offices must stay ready to respond quickly and effectively. However, many organizations still manage emergency planning data using scattered spreadsheets, static reports, or manual tracking methods. As a result, decision-makers often lack real-time visibility […]
Wearable Tech KPI Dashboard in Google Sheets
The wearable technology market is growing rapidly, driven by innovation, customer demand, and constant product evolution. To stay competitive, organizations need clear visibility into performance across sales, operations, quality, and customer engagement. That is exactly where the Wearable Tech KPI Dashboard in Google Sheets becomes an essential tool. This ready-to-use KPI dashboard helps you track, […]
Education KPI Scorecard in Google Sheets
Tracking educational performance across multiple metrics can quickly become complex—especially when data is scattered across files or reported manually. That is why the Education KPI Scorecard in Google Sheets is a powerful, ready-to-use template designed to simplify performance monitoring for schools, colleges, training institutes, and education administrators. This scorecard brings all critical education KPIs into […]
Office Budget Utilization Dashboard in Google Sheets
Managing office budgets across departments, categories, and vendors is never simple. When budget data is spread across multiple spreadsheets, tracking actual spend, variances, approvals, and trends becomes time-consuming and error-prone. That is exactly why the Office Budget Utilization Dashboard in Google Sheets is a powerful, ready-to-use solution for finance teams, operations managers, and business leaders.Office […]
Office Utility Cost Dashboard in Google Sheets
Managing office utility expenses without a structured reporting system often leads to budget overruns, delayed payments, and poor cost visibility. Electricity bills, internet charges, water usage, waste management fees, and other utilities generate large volumes of data every month. However, when this data remains scattered across invoices and spreadsheets, it becomes difficult to control costs […]
Risk Management KPI Scorecard In Google Sheets
Risk Management KPI Scorecard In Google Sheets is no longer limited to audits and checklists. Today, organizations must continuously monitor compliance performance, identify risks early, and take corrective actions on time. However, when compliance data is scattered across emails and spreadsheets, visibility becomes poor and decision-making slows down.Risk Management KPI Scorecard In Google Sheets That […]
Gaming Console KPI Dashboard in Google Sheets
The gaming console industry moves fast. Sales volumes change monthly, customer demand fluctuates, and performance targets must be monitored closely. When gaming KPI data is spread across multiple spreadsheets, it becomes difficult to track progress, compare targets, and identify trends. That is exactly why the Gaming Console KPI Dashboard in Google Sheets is a powerful […]
Home Appliances KPI Dashboard in Google Sheets
Tracking performance in the home appliances industry requires clear visibility into sales, operations, targets, and trends. When KPI data is scattered across multiple spreadsheets, it becomes difficult to evaluate performance, compare targets, and take timely actions. That is exactly where the Home Appliances KPI Dashboard in Google Sheets becomes a powerful, ready-to-use solution.Home Appliances KPI […]


