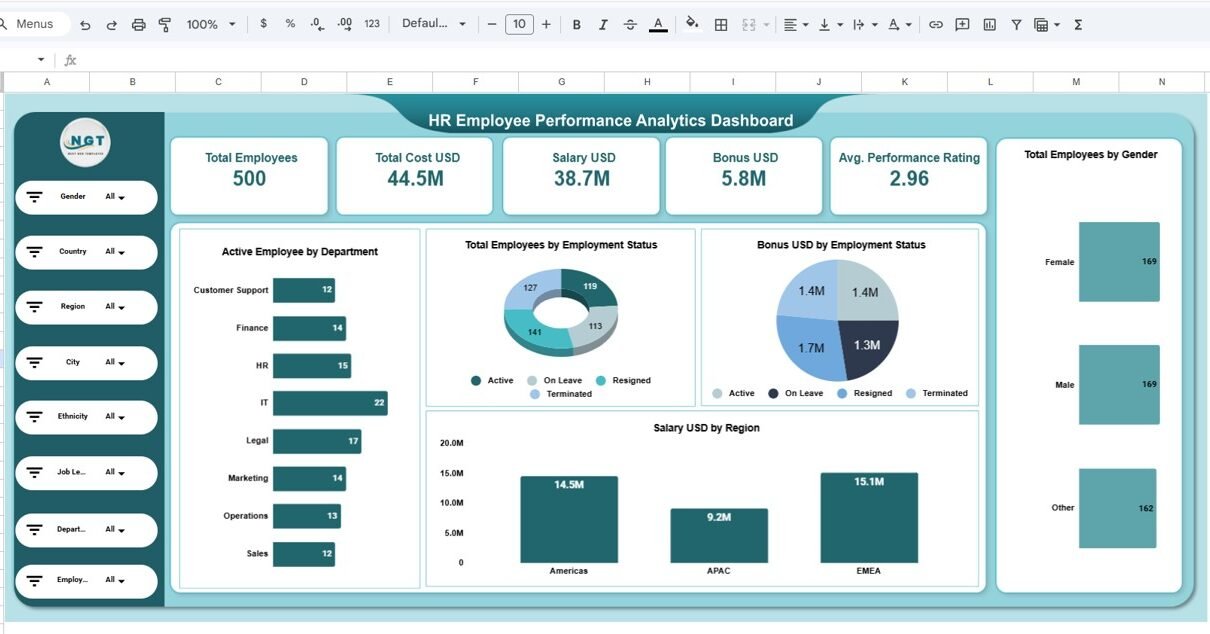
Managing office budgets across departments, categories, and vendors is never simple. When budget data is spread across multiple spreadsheets, tracking actual spend, variances, approvals, and trends becomes time-consuming and error-prone. That is exactly why the Office Budget Utilization Dashboard in Google Sheets is a powerful, ready-to-use solution for finance teams, operations managers, and business leaders.Office […]
Dashboard
Google-Sheets-Dashboard
Office Utility Cost Dashboard in Google Sheets
Managing office utility expenses without a structured reporting system often leads to budget overruns, delayed payments, and poor cost visibility. Electricity bills, internet charges, water usage, waste management fees, and other utilities generate large volumes of data every month. However, when this data remains scattered across invoices and spreadsheets, it becomes difficult to control costs […]
Office Event Attendance Dashboard in Google Sheets
Managing office events without clear visibility into attendance, costs, and feedback often leads to budget overruns and low engagement. Spreadsheets filled with raw data rarely tell the full story. That is why an Office Event Attendance Dashboard in Google Sheets becomes an essential tool for HR teams, admin teams, and event planners.Office Event Attendance Dashboard […]
Strategic Planning Dashboard in Google Sheets
In today’s competitive business environment, organizations must continuously track strategic initiatives, budgets, risks, and performance outcomes to stay aligned with long-term goals. However, when strategic data is scattered across spreadsheets, presentations, and reports, decision-making becomes slow and reactive. That is exactly why the Strategic Planning Dashboard in Google Sheets is a powerful, ready-to-use solution. This […]
Procurement Cost Analysis Dashboard in Google Sheets
Managing procurement costs efficiently is one of the biggest challenges for finance, operations, and supply chain teams. Purchase orders, vendor payments, categories, departments, and locations often sit across multiple spreadsheets, making it difficult to understand where money is being spent and where savings are possible.Procurement Cost Analysis Dashboard in Google Sheets That is exactly why […]
Office Vehicle Fleet Dashboard in Google Sheets
Managing an office vehicle fleet involves tracking multiple cost drivers such as vehicle purchases, fuel expenses, insurance, maintenance, utilization, and downtime. However, when this information is scattered across spreadsheets or manual reports, fleet management becomes inefficient and error-prone.Office Vehicle Fleet Dashboard in Google Sheets That is exactly why the Office Vehicle Fleet Dashboard in Google […]
Office Sustainability Dashboard in Google Sheets
Organizations today face increasing pressure to reduce operational costs, optimize workspace utilization, and meet sustainability goals. However, sustainability data often remains scattered across spreadsheets, utility bills, and manual reports. As a result, tracking energy usage, water consumption, occupancy, and environmental impact becomes time-consuming and ineffective. That is exactly why the Office Sustainability Dashboard in Google […]
Business Growth Dashboard in Google sheets
Business growth does not happen by chance. It requires clear visibility into revenue, costs, profit, sales channels, and customer behavior. However, many businesses still rely on scattered spreadsheets and manual reports. As a result, decision-making becomes slow and reactive. Therefore, a Business Growth Dashboard in Google Sheets becomes an essential solution. It transforms raw business […]
Employee Benefits Dashboard in Google Sheets
Employee benefits play a critical role in attracting, retaining, and motivating talent. However, managing benefits data across departments, providers, benefit types, and months can quickly become complex. Therefore, organizations need a centralized, visual, and easy-to-use system to monitor benefits cost, participation, and trends. The Employee Benefits Dashboard in Google Sheets is a ready-to-use HR analytics […]
Product Inventory Dashboard in Google Sheets
Managing inventory without clear visibility leads to stockouts, overstocking, and cash flow issues. Therefore, businesses need a simple, visual, and data-driven system to monitor inventory performance. The Product Inventory Dashboard in Google Sheets is a ready-to-use solution that helps you track stock levels, inventory value, reorder requirements, and trends across categories, locations, vendors, and time. […]


