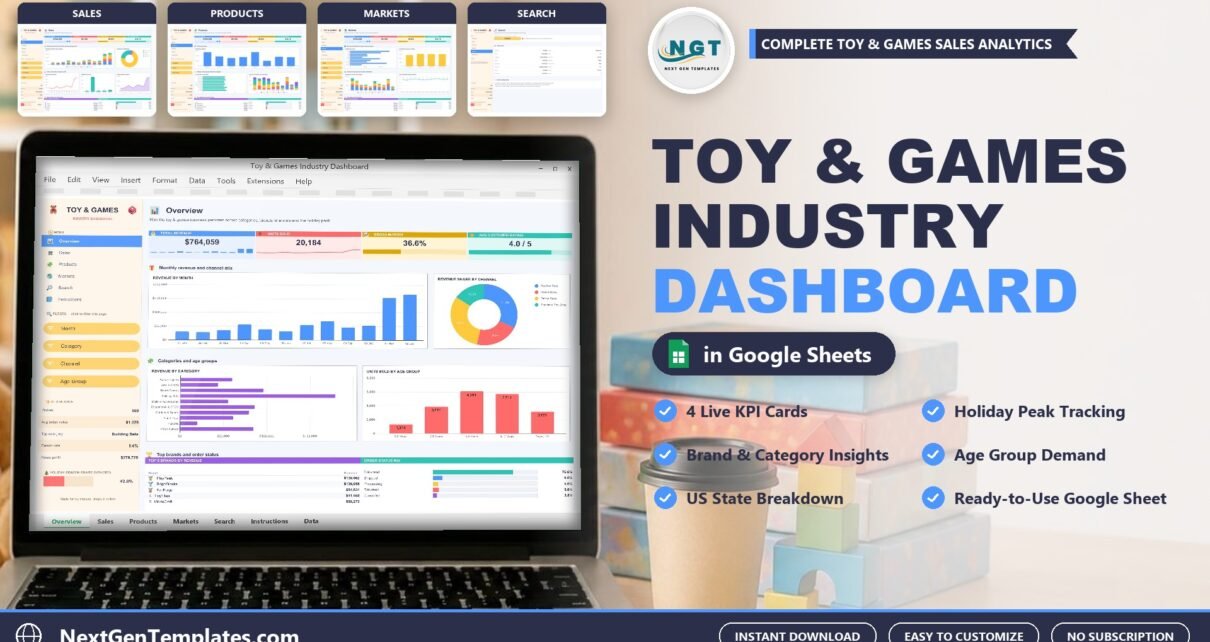
A six-page Toy & Games Industry Dashboard in Google Sheets: 4 KPI cards, 15 slicers and 16 charts over 500 sample orders, 10 categories, 8 brands and 4 channels.
Online Tutorial for Data Analysis and Automation
Google-Sheets-Dashboard
A six-page Toy & Games Industry Dashboard in Google Sheets: 4 KPI cards, 15 slicers and 16 charts over 500 sample orders, 10 categories, 8 brands and 4 channels.
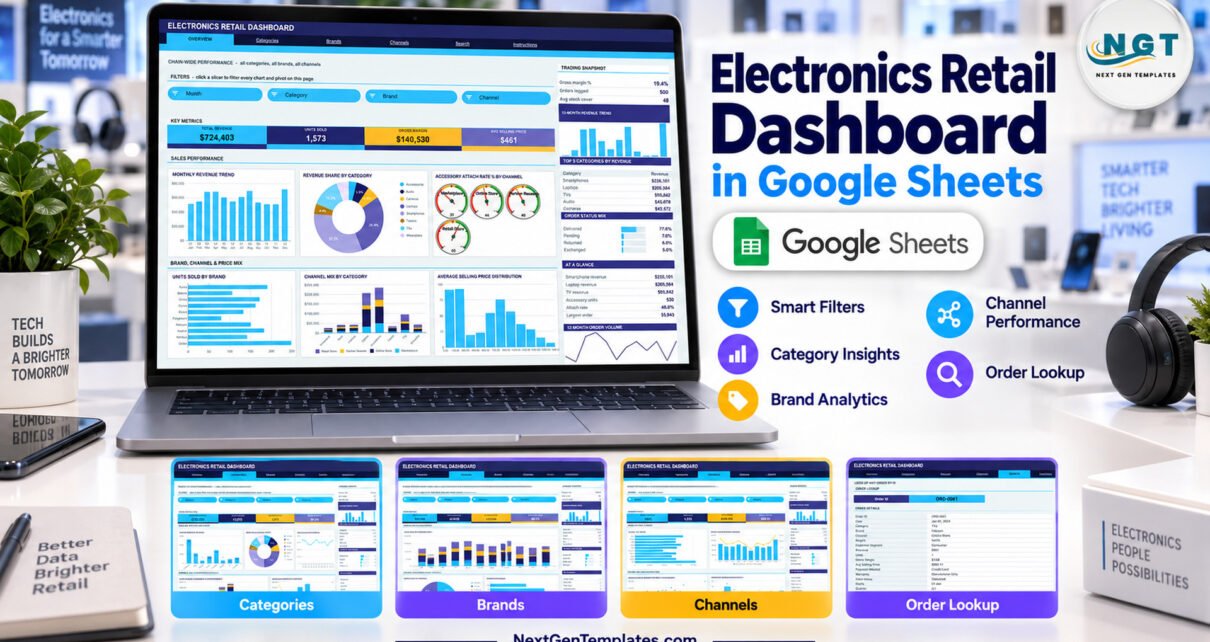
A six-tab Electronics Retail Dashboard in Google Sheets: 16 KPI cards, 15 slicers and 18 pivot-driven charts over 500 sample orders, 8 categories, 10 brands and 4 channels.
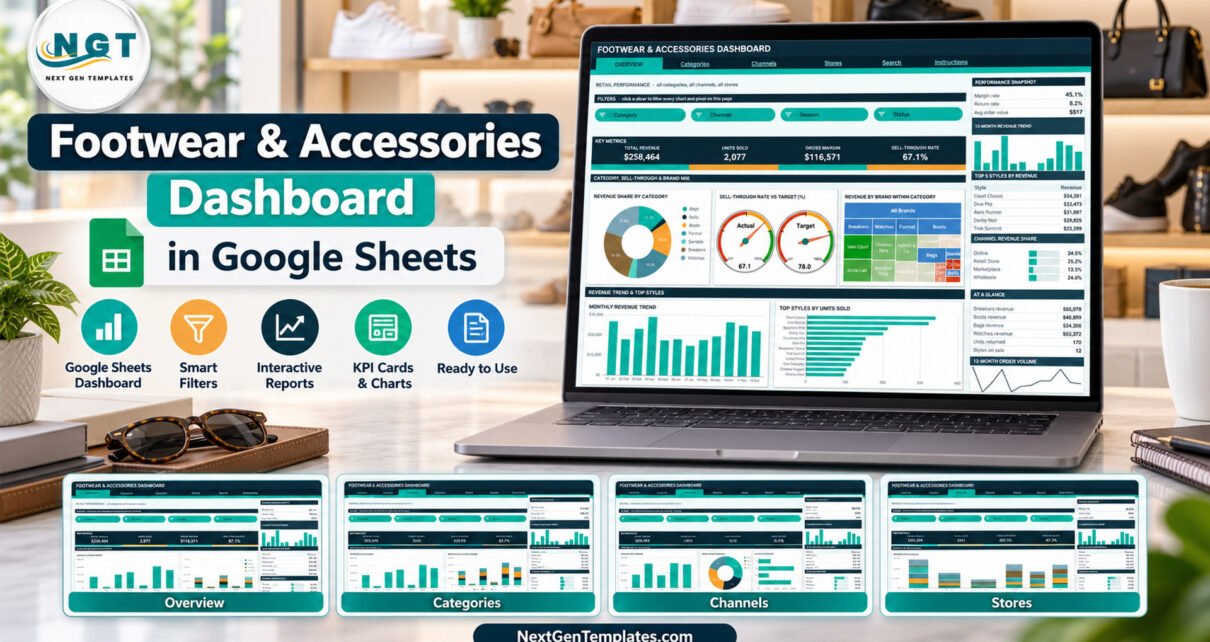
A six-tab Google Sheets retail dashboard with 16 KPI cards, 19 pivot-backed charts and 15 slicers covering sell-through, size curve, channel mix and returns.
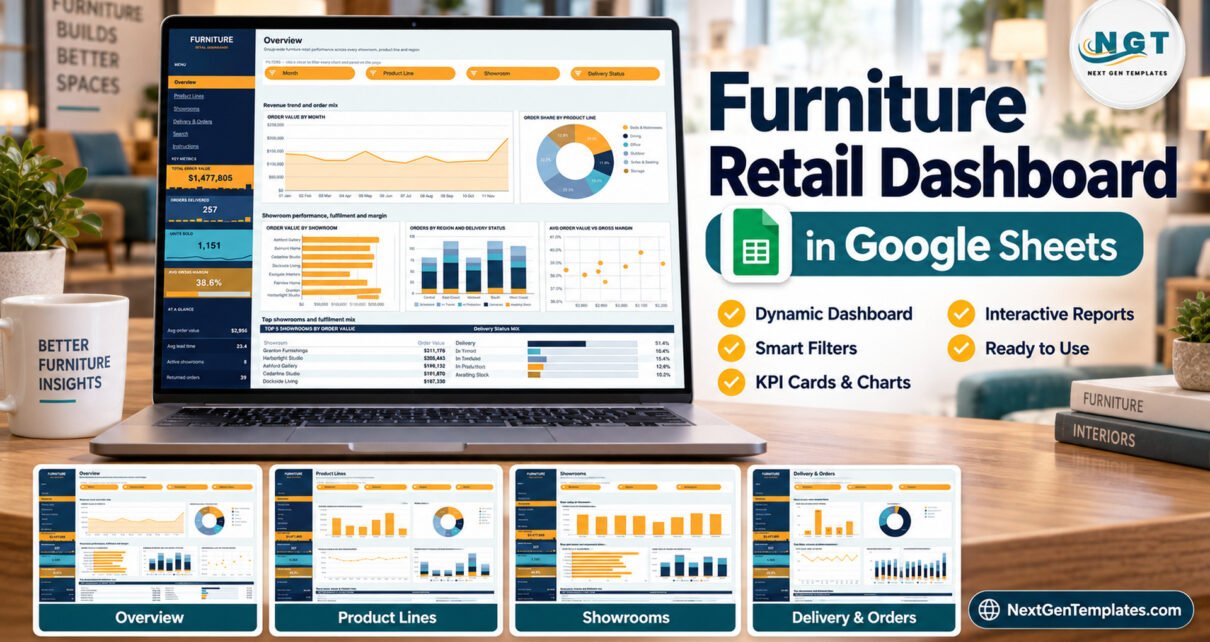
A 6-page Furniture Retail Dashboard in Google Sheets with 18 pivot-backed charts, 15 slicers and an Order ID lookup covering order value, units, margin and lead time.
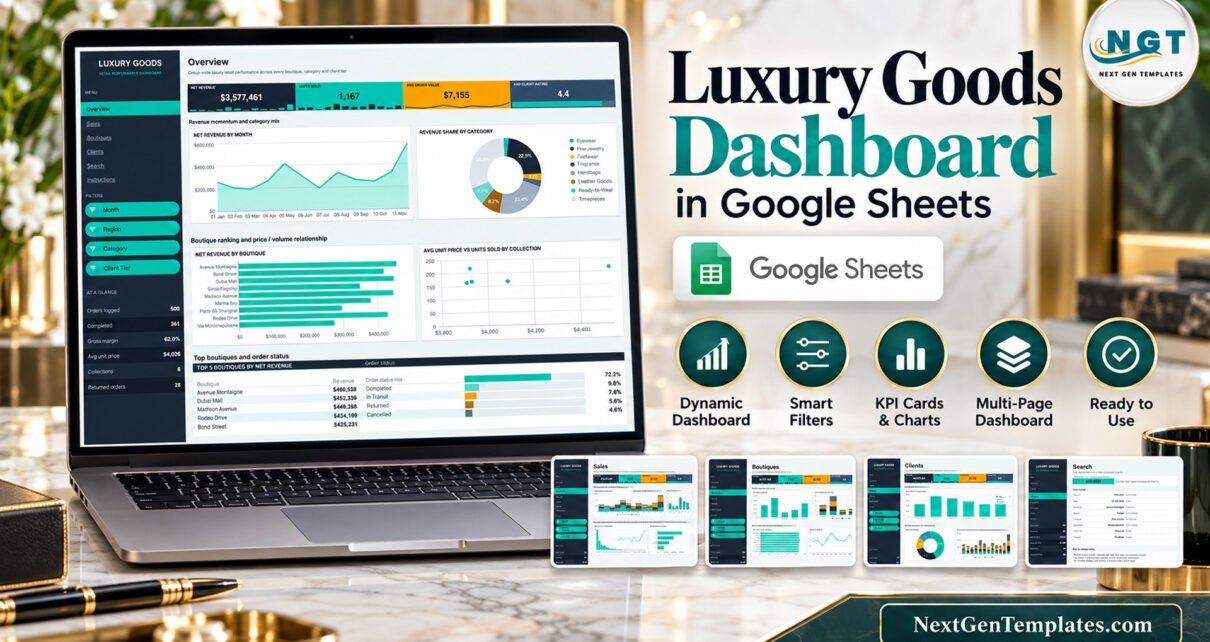
A six-page Luxury Goods Dashboard in Google Sheets with 4 KPI tiles, 16 pivot-backed charts, 15 filter chips and an Order ID search page. Room for 1,000 orders.
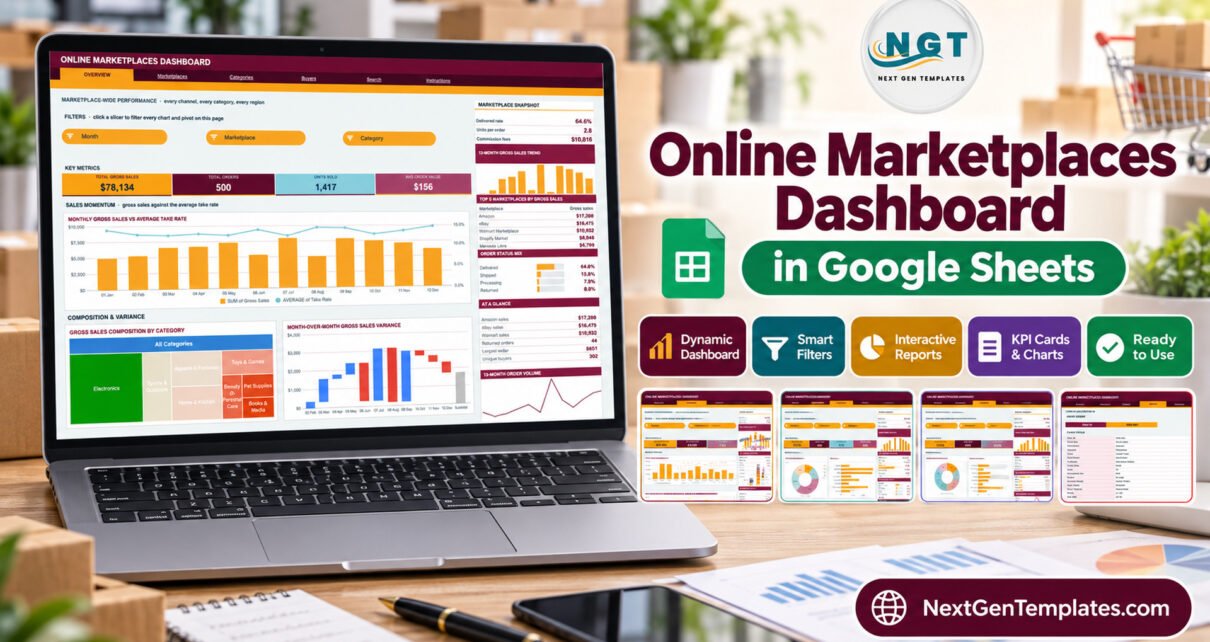
A six-tab Google Sheets dashboard that puts 8 marketplaces, 8 categories, 5 regions and 3 buyer segments on the same axes – 16 KPI cards, 18 charts and 15 native slicers over your own pasted order export.
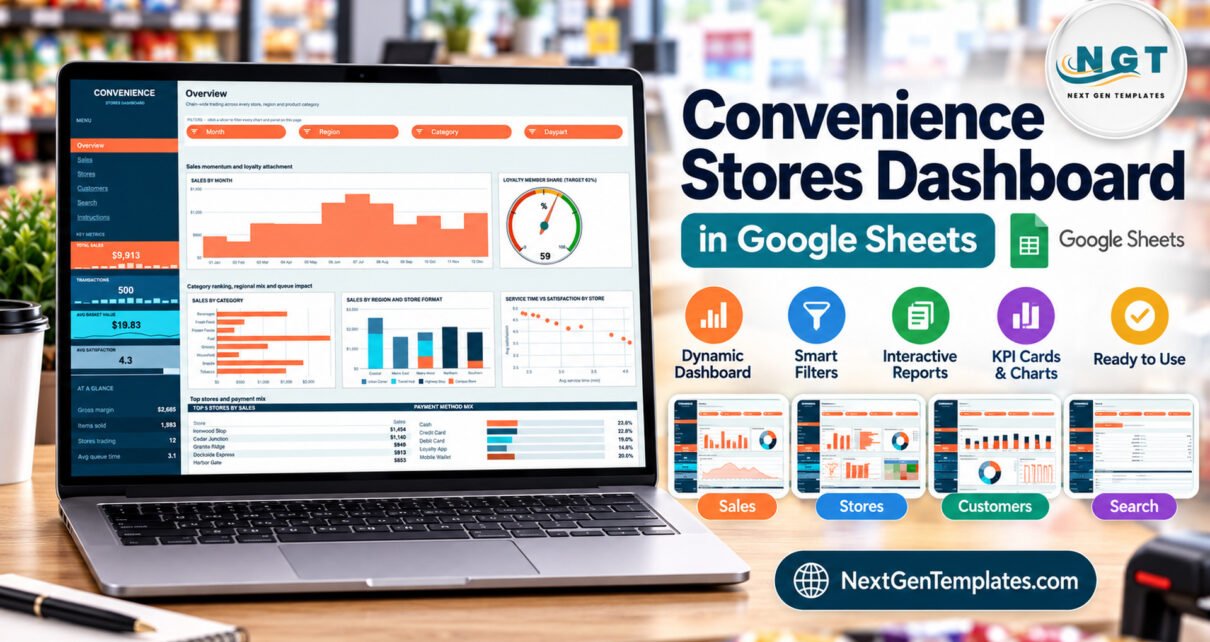
A seven-tab Google Sheets dashboard for convenience store chains: 500 sample transactions, 18 charts and 15 slicers covering sales, margin, store formats, service time, satisfaction and loyalty, with an honest note on what it is not.
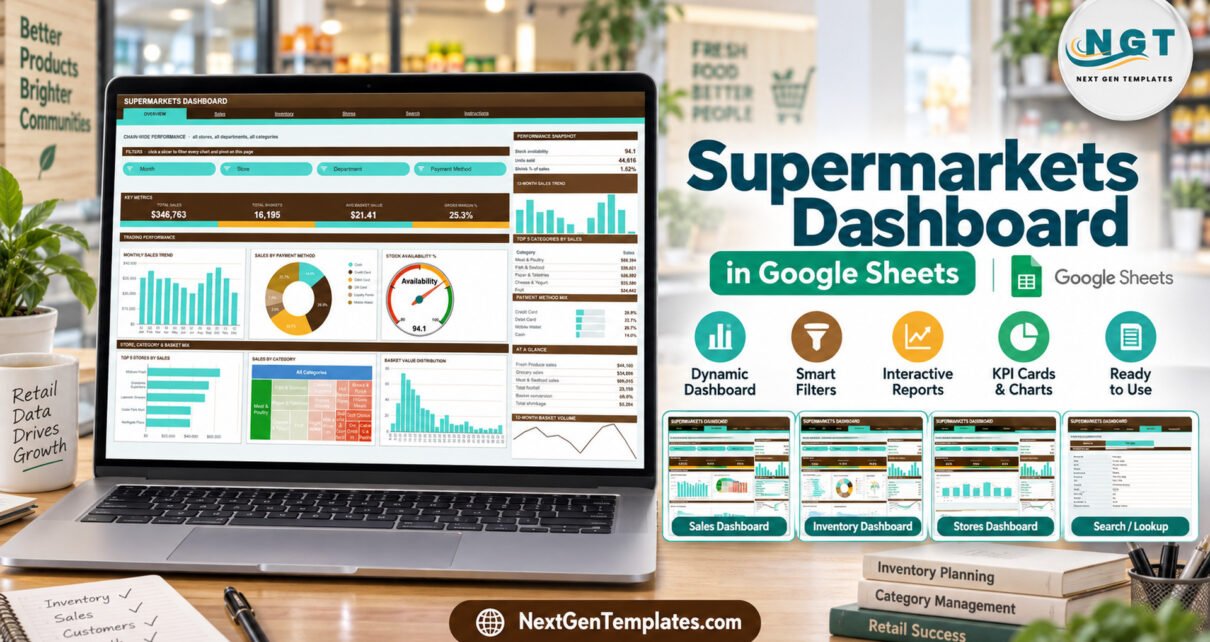
A six-page Google Sheets dashboard for supermarket sales logs: 500 fictional sample records, 18 charts and 15 slicers covering sales, departments, suppliers, stock availability, shrinkage and store footfall, with a clear note on what it is not.
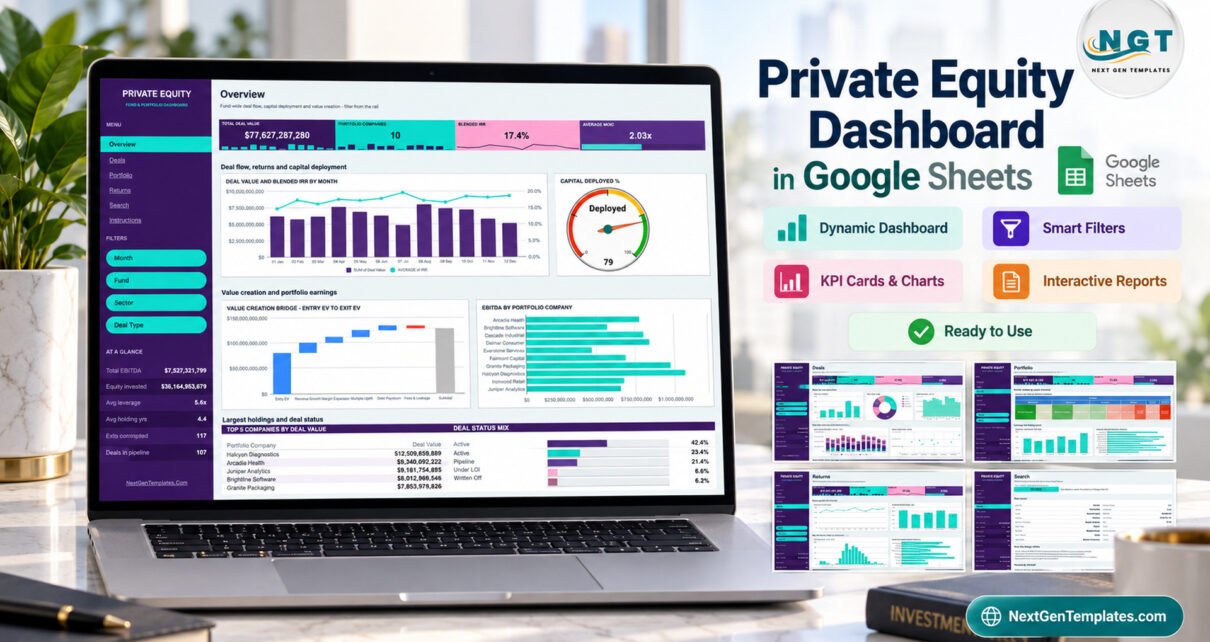
A six-page Private Equity Dashboard in Google Sheets with 500 sample deals, 16 charts, 15 slicers, IRR and MOIC views, a value creation bridge and a Deal ID search page.
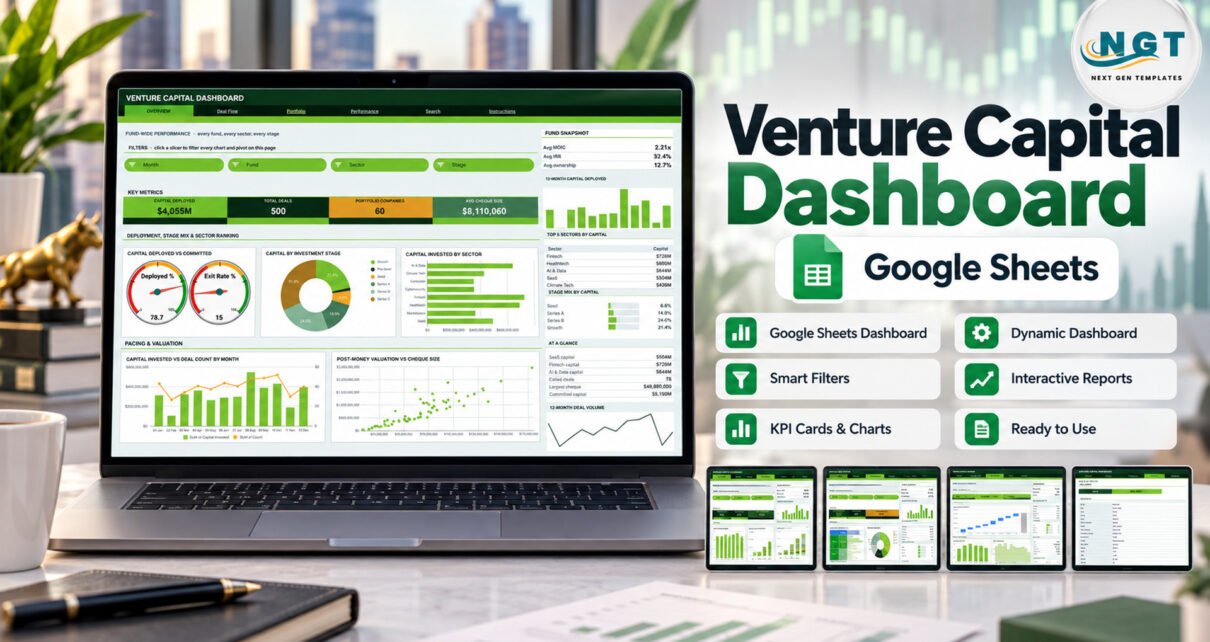
A six-page Venture Capital Dashboard in Google Sheets with 16 KPI cards, 18 chart panels and 15 slicers covering capital deployed, deal flow, portfolio composition, MOIC and IRR from a 1,000-row deal log.