Google Sheets

Dynamic Map in Google Sheets

Google Sheets is a powerful tool for managing data and creating visualizations. One of its advanced features is the ability to create dynamic maps. A dynamic map in Google Sheets allows you to visualize data in an interactive, map-based format that updates based on user input. This can be incredibly useful for tracking sales performance, […]


Google Sheets

How to Create Dynamic Dashboards in Google Sheets

In today’s fast-paced data-driven world, businesses need efficient tools to analyze and visualize information quickly. Google Sheets is one such tool that offers both flexibility and functionality when it comes to data management and visualization. One of its powerful features is the ability to create dynamic dashboards, which help decision-makers track performance, trends, and other […]

Google Sheets

ROUND Function in Google Sheets for Precise Calculations

Google Sheets is a powerful tool for data analysis and manipulation, and one of the most commonly used functions is the ROUND Function in Google Sheets. This function allows users to round numbers to a specified number of decimal places, making it an invaluable tool for ensuring precision in calculations. Whether you’re working with financial […]

Google Sheets

Create a Professional Report in Google Sheets in Under 5 Minutes

Creating professional reports quickly and efficiently is a crucial skill in the modern workplace. Whether you’re working with data from marketing, sales, HR, or any other department, knowing how to craft a professional report in under 5 minutes can save you a lot of time and energy. Google Sheets is an excellent tool for this […]

Google Sheets

Master Google Sheets in Minutes with These Life-Changing Tips

Google Sheets has become one of the most widely used tools for organizing data, performing calculations, and collaborating with others. Whether you’re a beginner looking to get started or an advanced user aiming to refine your skills, these life-changing tips will help you master Google Sheets in no time. In this article, we will cover […]

Google Sheets

Social Media Performance Dashboard in Google Sheets

In today’s digital world, measuring social media performance is critical for businesses and influencers alike. One of the most efficient ways to track and analyze your social media metrics is by using a Social Media Performance Dashboard in Google Sheets. This powerful tool helps you monitor the impact of your posts, track audience engagement, and […]

Google Sheets

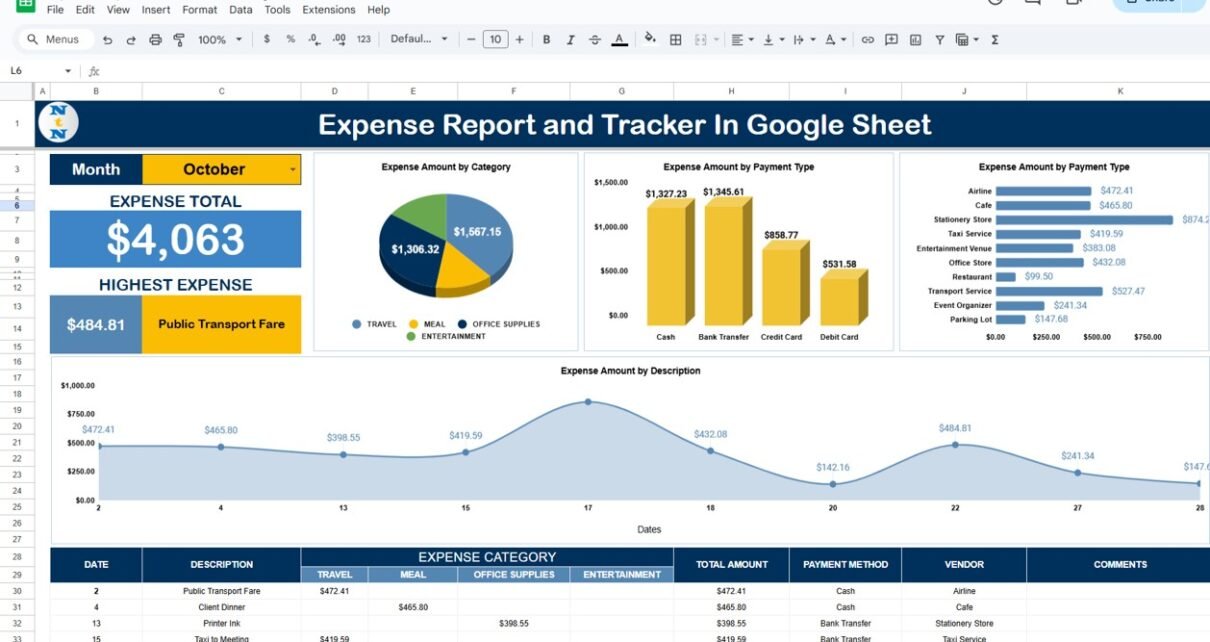
Expense Report and Tracker In Google Sheet

Managing personal or business finances can often feel overwhelming, but with the right tools, you can streamline the process. One such tool is Google Sheets, which can be used to create a detailed Expense Report and Tracker In Google Sheet. In this article, we will guide you through creating a Google Sheets-based Expense Report and […]

Google Sheets

HR Efficiency Monitor Dashboard in Google Sheets

In today’s ever-changing business world, HR departments are under constant pressure to streamline processes and make data-driven decisions. As businesses grow, the need for an efficient way to track employee performance, attendance, training hours, recruitment costs, and satisfaction becomes even more critical. This is where an HR Efficiency Monitor Dashboard proves to be an essential […]

Google Sheets

Employee Productivity Dashboard in Google Sheets

Tracking employee productivity is crucial for every organization. A clear and concise way to do this is by using a well-organized dashboard. In this article, we will explain how to create an Employee Productivity Dashboard in Google Sheets that not only makes it easy to visualize key metrics but also helps improve overall performance by […]

Google Sheets

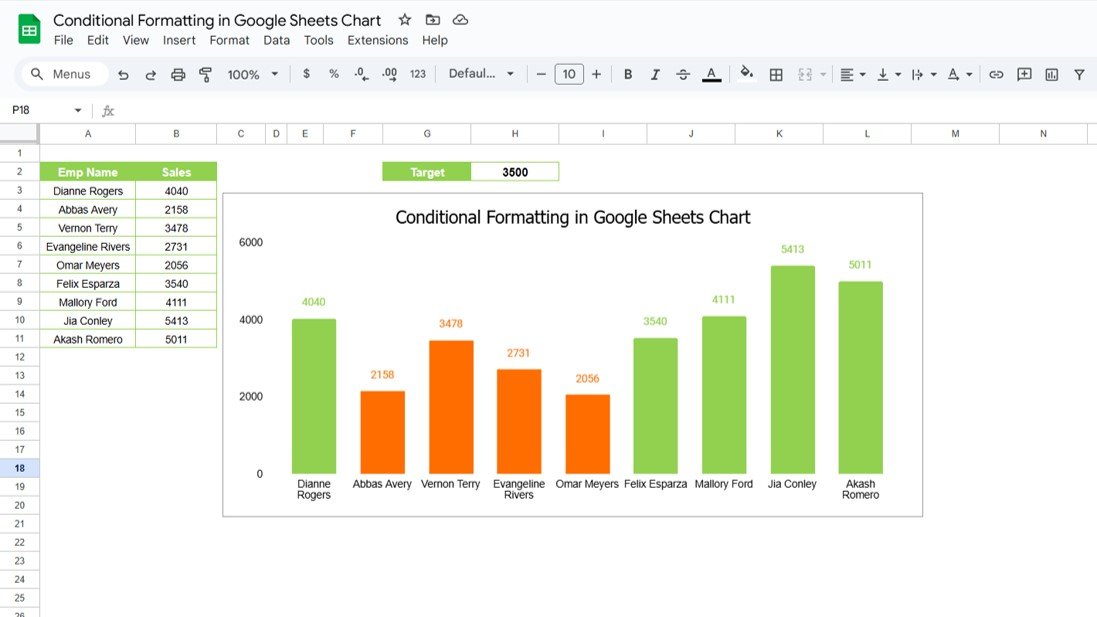
Conditional Formatting in Google Sheets Chart

Google Sheets offers a wide range of features to help you visualize and analyze data efficiently. One of the most powerful and visually appealing options is Conditional Formatting in Google Sheets Charts. By using conditional formatting, you can instantly highlight key data points, making it easier to interpret your data. In this article, we will […]