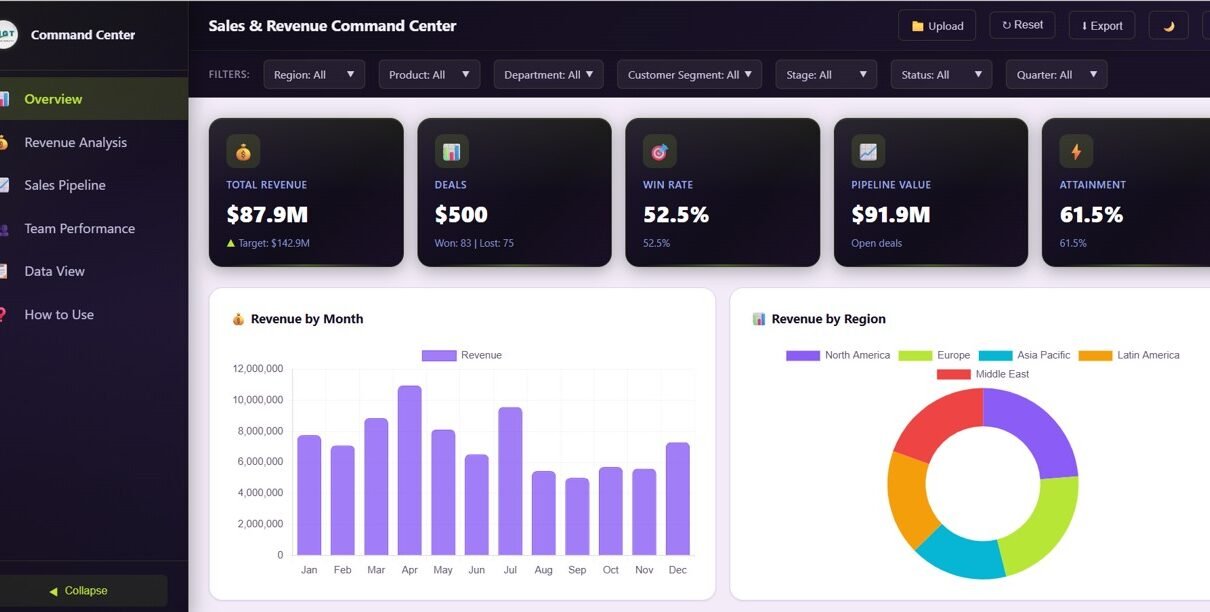
Sales and Revenue Command Center Dashboard in HTML – a browser-based interactive analytics template with 5 pages tracking total revenue, deals, win rate, pipeline value, attainment, and team performance.
Online Tutorial for Data Analysis and Automation
HTML Dashboard
Sales and Revenue Command Center Dashboard in HTML – a browser-based interactive analytics template with 5 pages tracking total revenue, deals, win rate, pipeline value, attainment, and team performance.
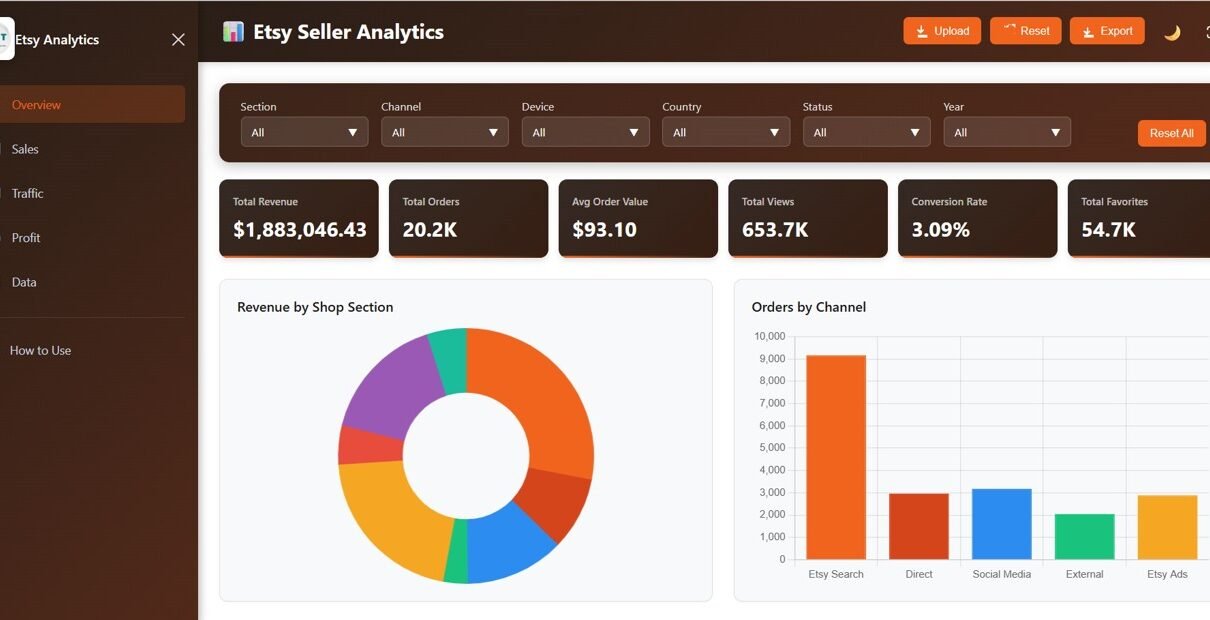
Explore the Etsy Seller Analytics Dashboard in HTML — a browser-based interactive dashboard with 5 pages, 6 KPIs, and 15+ charts to track revenue, orders, traffic, engagement, costs, and profitability for your Etsy shop.
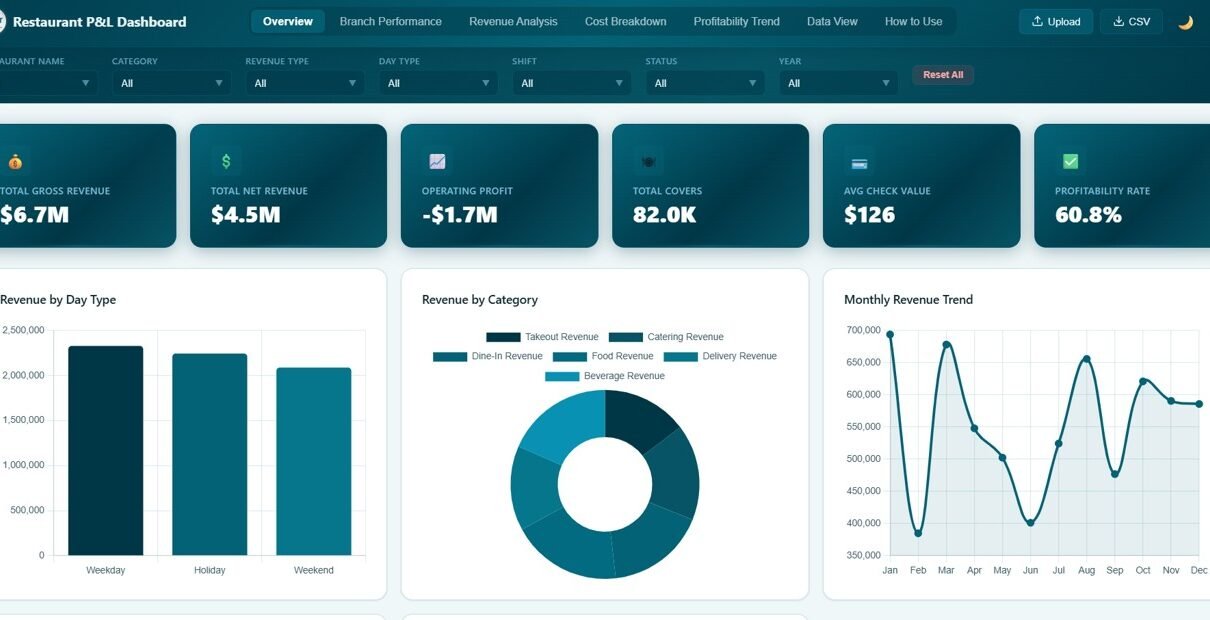
Restaurant Profit and Loss Dashboard in HTML with 5 interactive pages tracking gross revenue, net revenue, operating profit, branch performance, revenue analysis, cost breakdown, and data view with CSV export.
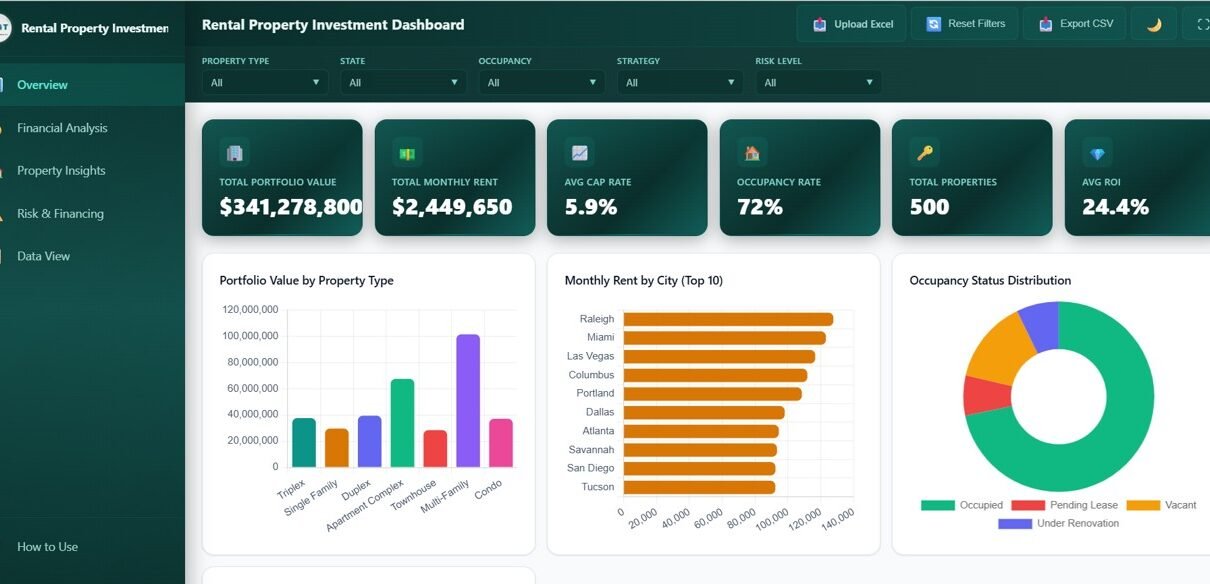
Rental Property Investment Dashboard in HTML with 5 interactive pages for portfolio overview, financial analysis, property insights, risk and financing, and data view. Track Total Portfolio Value, Monthly Rent, Cap Rate, Occupancy, ROI, and more.
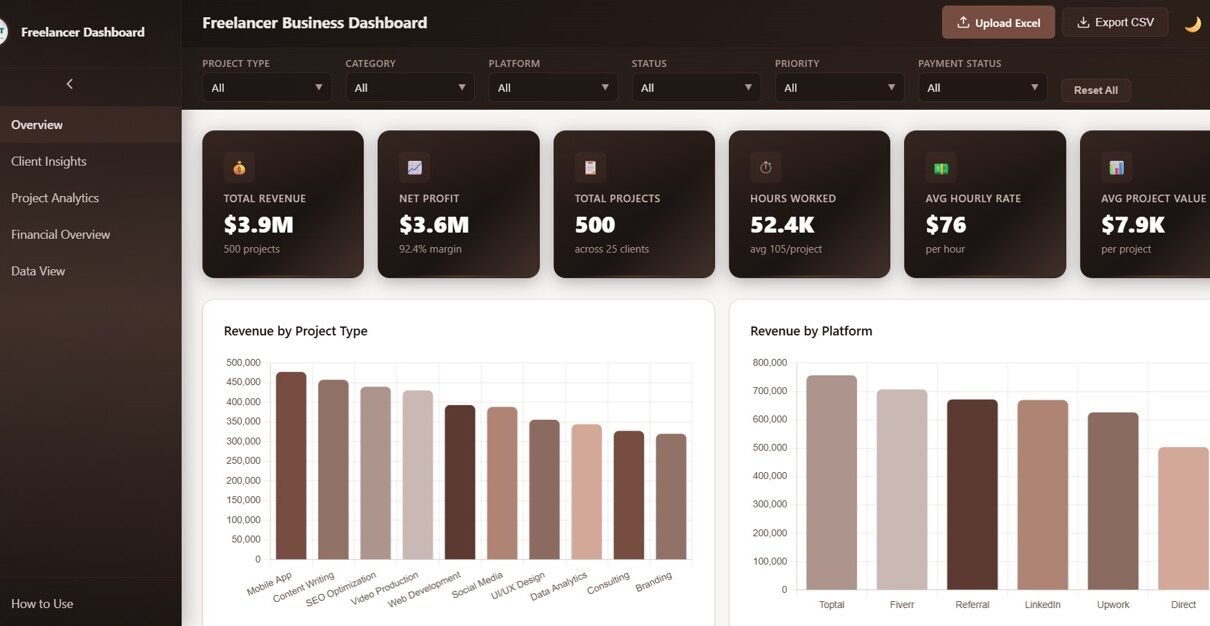
Freelancer Business Dashboard in HTML with 5 interactive pages tracking revenue, projects, clients, financial performance, and data view with CSV export.
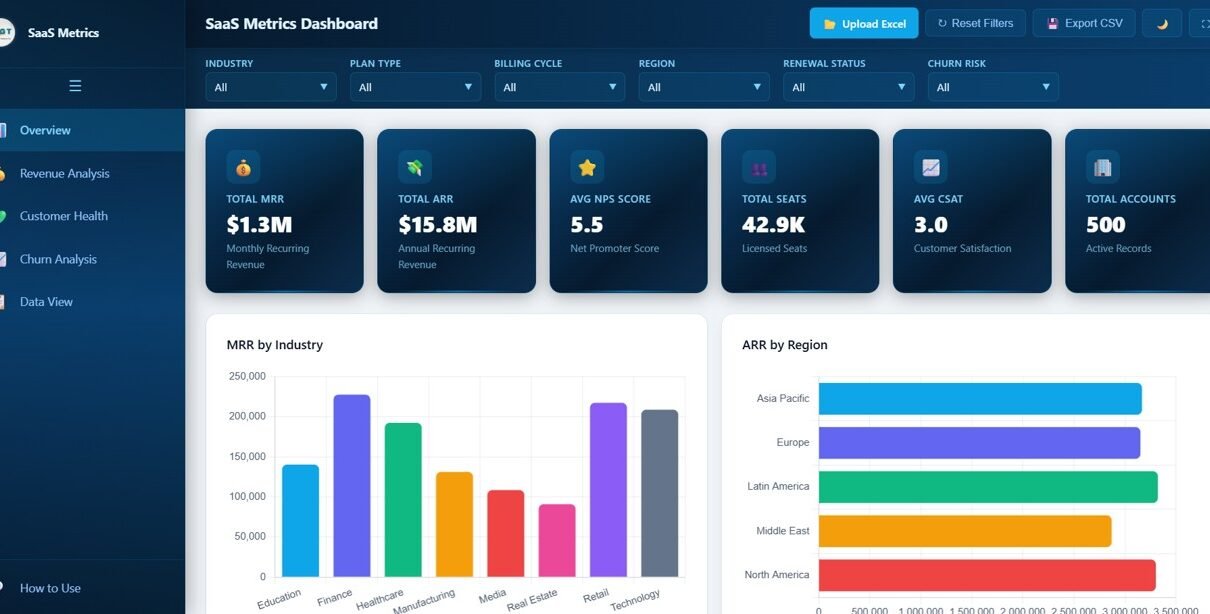
SaaS Metrics Dashboard in HTML with 5 interactive pages tracking MRR, ARR, NPS, CSAT, churn risk, and renewal status. Browser-based, zero installation required.
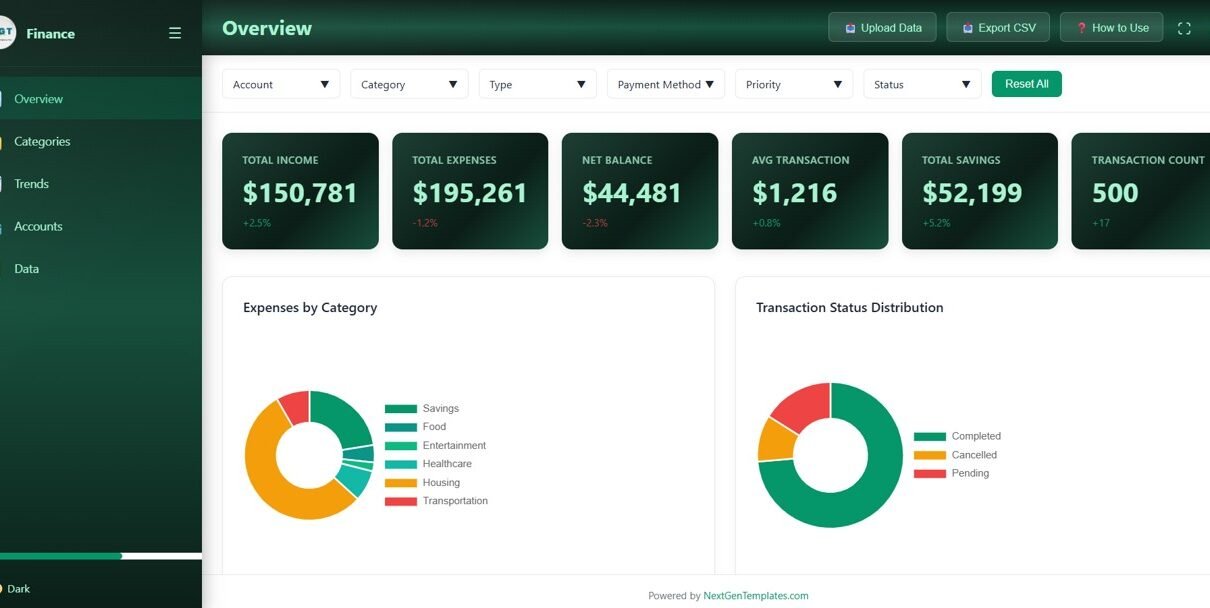
Personal Finance Dashboard in HTML with 5 interactive pages, 6 KPI cards, category analysis, trends, account insights, and data view for comprehensive finance tracking.
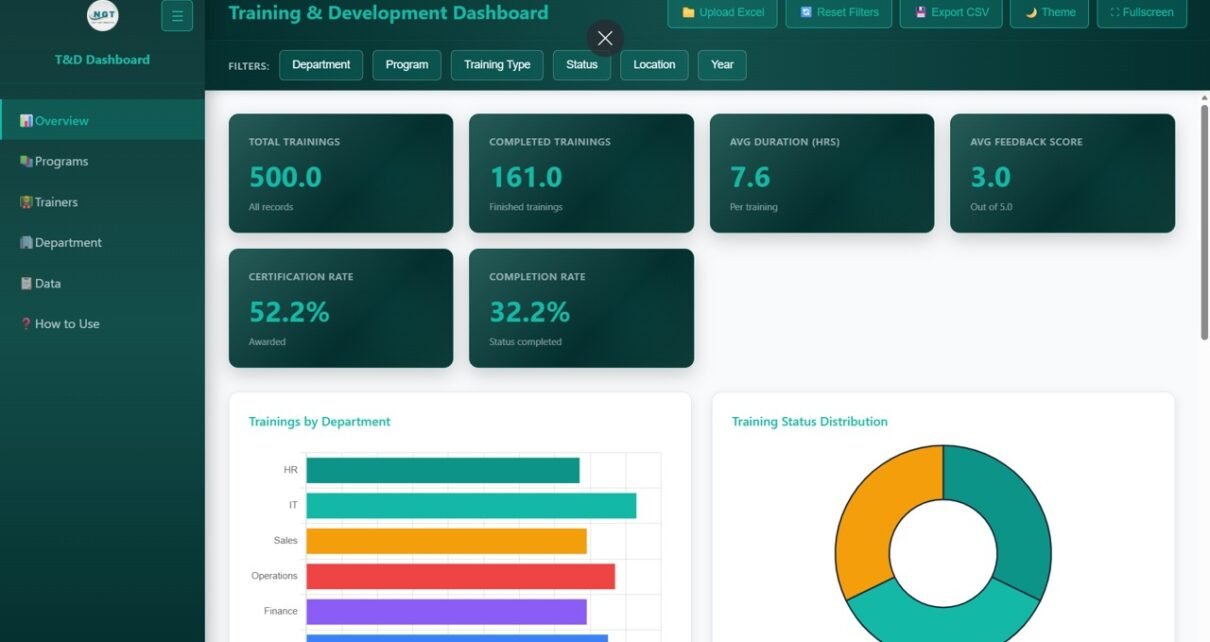
Training and Development Dashboard in HTML is an interactive browser-based analytics template with 5 dashboard pages, 6 KPI cards, and 15+ charts for tracking training programs, trainer performance, and certifications.
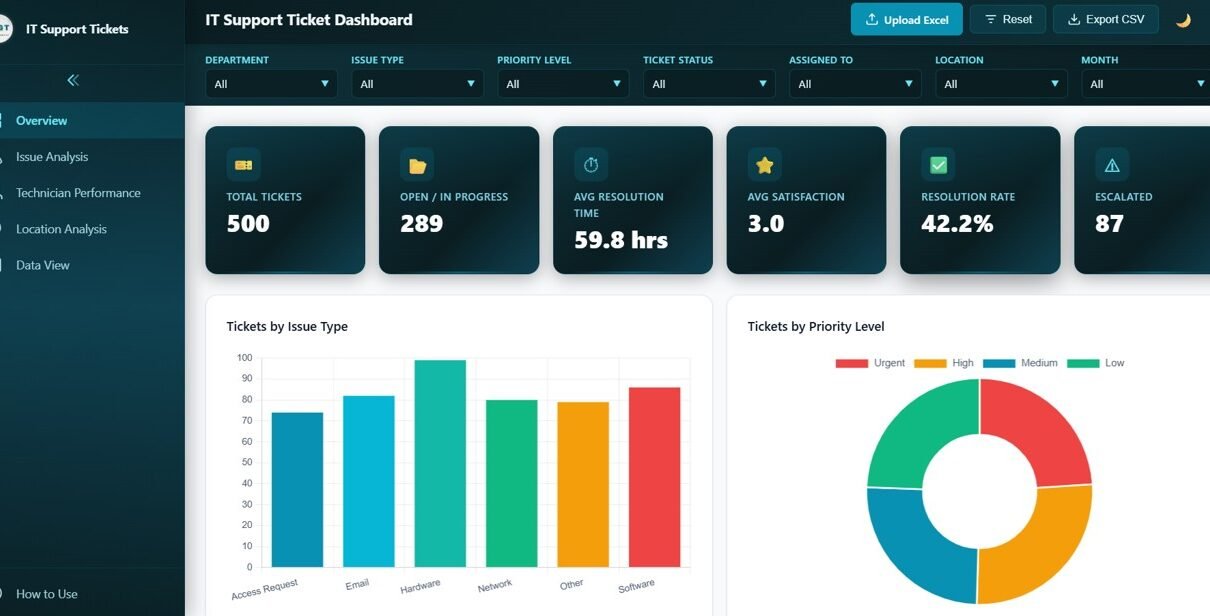
IT Support Ticket Dashboard in HTML – track tickets, resolution times, technician performance, satisfaction scores, and location analysis with 5 interactive pages and 6 KPI cards.
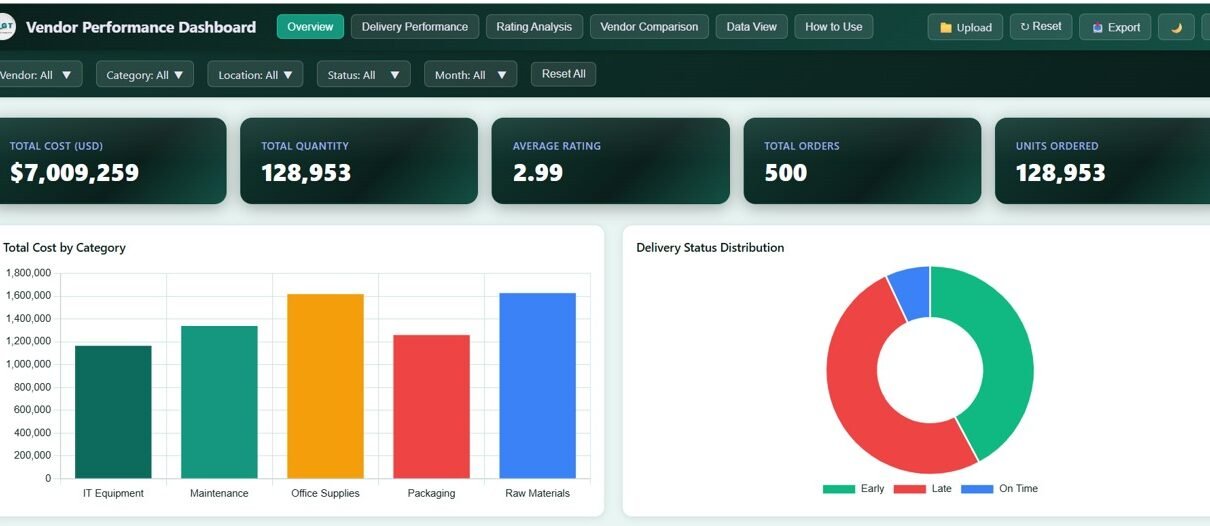
Track vendor costs, delivery performance, quality ratings, and vendor comparisons with the Vendor Performance Dashboard in HTML. 5 interactive pages with KPI cards, dynamic filters, and CSV export.