Marketing teams invest significant budgets across multiple channels, regions, and campaigns. However, without a clear performance view, it becomes difficult to understand which campaigns actually deliver value. Many organizations still rely on fragmented reports that fail to connect spend with revenue.
That is exactly why a Marketing ROI Dashboard in Google Sheets becomes a powerful and essential analytics tool.
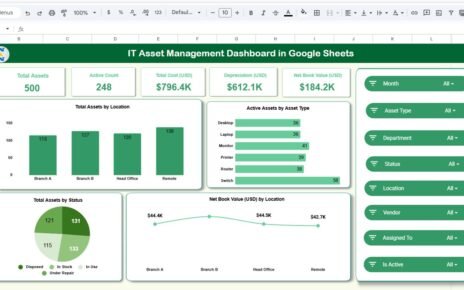
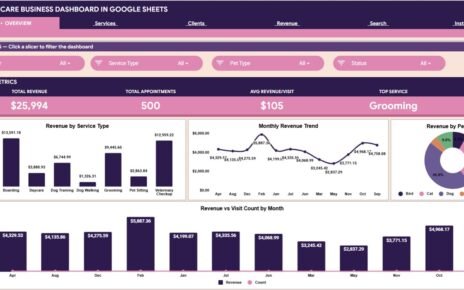
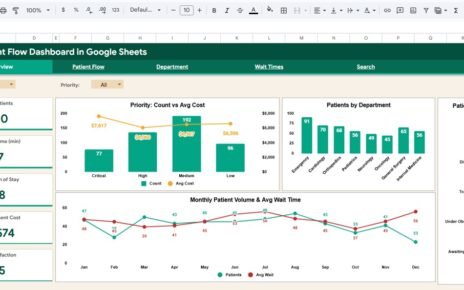
This ready-to-use dashboard helps marketing teams, growth managers, and leadership track campaign performance, spending efficiency, and return on investment using a single, interactive Google Sheets dashboard.
In this article, we explain how the dashboard works, its structure, charts, benefits, and best practices.
What Is a Marketing ROI Dashboard in Google Sheets?
Click to Buy Marketing ROI Dashboard in Google Sheets
A Marketing ROI Dashboard is a centralized reporting tool that measures how effectively marketing spend converts into revenue. Instead of reviewing separate campaign and finance reports, teams can instantly see performance metrics in one place.
Because the dashboard runs in Google Sheets, it offers:
-
Real-time updates
-
Easy collaboration across teams
-
Automatic calculations and charts
-
Cloud-based access
-
No additional BI or marketing software cost
This dashboard suits digital marketers, performance marketers, marketing analysts, and executives.
Key Features of the Marketing ROI Dashboard
This dashboard is ready to use and structured for fast insights. It includes an Overview sheet, multiple analysis sections, and a data input foundation.
Overview Sheet Tab – Marketing Performance Snapshot
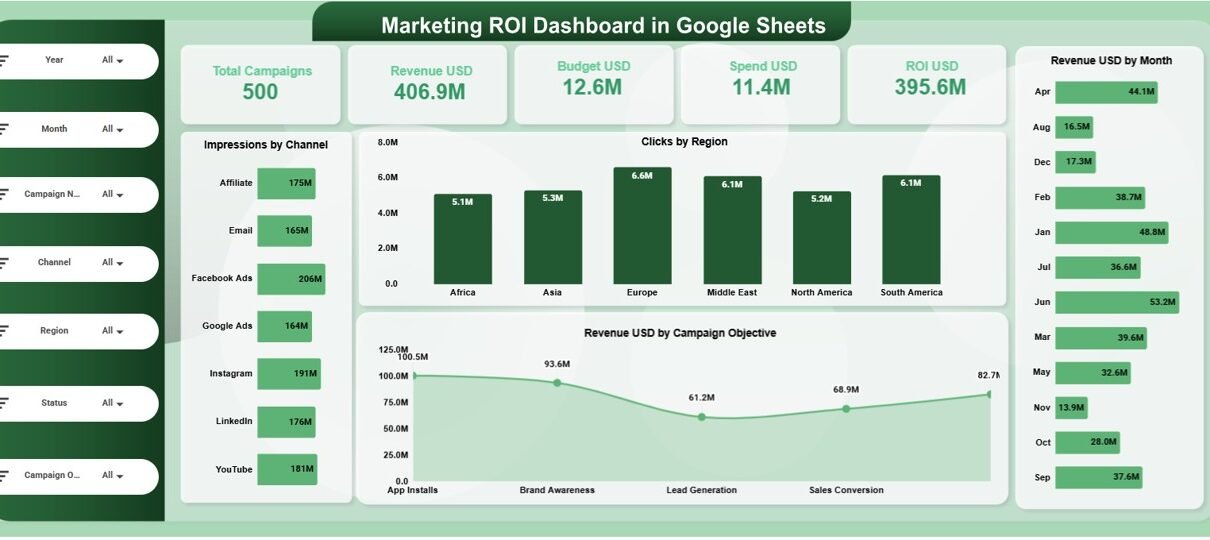
The Overview Sheet provides a high-level summary of marketing activity using KPI cards and visual charts.
KPI Cards on the Dashboard
-
Total Campaigns – Number of active and completed campaigns
-
Revenue USD – Total revenue generated from campaigns
-
Budget USD – Planned marketing budget
-
Spend USD – Actual marketing spend
-
ROI USD – Return on investment calculated from revenue and spend
These cards allow leadership to instantly assess marketing effectiveness.
Charts in the Overview Section
Click to Buy Marketing ROI Dashboard in Google Sheets
Impressions by Channel
Shows where brand visibility comes from, such as social, search, email, or display.
Clicks by Region
Highlights audience engagement across different geographic regions.
Revenue USD by Month
Shows monthly revenue contribution from marketing campaigns.
Revenue USD by Campaign Objective
Compares revenue performance by campaign goal, such as awareness, lead generation, or conversions.

Click to Buy Marketing ROI Dashboard in Google Sheets
Channel Analysis
This section evaluates marketing performance by channel.
Charts Included:
-
Impressions by Channel
-
Clicks by Channel
-
Budget USD by Channel
-
Revenue USD by Channel
It helps marketers identify high-performing and low-performing channels.

Click to Buy Marketing ROI Dashboard in Google Sheets
Region Analysis
This section focuses on regional marketing performance.
Charts Included:
-
Impressions by Region
-
Clicks by Region
-
Budget USD by Region
-
Revenue USD by Region
It supports regional budget optimization and targeting strategy.

Campaign Analysis
This section analyzes campaign performance based on objectives.
Charts Included:
-
Impressions by Campaign Objective
-
Clicks by Campaign Objective
-
Budget USD by Campaign Objective
-
Revenue USD by Campaign Objective
It helps teams align spend with business outcomes.

Click to Buy Marketing ROI Dashboard in Google Sheets
Monthly Trends Analysis
This section shows how marketing performance changes over time.
Charts Included:
-
Impressions by Month
-
Clicks by Month
-
Revenue USD by Month
-
Budget USD by Month
It helps marketers track seasonality, campaign timing, and performance consistency.

Data Input Sheet (Foundation)
The Data Sheet powers the entire dashboard.
Typical columns include:
- Campaign Name
- Campaign Objective
- Channel
- Region
- Month
- Impressions
- Clicks
- Budget USD
- Spend USD
- Revenue USD
Once data is updated, all cards and charts refresh automatically.
Why Organizations Need a Marketing ROI Dashboard
Click to Buy Marketing ROI Dashboard in Google Sheets
Without a centralized ROI dashboard, marketing decisions rely on assumptions. This dashboard helps organizations:
-
Track marketing spend effectiveness
-
Compare budget vs revenue clearly
-
Identify profitable channels and campaigns
-
Improve future campaign planning
-
Support data-driven marketing decisions
A single dashboard replaces guesswork with insight.
Advantages of the Marketing ROI Dashboard
-
Centralized marketing performance tracking
-
Clear visibility into ROI
-
Channel-wise, region-wise, and campaign-wise insights
-
Monthly trend analysis
-
Easy collaboration in Google Sheets
-
Cost-effective and scalable solution
Opportunities for Improvement
Click to Buy Marketing ROI Dashboard in Google Sheets
You can enhance this dashboard further by adding:
-
Cost per click (CPC) and cost per lead (CPL)
-
Conversion rate metrics
-
Attribution model analysis
-
Forecasted ROI projections
-
Automated data imports from ad platforms
These improvements deepen marketing intelligence.
Best Practices for Using the Dashboard
-
Update campaign data regularly
-
Standardize channel and campaign naming
-
Review ROI monthly
-
Shift budget toward high-ROI campaigns
-
Share insights with sales and leadership teams
-
Control edit access to protect data accuracy
Conclusion
Click to Buy Marketing ROI Dashboard in Google Sheets
A Marketing ROI Dashboard in Google Sheets provides a simple yet powerful way to measure marketing effectiveness, optimize budgets, and maximize revenue impact. It replaces scattered reports with a single source of truth, improves transparency, and supports smarter marketing decisions. Because it is ready to use and cloud-based, teams can start tracking ROI immediately.
For organizations focused on performance-driven marketing, this dashboard becomes an essential analytics tool.
Frequently Asked Questions (FAQs)
1. Who should use this dashboard?
Marketing teams, growth managers, analysts, and executives.
2. Can it track multiple channels and regions?
Yes, it supports unlimited channels and regions.
3. Is the dashboard customizable?
Yes, all KPIs, charts, and fields can be modified.
4. Can it help optimize marketing spend?
Yes, ROI and budget comparisons highlight inefficiencies.
5. Is Google Sheets secure for marketing data?
Yes, with proper sharing permissions.
6. Does it require advanced technical skills?
No, basic Google Sheets knowledge is enough.
Visit our YouTube channel to learn step-by-step video tutorials
Youtube.com/@NeotechNavigators