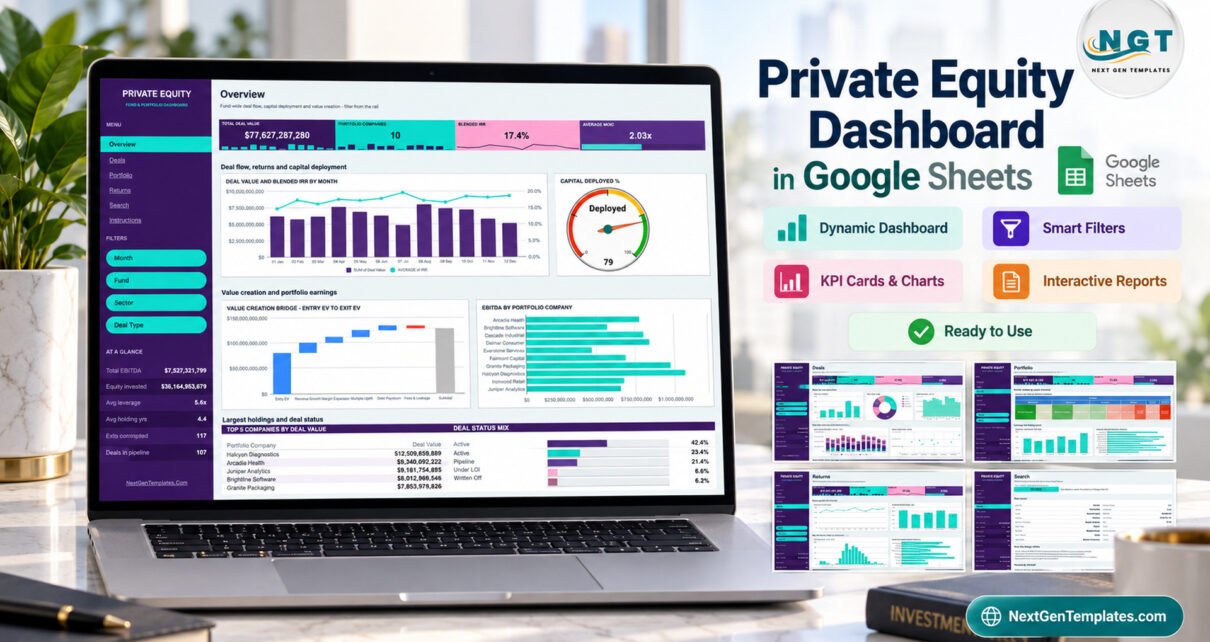
The Private Equity Dashboard in Google Sheets is a six-page fund and portfolio report built on a 500-row sample deal register with 18 data columns. It has 16 charts, 15 slicers, four headline KPI tiles and a Deal ID Search page, and its pivots read up to 1,000 deals. The fictional sample book spans 5 funds, 10 portfolio companies, 6 sectors, 5 regions and 5 deal types across 2024.
Most deal teams keep their deal log in a spreadsheet long before they buy fund software. The hard part is turning that log into answers: which funds carry the most deal value, how leverage differs by sector, how long companies have been held and how returns are spread. This template does that inside Google Sheets, with native pivot tables and slicers and no scripts.
Get the Private Equity Dashboard in Google Sheets
Key Features of the Private Equity Dashboard in Google Sheets
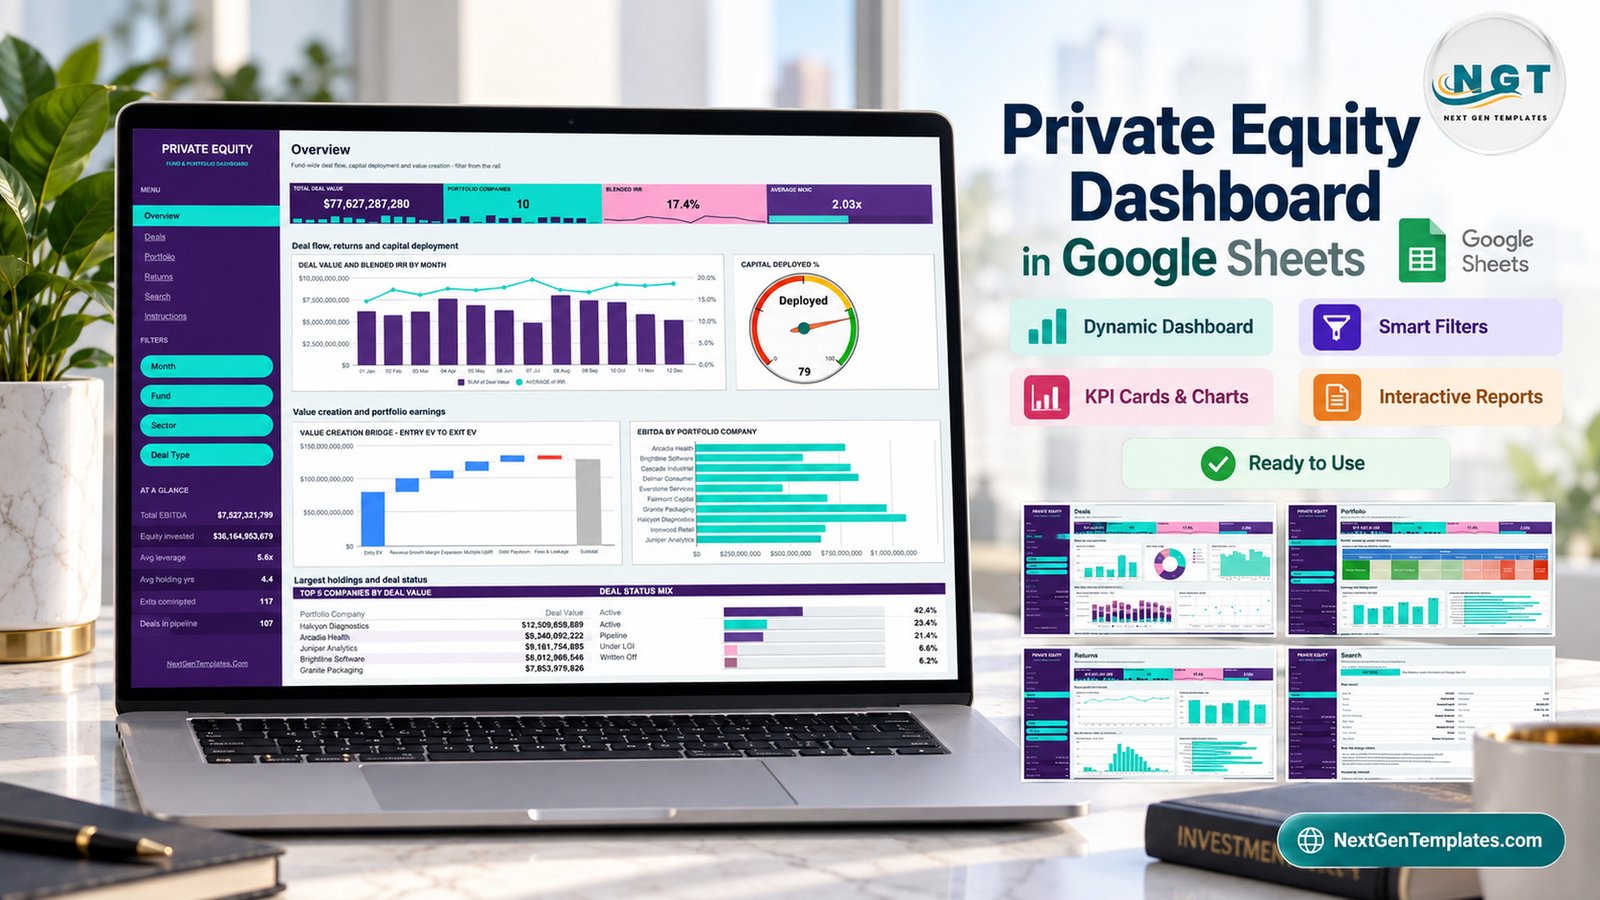
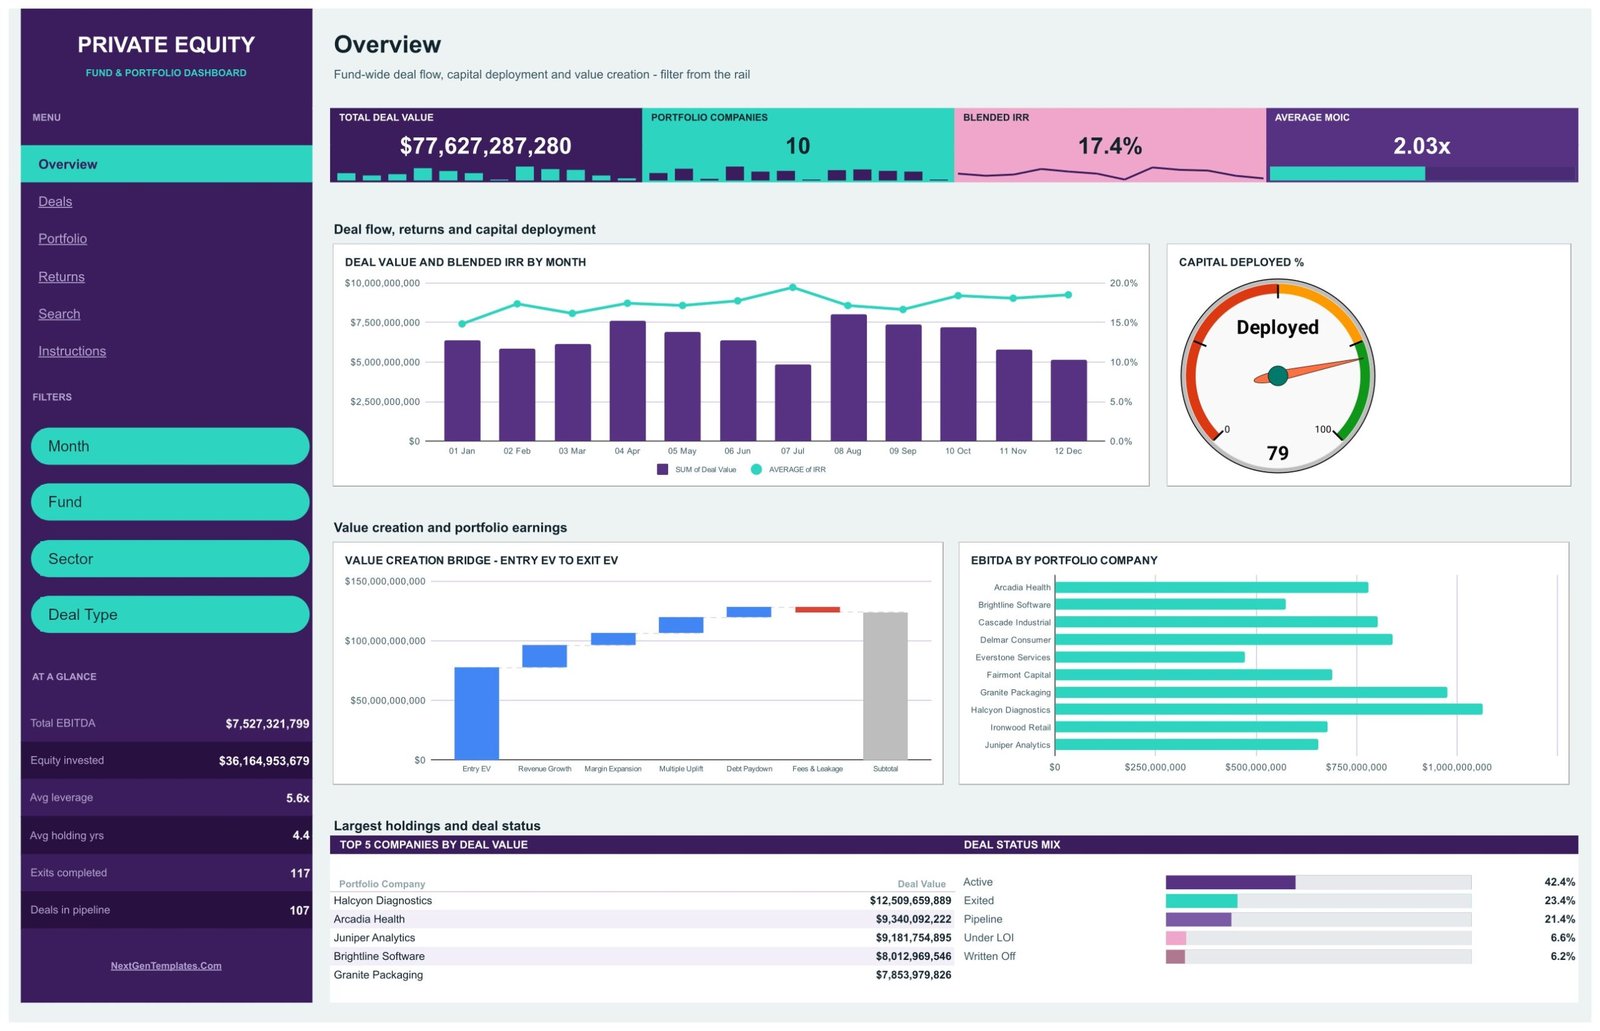
- Four KPI tiles on every analysis page: Total Deal Value ($77,627,287,280 in the sample), Portfolio Companies (10), Blended IRR (17.4%) and Average MOIC (2.03x).
- A left navigation rail with page links, per-page slicers and an AT A GLANCE list: Total EBITDA, Equity Invested, Avg Leverage (5.6x), Avg Holding Years (4.4), Exits Completed (117) and Deals in Pipeline (107).
- Fifteen slicers across Overview, Deals, Portfolio and Returns, covering Month, Fund, Sector, Deal Type, Region, Deal Status and Exit Route. Each page keeps its own filter state.
- Pivot-driven charts: every chart reads a pivot table placed to the right of its page, starting at column Z. You can learn more in Google’s guide to pivot tables in Google Sheets.
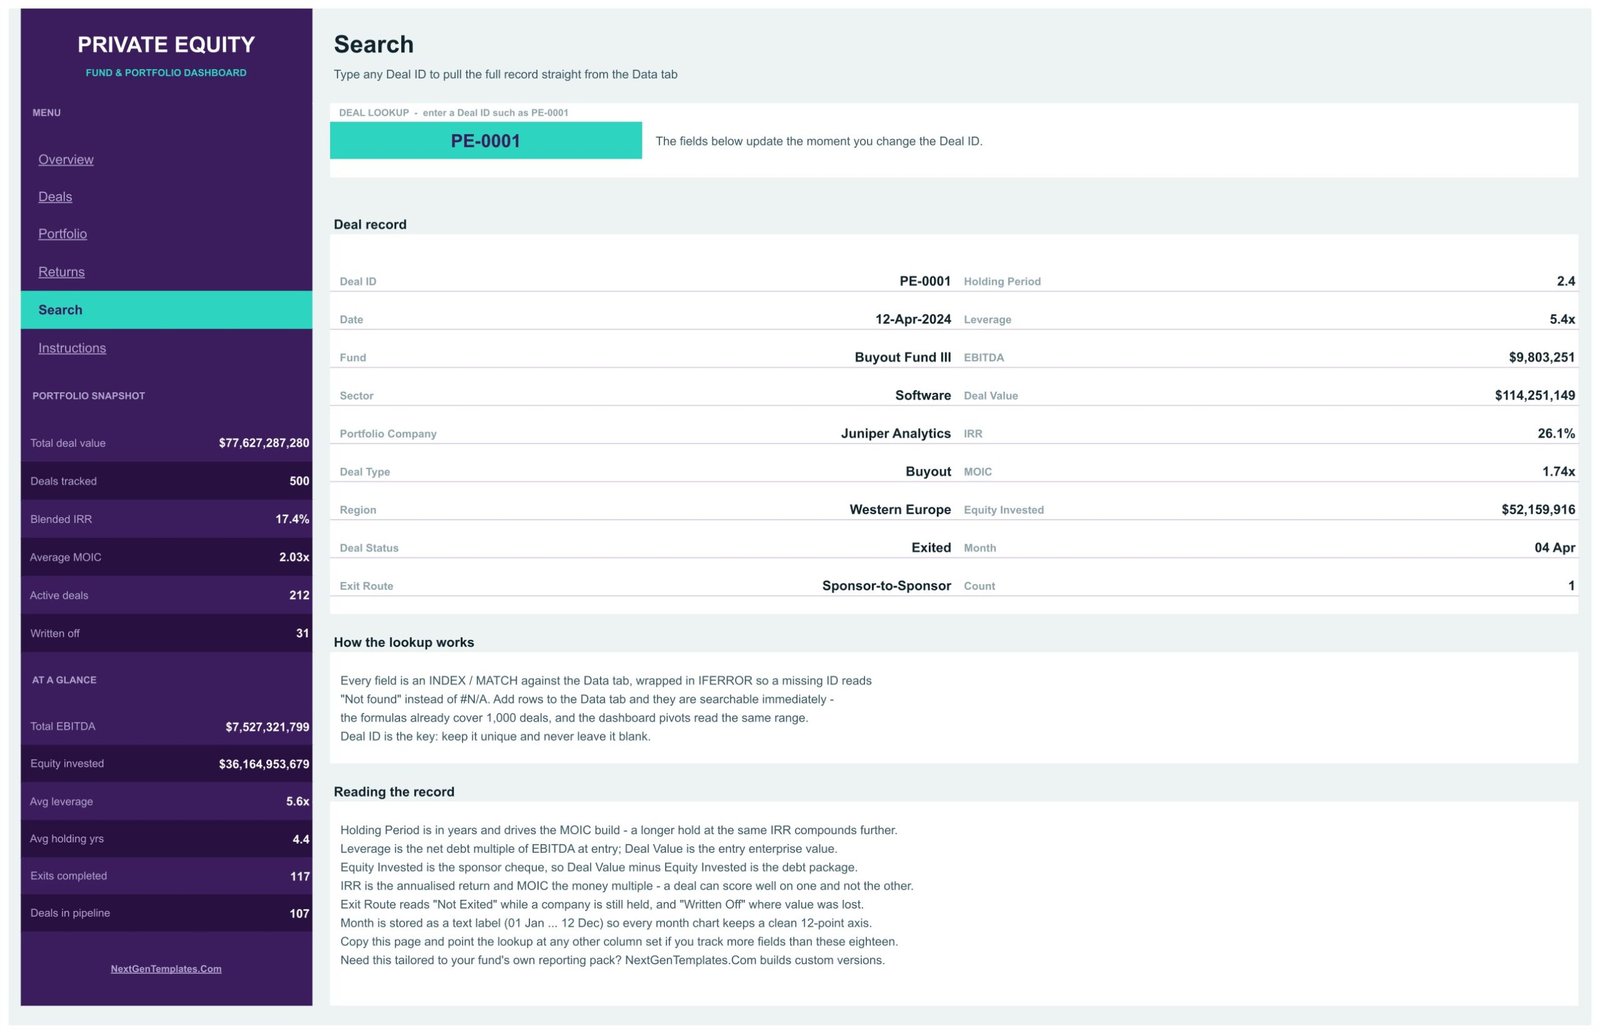
- A Deal ID lookup that returns all 18 fields of one deal and shows “Not found” instead of an error for an unknown ID.
Dashboard Pages Explanation
Page 1: Overview
The Overview shows fund-wide deal flow, capital deployment and value creation. Charts include Deal Value and Blended IRR by Month, a Capital Deployed % gauge, a Value Creation Bridge from Entry EV to Exit EV (revenue growth, margin expansion, multiple uplift, debt paydown, fees and leakage) and EBITDA by Portfolio Company. Below them sit a Top 5 Companies by Deal Value table, led by Halcyon Diagnostics, and a Deal Status Mix: Active 42.4%, Exited 23.4%, Pipeline 21.4%, Under LOI 6.6% and Written Off 6.2%.
Page 2: Deals
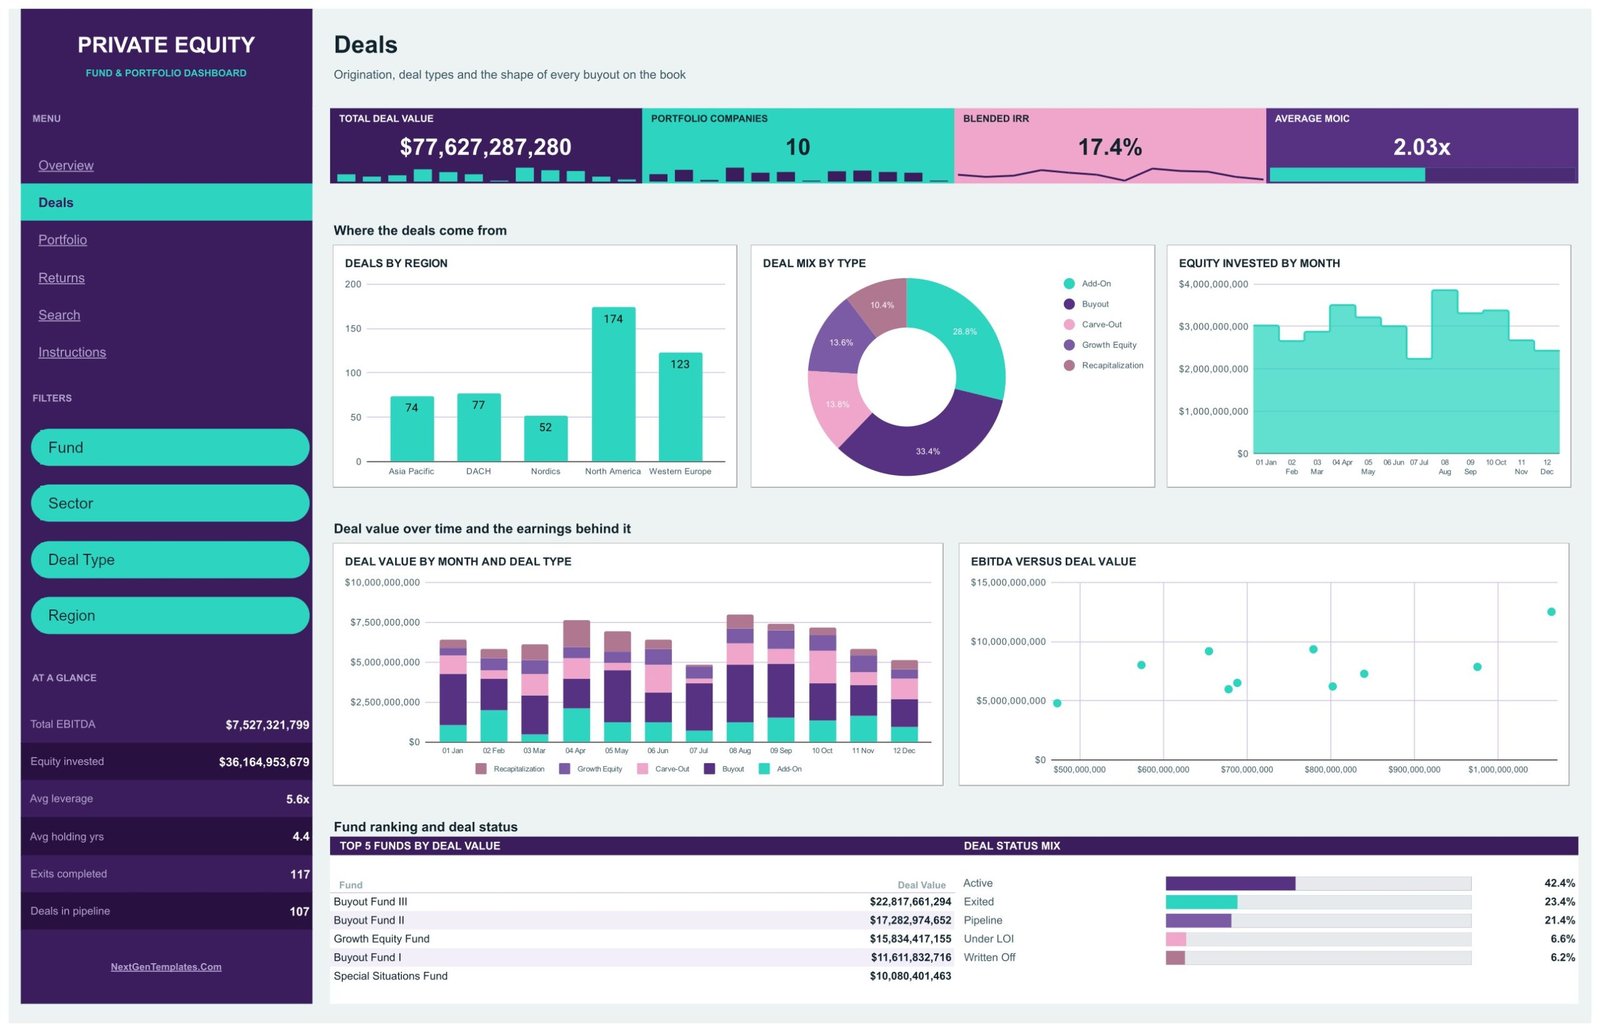
The Deals page covers origination and deal shape. Deals by Region shows North America leading with 174 deals, ahead of Western Europe (123), DACH (77), Asia Pacific (74) and the Nordics (52). Deal Mix by Type splits Buyout (33.4%), Add-On (28.8%), Carve-Out (13.8%), Growth Equity (13.6%) and Recapitalization (10.4%). Equity Invested by Month, Deal Value by Month and Deal Type, and EBITDA versus Deal Value complete the page, with a Top 5 Funds by Deal Value table led by Buyout Fund III.
Page 3: Portfolio
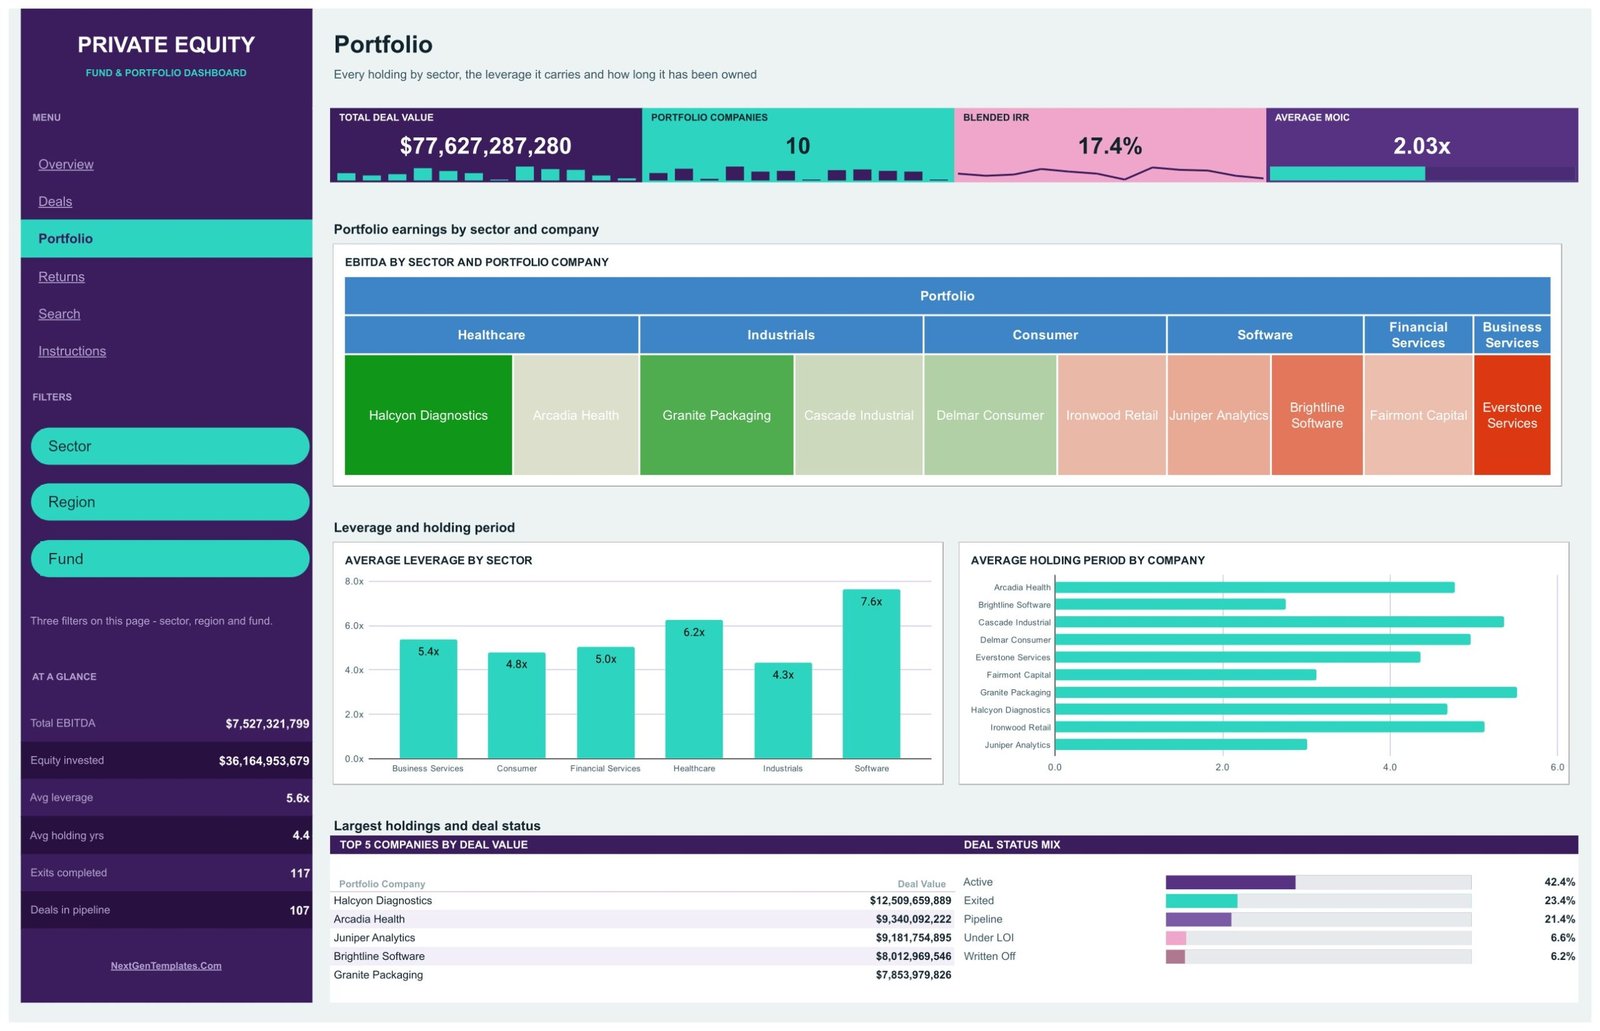
The Portfolio page shows every holding by sector. A treemap sizes EBITDA by Sector and Portfolio Company across Healthcare, Industrials, Consumer, Software, Financial Services and Business Services. Average Leverage by Sector runs from 4.3x in Industrials to 7.6x in Software, and Average Holding Period by Company shows how long each business has been owned.
Page 4: Returns
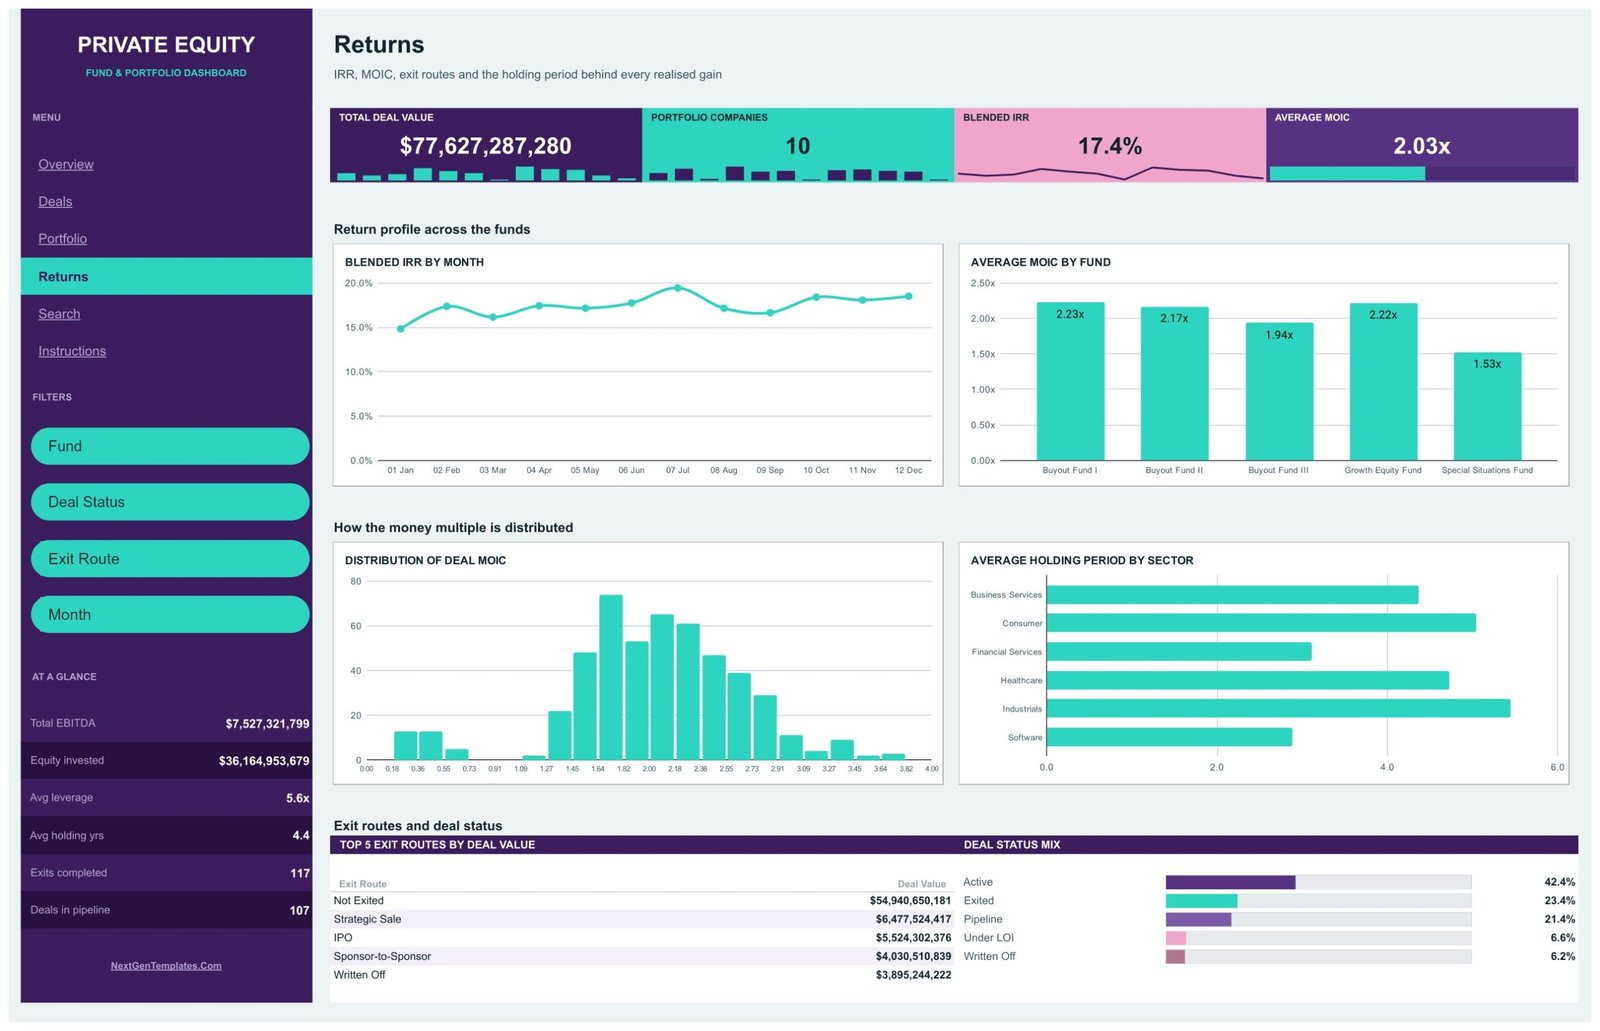
The Returns page shows Blended IRR by Month, Average MOIC by Fund (from 1.53x for the Special Situations Fund to 2.23x for Buyout Fund I), the Distribution of Deal MOIC and Average Holding Period by Sector. A Top 5 Exit Routes by Deal Value table lists Not Exited, Strategic Sale, IPO, Sponsor-to-Sponsor and Written Off.
Page 5: Search
Type a Deal ID such as PE-0001 and the page shows its date, fund, sector, company, deal type, region, status, exit route, holding period, leverage, EBITDA, deal value, IRR, MOIC, equity invested and month. The rail on this page adds a Portfolio Snapshot: 500 deals tracked, 212 active and 31 written off.
Page 6: Instructions
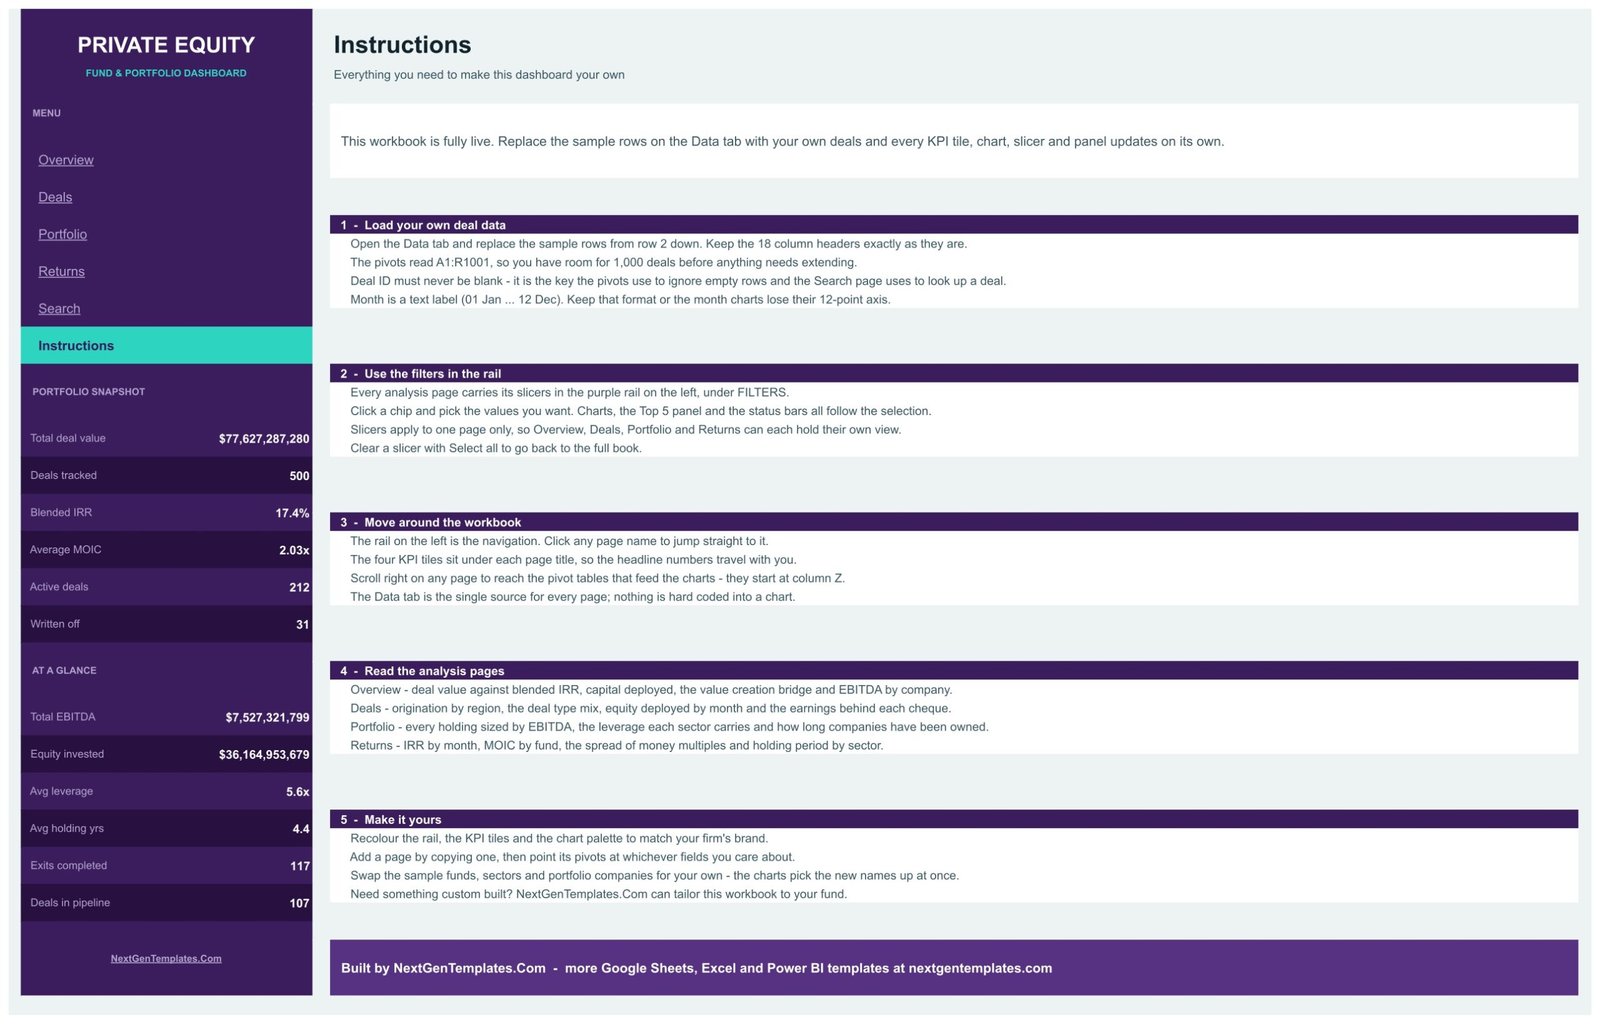
Five steps explain how to load your own deal data, use the slicers, move around the workbook, read each analysis page and restyle the file for your firm.
Private Equity Dashboard in Google Sheets vs. Microsoft Excel Dashboard vs. Paid Fund Software — Feature Comparison
| Feature | This Google Sheets dashboard | Microsoft Excel Dashboard | Paid PE platforms (e.g. Allvue, eFront) |
|---|---|---|---|
| Cost | ✅ $9.99 one-time | One-time template plus an Excel licence | Quote-based annual subscription |
| Platform | ✅ Any browser with a Google account | Excel desktop | Vendor web app |
| Setup time | ✅ Minutes: paste your deals | Minutes | Weeks of onboarding |
| Real-time team collaboration | ✅ Yes, Google Sheets sharing | Via OneDrive or SharePoint | Yes |
| Mobile access | ✅ Google Sheets app | Excel mobile app | ✅ Yes |
| Customizable fields | ✅ Fully editable | ✅ Fully editable | Within vendor limits |
| Fund accounting, capital calls and LP reporting | No | No | ✅ Yes |
| Live data feeds and audited valuations | No, manual data entry | No | ✅ Typically |
| Year-1 cost at 5 users | ✅ $9.99 total | Template plus licences | Custom enterprise pricing |
For deal teams and analysts who want a clear deal-level picture without buying fund administration software, this template sits in the sweet spot.
Who Should Use This Template
Perfect for:
- Analysts and associates who keep a deal log and need charts by fund, sector and region
- Emerging managers, search funds and family offices preparing a portfolio summary
- Finance students and trainers teaching IRR, MOIC, leverage and holding period
Not a fit if:
- You need fund accounting, distribution waterfalls, carried interest or capital-call tracking
- You need audited valuations, cash-flow IRR, a live data feed, ILPA-format LP reports or SEC reporting
Real-World Use Cases
Maya is an associate at a mid-market buyout firm. Before the Monday pipeline meeting she filters the Deals page by Region and Deal Type to show how many add-ons sit in North America and which funds carry the most deal value. The Top 5 Funds table gives her the talking points.
Daniel runs a single-family office with direct stakes. He uses the Portfolio page to compare average leverage by sector and holding periods by company, then shares the Returns page with his investment committee as a view-only link.
Priya teaches a private equity elective. Her students use the Search page to see how leverage, equity invested, IRR and MOIC sit together on a single deal, then change a row and watch the charts move.
Advantages of the Private Equity Dashboard
- Low cost: a one-time $9.99 instead of a per-seat subscription.
- Fast setup: paste deals over the sample rows and every pivot redraws.
- Shareable: Google Sheets sharing and view-only links work out of the box.
- Transparent: no scripts or hidden add-ons, so every number can be traced to a pivot table.
- Easy to extend: copy a page and point its pivots at other fields.
Opportunities for Improvement
This is a reporting template on sample data, and a few design choices are worth knowing before you rely on it:
- KPI tiles are whole-book totals. The built-in Instructions say the charts, Top 5 panels and status bars follow the slicers. The KPI tiles and the AT A GLANCE rail are not listed, so treat them as whole-book figures.
- IRR and MOIC are averages of deal rows. Blended IRR (17.4%) and Average MOIC (2.03x) average the deal-level columns. They are not a pooled cash-flow IRR, and the sample also gives pipeline and LOI deals IRR and MOIC values.
- EBITDA adds up deal records. Each company appears on many deal rows, so EBITDA by Portfolio Company and Total EBITDA add up those records. That is not one year’s reported EBITDA.
- Illustrative bridge and gauge. The Data tab has no exit-value column, so check how the Value Creation Bridge and the Capital Deployed % gauge are calculated before you present them.
- Top 5 means five rows. Secondary Buyout, the sixth exit route, does not appear in the Returns table. Sponsor-to-Sponsor and Secondary Buyout are also kept as separate labels.
- Older handle in the PDF. The download PDF still links a hyphenated YouTube handle; the current channel is @PKAnExcelExpert.
Best Practices
- Keep every Deal ID unique and never blank, because the pivots and Search page depend on it.
- Keep Month as a text label from 01 Jan to 12 Dec so month charts keep a 12-point axis.
- Decide whether pipeline and LOI deals should carry IRR and MOIC before you quote the blended figures.
- Learn how slicers filter charts and tables so each page shows the view you intend.
- Share view-only copies with stakeholders and keep one master copy for data entry.
Explore Relevant Templates
- Private Equity KPI Dashboard in Google Sheets — a KPI-style private equity template on this blog.
- Private Equity KPI Scorecard in Google Sheets — monthly MTD and YTD KPI tracking.
- Wealth Management Dashboard in Google Sheets — AUM, fees and net flows by advisor.
- Investment Management Dashboard in Google Sheets — another investment reporting layout.
- Also on other platforms: the Private Equity Dashboard in Excel and the Private Equity Dashboard in Power BI, which are separate designs.
Venture Capital and Hedge Funds dashboards in Google Sheets are being prepared.
If you would like to learn how pivot-driven dashboards like this are built, the Excel Pivot Tables & Dashboards course on NextGenTemplates Academy works through it step by step with practice files.
Get the Private Equity Dashboard in Google Sheets
Frequently Asked Questions
What does the Private Equity Dashboard in Google Sheets track?
It tracks deal value, portfolio companies, blended IRR, average MOIC, EBITDA, equity invested, leverage, holding period, deal status and exit route across funds, sectors, regions and deal types. The sample holds 500 deals, and the pivots and Search page read up to 1,000 rows.
How long does setup take?
Setup is quick. Make a copy from the PDF link, paste your deals over the sample rows on the Data tab using the same 18 headers, and the pivots, charts and Search page pick up your rows. Keep Deal IDs unique and Month as a text label.
How does it compare with paid private equity software?
Paid platforms such as Allvue or eFront add fund accounting, LP reporting and valuation workflows on a subscription. This dashboard costs $9.99 once and covers deal-level reporting only, which suits analysts, smaller managers, family offices and training.
Is the IRR a true cash-flow IRR?
No. Blended IRR averages the IRR values stored on each deal row, and Average MOIC does the same for MOIC. The template does not calculate returns from dated cash flows, so it is not a source of audited performance.
Is this the same file as the Excel or Power BI version?
No. The Excel and Power BI private equity dashboards are separate builds whose listings focus on valuation, ownership and stage. This Google Sheets edition centres on leverage, EBITDA, deal type and exit route, with a Deal ID Search page.
Does it give investment advice or meet SEC or ILPA standards?
No. All companies, funds and figures are fictional sample data. The template is a reporting layout only. It gives no investment advice, has no live data feed and makes no SEC or ILPA compliance claim.
About the Author
Built by PK — Microsoft Certified Professional with 15+ years of Excel, Google Sheets and Power BI experience. Founder of NextGenTemplates, reaching 300K+ subscribers across YouTube channels. Every template is hand-built and tested before release.
Conclusion
If your deal log already lives in a spreadsheet, this dashboard turns it into a clear view of deal flow, portfolio leverage, holding periods and returns without a software subscription. Read the notes above on averaged IRR and summed EBITDA, then paste in your deals and start filtering.
✅ Instant download · One-time payment · No subscription
Last updated: September 2026