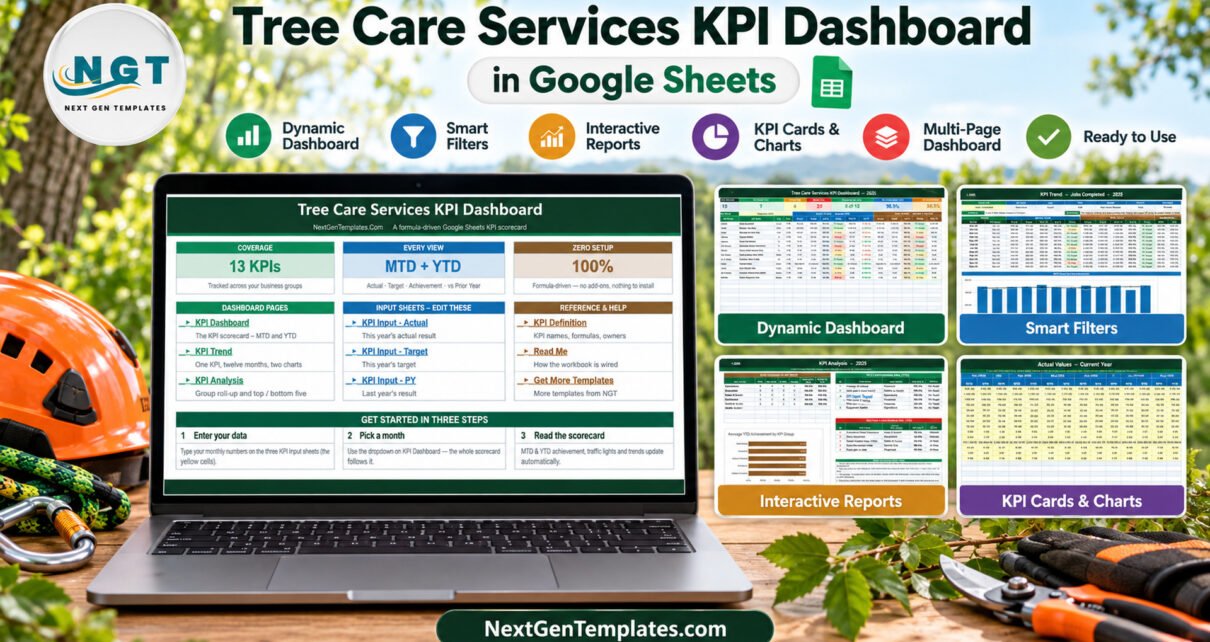
The Tree Care Services KPI Dashboard in Google Sheets tracks 13 key performance indicators for a tree removal, pruning and stump-grinding business in 5 groups, scores each one month-to-date and year-to-date against target and prior year, and turns the result into traffic lights on a single scorecard. In its September 2025 sample, 7 KPIs are On Target for the year, 4 are At Risk and 2 are Missed, with average achievement at 98.5% MTD and 98.8% YTD.
Tree care margins leak in places a job sheet never shows. A crew that spends half its paid day driving between sites, a bucket truck sitting in the shop, a written estimate nobody follows up, or a callback to rake up leftover chips all cost money without appearing as a single line item. This template gives owners and managers one monthly view of those numbers, built entirely from Google Sheets formulas, with no add-on and no Apps Script.
Get the Tree Care Services KPI Dashboard in Google Sheets
Key Features of the Tree Care Services KPI Dashboard in Google Sheets
This is a KPI Dashboard – the month-picker scorecard family with a KPI Trend page and a KPI Analysis page. It is not one of our analytical Google Sheets dashboards, and it is a separate product from the Tree Care Services KPI Scorecard in Google Sheets, which comes from our KPI Scorecard line and is still in preparation.
- 13 KPIs in 5 groups. Operations holds 4 (Jobs Completed, Crew Utilization, Equipment Uptime, Storm-Response Time), Financial holds 4 (Average Job Value, Revenue per Crew Hour, Total Revenue, Fuel Cost per Job), Safety & Quality holds 3 (Safety Incident Rate (TRIR), Callback / Rework Rate, Customer Satisfaction (CSAT)), and Sales & Growth and Workforce one each (Estimate-to-Close Conversion and a certified-arborist staffing ratio).
- One month picker. The dropdown on KPI Dashboard drives the scorecard, the seven summary cards and the KPI Analysis page. Nothing needs refreshing.
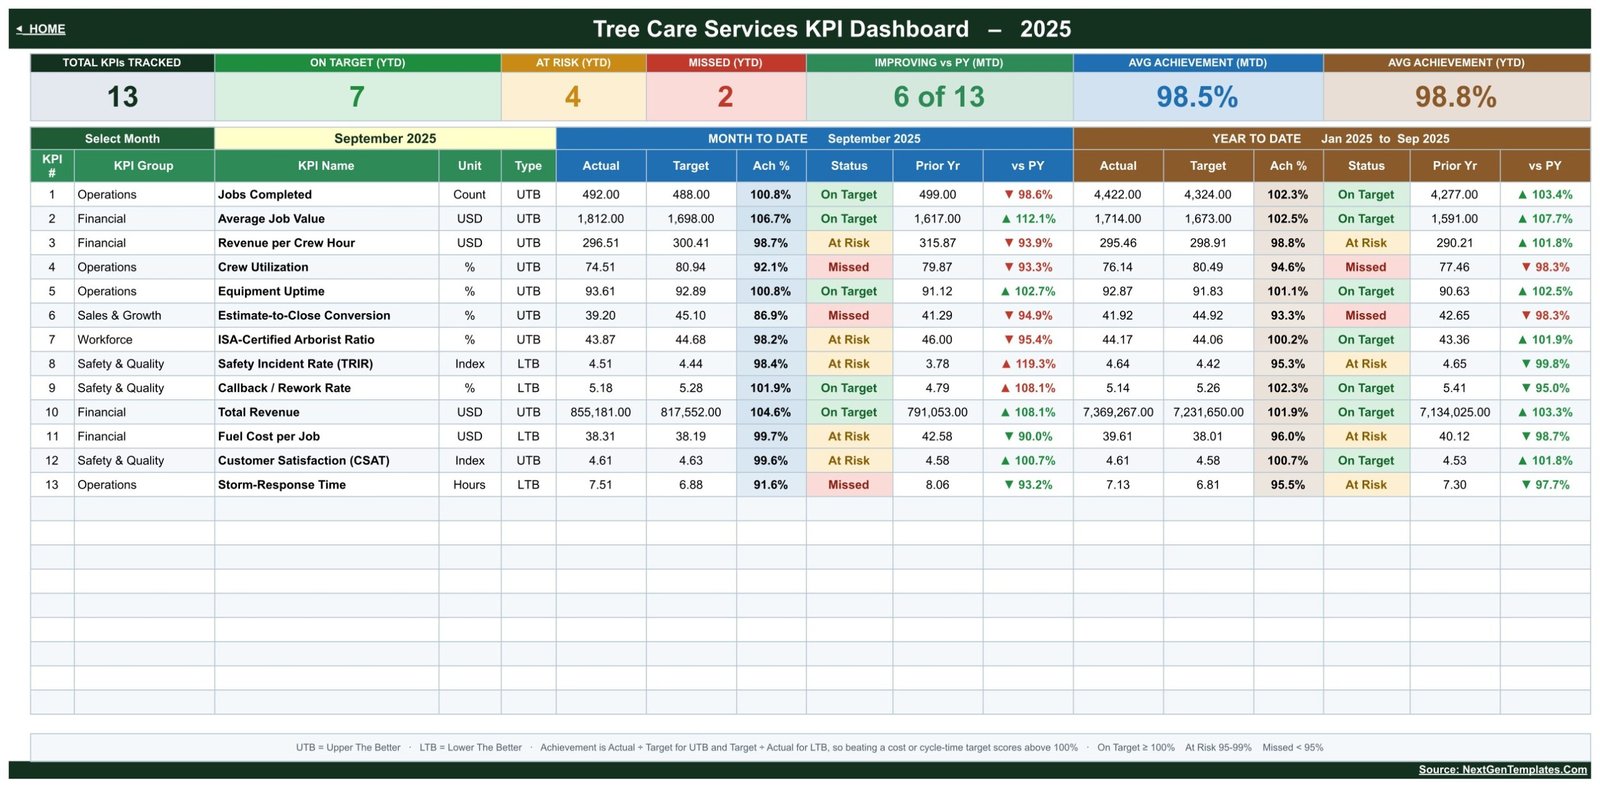
- Direction-aware achievement. 9 KPIs are upper-the-better and 4 are lower-the-better. Achievement is Actual ÷ Target for UTB and Target ÷ Actual for LTB, so beating a fuel-cost, rework or response-time target scores above 100%.
- Traffic lights with thresholds you control. On Target from 100%, At Risk from 95% to 99%, Missed below 95%, set in the Status formulas.
- Prior-year context. Every row carries last year’s value and a vs PY percentage with a colour-coded arrow.
- Room for 22 KPIs. 13 rows are filled and 9 are live and empty.
Dashboard Pages Explanation
Home
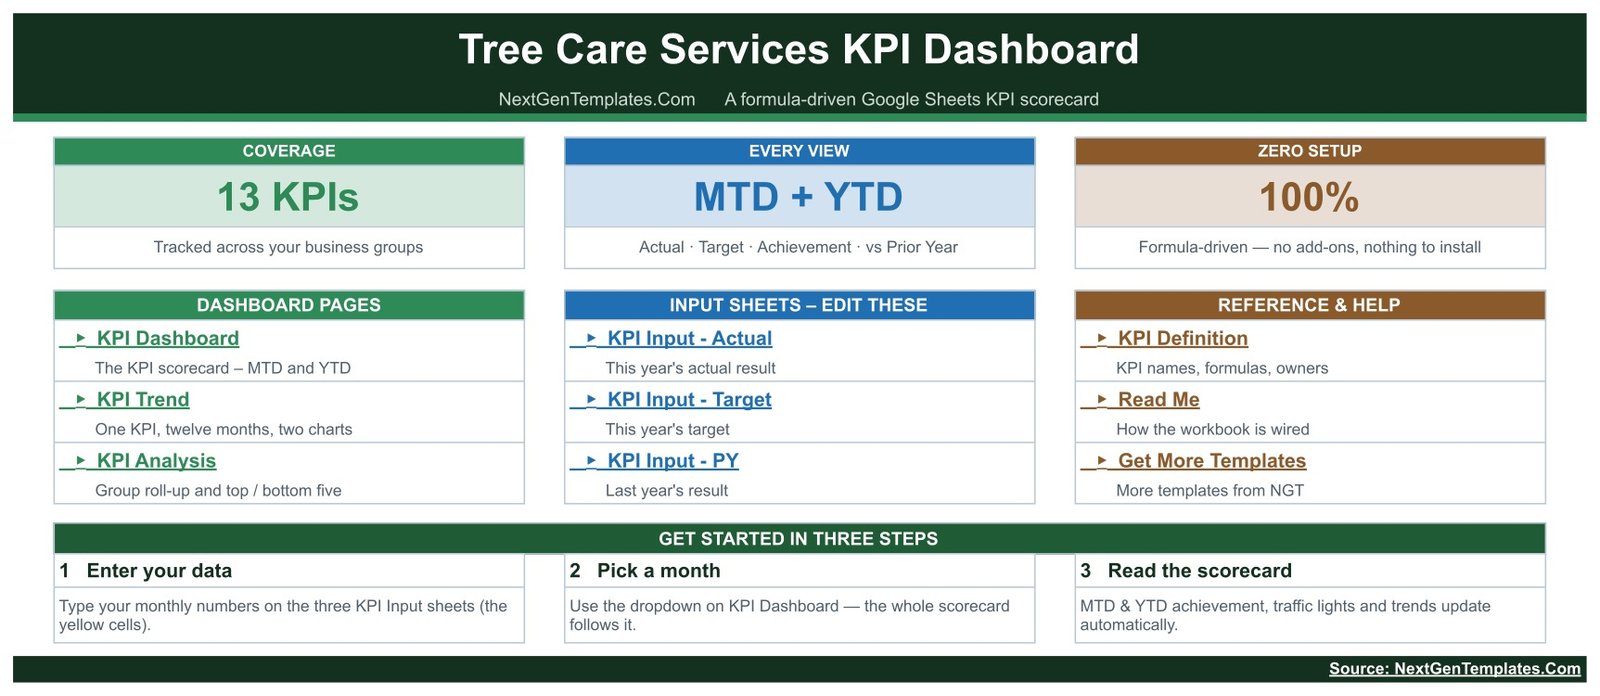
The landing page shows three cards – 13 KPIs, MTD + YTD, and 100% formula-driven – with links to KPI Dashboard, KPI Trend, KPI Analysis, the three input sheets, KPI Definition, Read Me and Get More Templates, plus a three-step get-started strip: enter your data, pick a month, read the scorecard.
KPI Dashboard
Seven cards head the page: Total KPIs Tracked (13), On Target YTD (7), At Risk YTD (4), Missed YTD (2), Improving vs PY MTD (6 of 13), Avg Achievement MTD (98.5%) and Avg Achievement YTD (98.8%). Below them, each KPI row shows group, unit and type, then MTD and YTD actual, target, achievement, status, prior year and vs PY. In the sample, Average Job Value reads 1,812 against a 1,698 target for 106.7%, while Storm-Response Time sits at 7.51 hours against a 6.88-hour target and is Missed at 91.6%.
KPI Trend
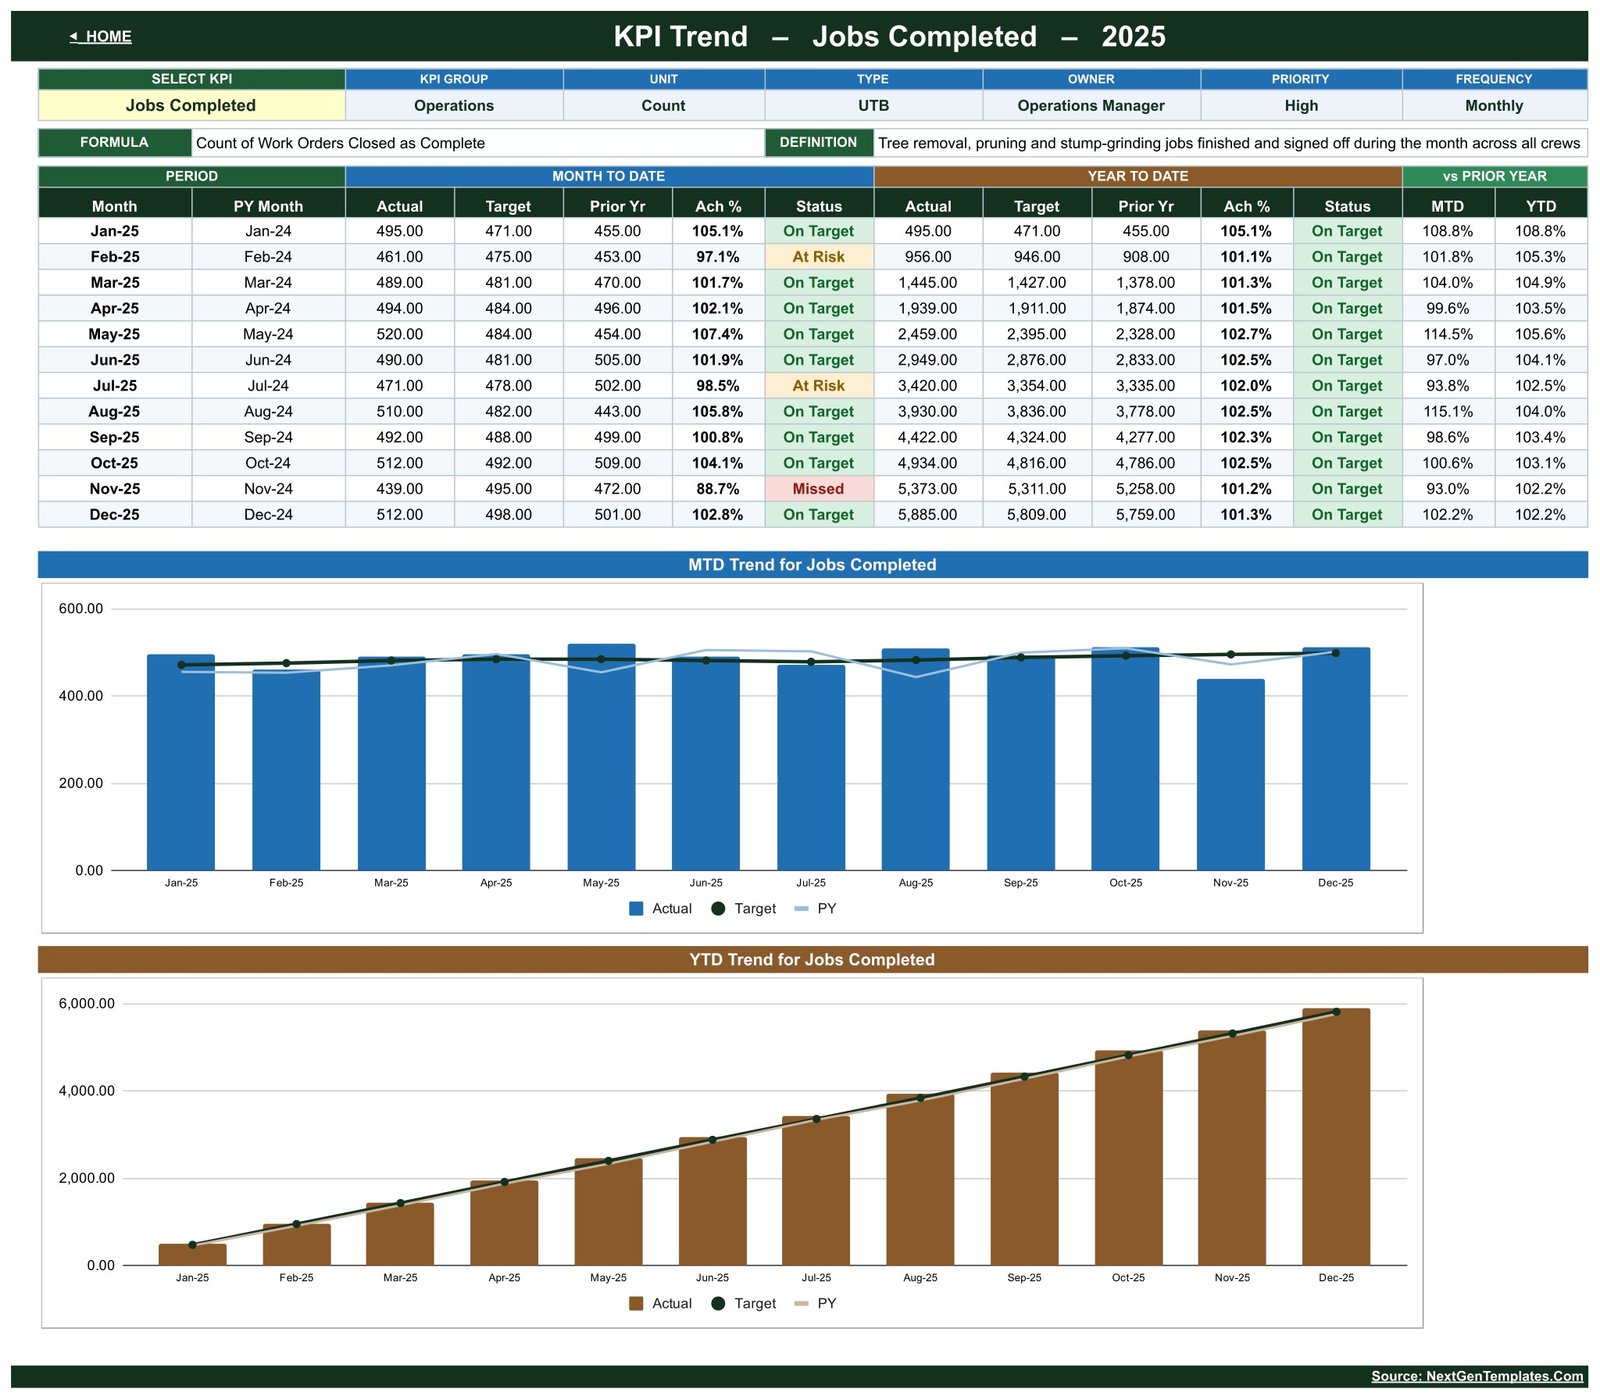
Choose any KPI and the page shows its group, unit, type, owner, priority, frequency, formula and definition, a twelve-month table with MTD and YTD actual, target, prior year, achievement and status, and two charts: MTD Actual, Target and PY by Month, and YTD Actual, Target and PY by Month. For Jobs Completed, November is the one Missed month at 88.7%, yet the YTD line stays On Target all year.
KPI Analysis
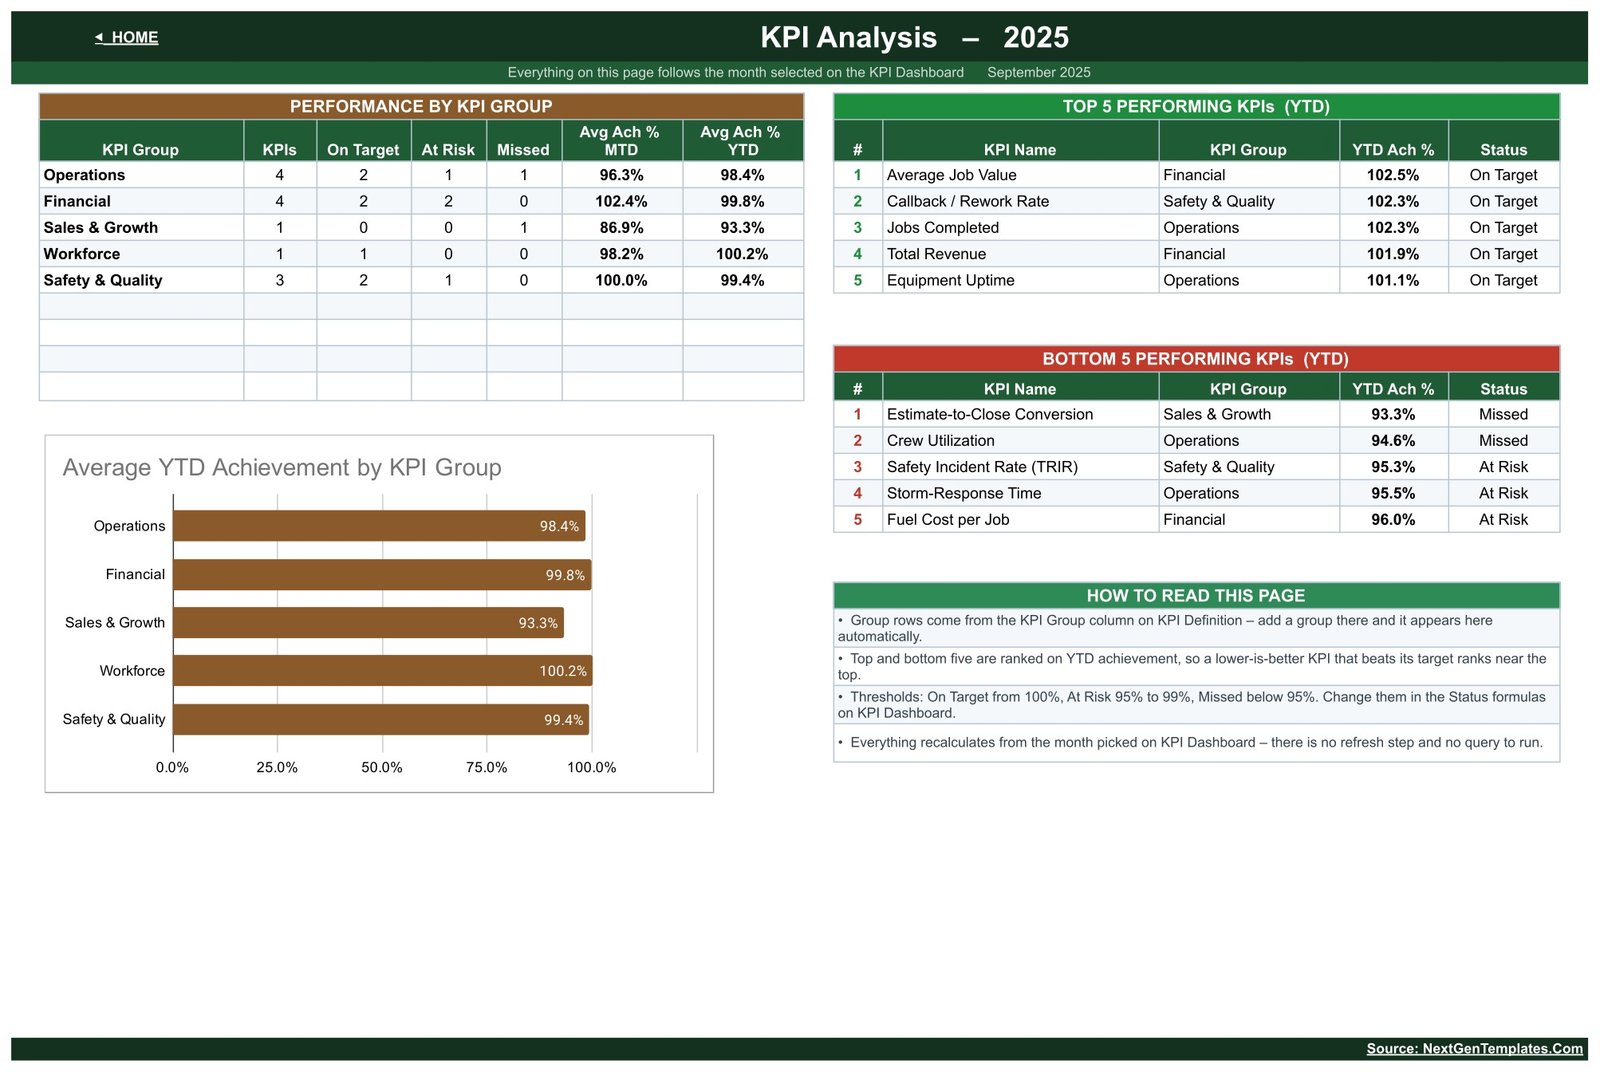
Performance by KPI Group lists each group’s KPI count, On Target, At Risk and Missed totals and average MTD and YTD achievement, charted as Average YTD Achievement by KPI Group. The Top 5 and Bottom 5 tables rank KPIs by YTD achievement: Average Job Value leads at 102.5%, followed by Callback / Rework Rate, Jobs Completed, Total Revenue and Equipment Uptime, while Estimate-to-Close Conversion (93.3%) and Crew Utilization (94.6%) head the bottom five.
KPI Input sheets
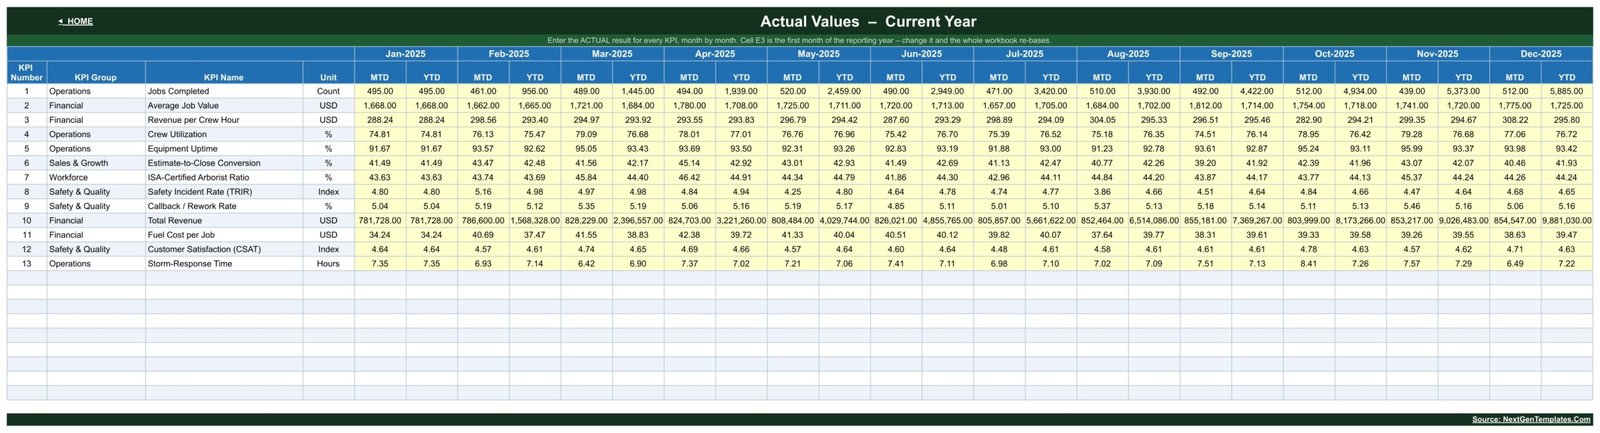
KPI Input – Actual, KPI Input – Target and KPI Input – PY each hold an MTD and a YTD cell for every KPI in every month. These yellow cells are the only ones you normally type in. Cell E3 on the Actual sheet sets the first month of the reporting year.
KPI Definition
The master list stores number, group, name, unit, formula, definition, type, owner, priority and frequency. Every other sheet reads from it, so renaming a KPI here renames it everywhere.
Google Sheets vs. Excel vs. Field Service Software – Feature Comparison
| Feature | Tree Care Services KPI Dashboard (Google Sheets) | Excel KPI workbook | Paid field service software |
|---|---|---|---|
| Cost | ✅ One-time template price | Template plus an Office licence | Recurring subscription, often per user |
| Platform | ✅ Any browser with a Google account | Excel desktop | Vendor cloud app |
| Setup time | ✅ Replace sample numbers, pick a month | Similar | Configuration and data migration |
| Real-time collaboration | ✅ Built in | Needs OneDrive co-authoring | Per paid seat |
| Mobile access | ✅ Google Sheets app | Limited | Vendor app |
| Customizable KPIs | ✅ 22 slots on one list | Formula work | Vendor report set |
| Year-1 cost at 5 users | ✅ Same one-time price | Template plus 5 licences | 5 subscriptions |
| Scheduling, estimates, invoicing | ❌ Not included | ❌ Not included | ✅ Core feature |
For tree care companies that want a disciplined monthly KPI review without another subscription, the Google Sheets scorecard sits in the sweet spot – alongside, not instead of, your scheduling software.
Who Should Use This Template
Perfect for:
- Owners and general managers of tree removal, pruning and stump-grinding companies running a monthly management review
- Operations managers and crew schedulers reporting jobs, crew utilization and equipment uptime
- Sales estimators and finance leads following job value, estimate conversion, revenue and fuel cost
- Consultants assembling a KPI pack for an arboriculture or landscaping client
Not a fit if:
- You need job scheduling, crew dispatch, estimates or invoicing
- You want incident recording, staff credential tracking or safety-compliance software
- You need live or daily crew and equipment data rather than monthly figures
Real-World Use Cases
Ryan runs operations for a three-crew tree service. On the first working day of the month he selects the previous month and checks Crew Utilization, Equipment Uptime and Jobs Completed. When utilization shows Missed, he opens KPI Trend so the team can see whether it has been sliding since spring rather than arguing over one bad month.
Elena is the sales estimator. She reads Estimate-to-Close Conversion beside Average Job Value. When the Bottom 5 table shows conversion Missed for the year while job value is On Target, she has the evidence to put estimate follow-up – not pricing – on the next agenda.
Tom leads emergency dispatch. Storm-Response Time is lower-the-better, so a slower month scores below 100% and turns red. He takes the twelve-month trend and the prior-year comparison to the storm-season review instead of rebuilding a chart by hand.
Advantages of the Tree Care Services KPI Template
- One source of truth. Actual, target and prior year sit in three parallel sheets that share one KPI list, so rows never drift out of line.
- Honest scoring for cost and time KPIs. The LTB formula stops a falling fuel cost or rework rate from reading as a failure.
- No lock-in. It is an ordinary Google Sheets file in your Drive that you can share, copy and edit.
- Fast to adopt. Twelve months of sample data show every page working before you enter anything.
Opportunities for Improvement
- YTD values are typed, not derived, so you must keep MTD and YTD consistent yourself.
- It holds one reporting year per copy; multi-year history means keeping one copy per year.
- There is no per-crew, per-branch or per-customer breakdown – figures are company-level monthly totals.
- Nothing is imported automatically from scheduling, fleet or accounting systems.
- The sample KPI Definition wording for the staffing and safety KPIs names outside certification and reporting bodies; treat it as example text and replace it with your own definitions.
Best Practices
- Agree each KPI’s formula and owner on KPI Definition before the first review, and keep the formula text in plain words.
- Decide once whether each YTD is a running total or an average – Jobs Completed and Total Revenue accumulate, while rates such as Crew Utilization average.
- Set targets for the whole year up front, allowing for seasonal peaks such as spring pruning and storm season.
- Enter the month’s figures on a fixed day and review the Bottom 5 table first.
- Learn dropdowns and sharing in Google Docs Editors Help.
Explore Relevant Templates
- Pest Control Business KPI Dashboard in Google Sheets – the same KPI Dashboard layout for another field-service trade.
- Swimming Pool Service KPI Dashboard in Google Sheets – for route-based service crews.
- Landscaping Dashboard in Google Sheets – an analytical view of landscaping data.
- Garage Door Service KPI Scorecard in Google Sheets on NextGenTemplates.
An Excel edition of the Tree Care Services KPI Dashboard is in preparation and not available yet.
If you want to learn the techniques behind KPI dashboards like this one, the Excel Pivot Tables & Dashboards course on NextGenTemplates Academy walks you through them with practice files.
Get the Tree Care Services KPI Dashboard in Google Sheets
Frequently Asked Questions
Do I need a paid Google Workspace account?
No. The Tree Care Services KPI Dashboard runs in Google Sheets with a free Google account. After purchase you open the PDF, click its link and Google Drive creates your own editable copy. There are no add-ons, macros or Apps Script.
Can I add a fourteenth KPI?
Yes. The workbook is wired for 22 KPIs and 13 are filled. Fill the next empty row on KPI Definition with its group, name, unit, formula, definition, type, owner, priority and frequency; the input sheets pick it up and the dashboard scores it once you enter monthly figures.
Are the figures in the screenshots real?
No. The template ships with illustrative sample data for 2025 so every page works on day one. Replace the actual, target and prior-year numbers with your own and the scorecard, cards, charts and rankings recalculate.
How does this compare with field service software?
Field service software runs scheduling, estimates and invoicing on a subscription. This template does none of that; it is a one-time Google Sheets file that turns your monthly results into a scored KPI review. Many firms use both.
Does it handle safety compliance or arborist certification?
No. Safety Incident Rate (TRIR) and the certified-arborist staffing ratio appear only as monthly management indicators on sample data. The template does not record incidents, track credentials or certify anyone, and it does not replace your own safety or training systems.
About the Author
Built by PK – Microsoft Certified Professional with 15+ years of Excel, Google Sheets and Power BI experience, and founder of NextGenTemplates. Every template is hand-built and tested before release.
Conclusion
If your tree care business reviews its numbers every month, the Tree Care Services KPI Dashboard gives that review a fixed shape: 13 KPIs, one month picker, honest scoring for cost and response-time measures, and trend and group pages that show where to look next.
✅ Instant download · One-time payment · No subscription
Last updated: September 2026