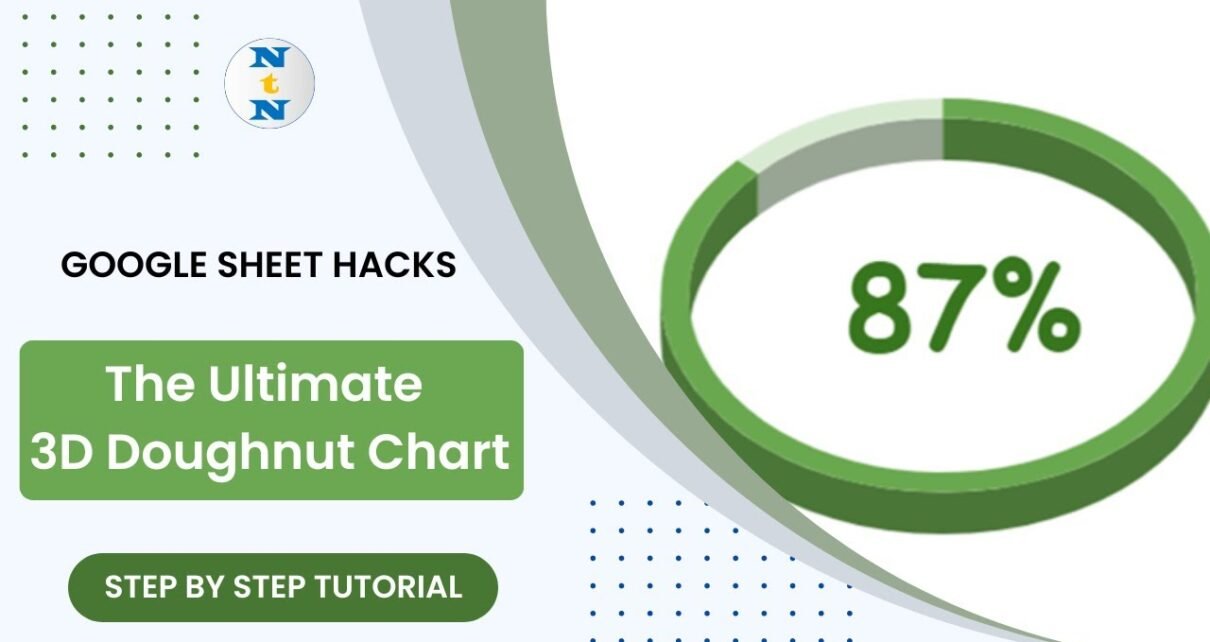
Build a dynamic 3D doughnut chart in Google Sheets from a pie chart, two data cells and one helper formula, with the KPI value shown in the centre of the ring.
Online Tutorial for Data Analysis and Automation
Build a dynamic 3D doughnut chart in Google Sheets from a pie chart, two data cells and one helper formula, with the KPI value shown in the centre of the ring.