Power BI is a fantastic tool for analyzing and visualizing data, and it’s flexible enough to support various data formats. One of the most widely used formats is JSON (JavaScript Object Notation). JSON is a lightweight and human-readable data format commonly used by web services and APIs to exchange data. In this guide, we’ll walk […]
Tag: data analysis
Text/CSV Connectivity in Power BI
Power BI is a powerful tool that allows users to connect, analyze, and visualize data from various sources. Among these sources, Text/CSV files are common data formats used across industries for storing information. These formats are lightweight and easy to share, making them a popular choice for exporting data from various systems. This article provides […]
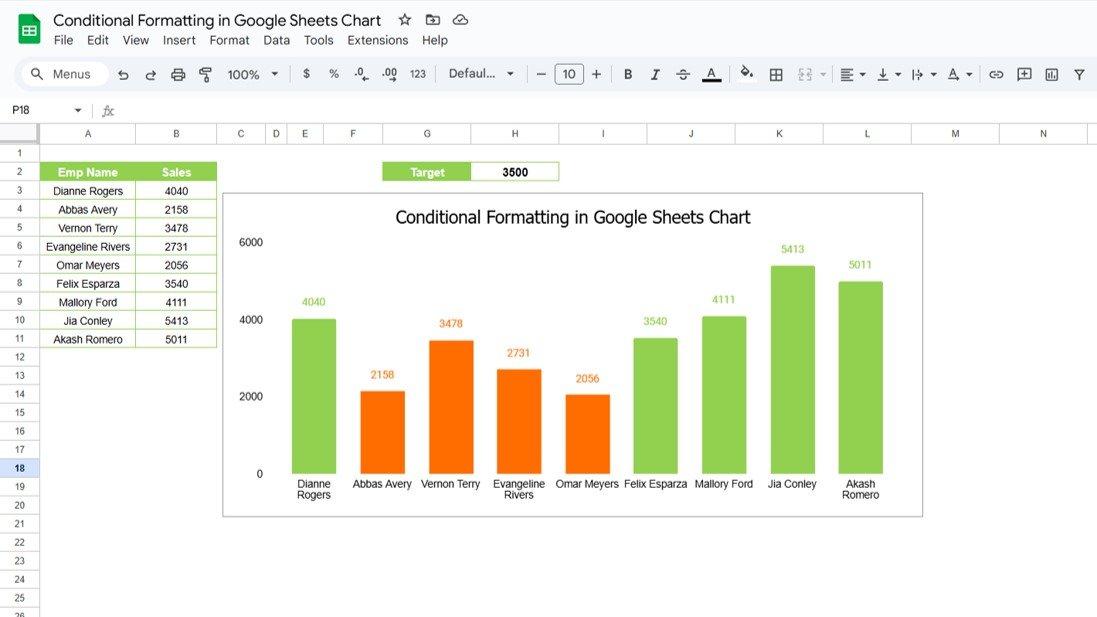
Conditional Formatting in Google Sheets Chart
Google Sheets offers a wide range of features to help you visualize and analyze data efficiently. One of the most powerful and visually appealing options is Conditional Formatting in Google Sheets Charts. By using conditional formatting, you can instantly highlight key data points, making it easier to interpret your data. In this article, we will […]
Connecting Power BI with Excel
Power BI and Excel are two of the most popular tools for data analysis and visualization. While each has its strengths, combining them can unlock even more powerful insights. Connecting Power BI with Excel allows you to work with Excel data in Power BI and vice versa, making your data analysis workflow more efficient. In […]
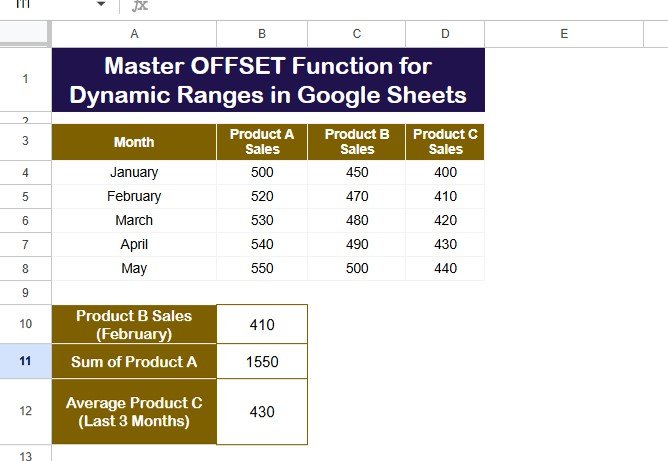
OFFSET Function for Dynamic Ranges in Google Sheets
Google Sheets is an incredibly versatile tool that helps you organize and analyze data with ease. One of its most powerful functions is the OFFSET function. This function allows you to create flexible data ranges, perform calculations, and manage data without constantly adjusting cell references. Whether you’re working with a large dataset or designing a […]
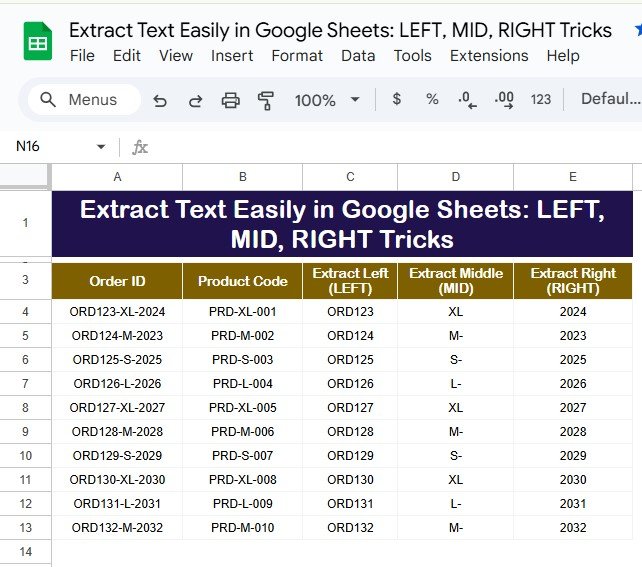
Extract Text Easily in Google Sheets LEFT, MID, RIGHT Tricks
Google Sheets is a versatile tool for managing and analyzing data. Among its many features, the LEFT, MID, and RIGHT functions stand out for their ability to Extract Text Easily in Google Sheets portions of text strings. These functions are incredibly useful when working with structured data, such as order IDs or product codes, where […]
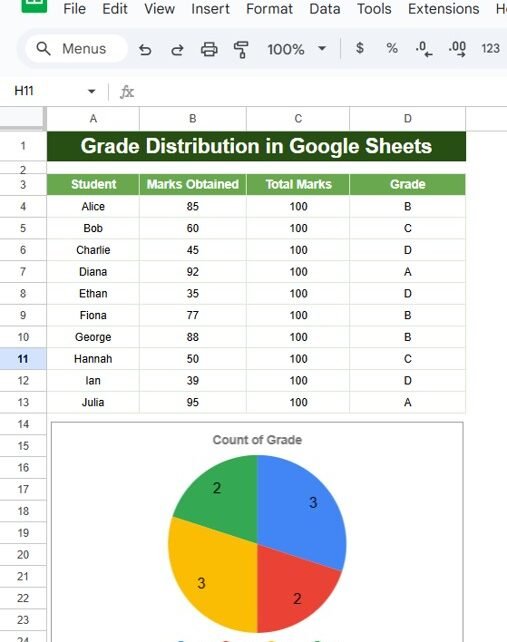
Grade Distribution in Google Sheets
Google Sheets is an incredibly powerful tool for data analysis, and one of its practical applications is automating grade distribution. Assigning grades based on scores can be tedious, but with the right formula, you can simplify the entire process. This article will walk you through Grade Distribution in Google Sheets, including step-by-step instructions, practical examples, […]
Auto-Highlight Top 3 Students in Google Sheets
Auto-Highlight Top 3 Students in Google Sheets Recognizing top-performing students is an essential task for educators and administrators. Google Sheets makes this task seamless by automating the process of highlighting the top 3 students in a dataset. In this article, you will learn how to use Google Sheets to Auto-Highlight the Top 3 Students with […]
Mastering the ODD & EVEN Formula in Google Sheets
Have you ever wondered how to quickly find odd and even numbers in Google Sheets? If you’re looking for a simple and easy solution, you’re in the right place! In this blog post, we’ll walk you through the ODD & EVEN Formula in Google Sheets. By the end, you’ll know exactly how to use these […]
How to Use DATE, DAY, and MONTH Functions in Google Sheets (With Example)
The DATE, DAY, and MONTH Functions in Google Sheets are incredibly useful when you need to extract specific pieces of information from a full date. For instance, you might need to find out the exact day of the month or pull just the month or year from a given date. These functions make it quick […]


