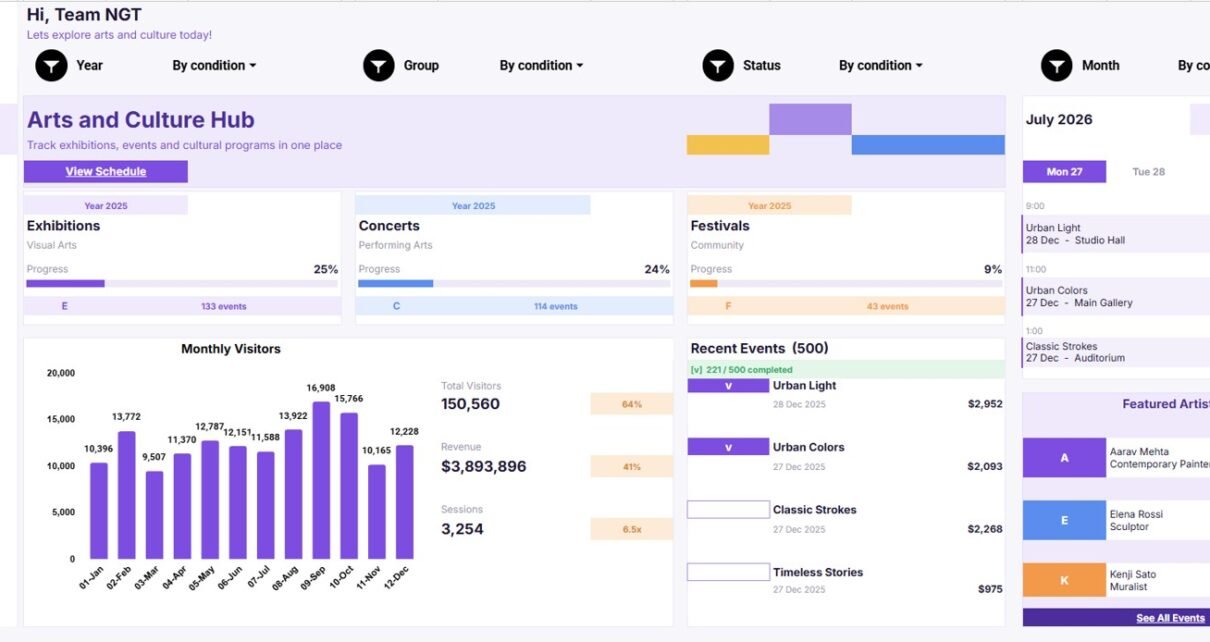
Explore how the Arts and Culture Dashboard in Google Sheets tracks exhibitions, concerts, festivals, visitors, artists, venues, programs, revenue, costs, and source data in one editable template.
Online Tutorial for Data Analysis and Automation
Explore how the Arts and Culture Dashboard in Google Sheets tracks exhibitions, concerts, festivals, visitors, artists, venues, programs, revenue, costs, and source data in one editable template.
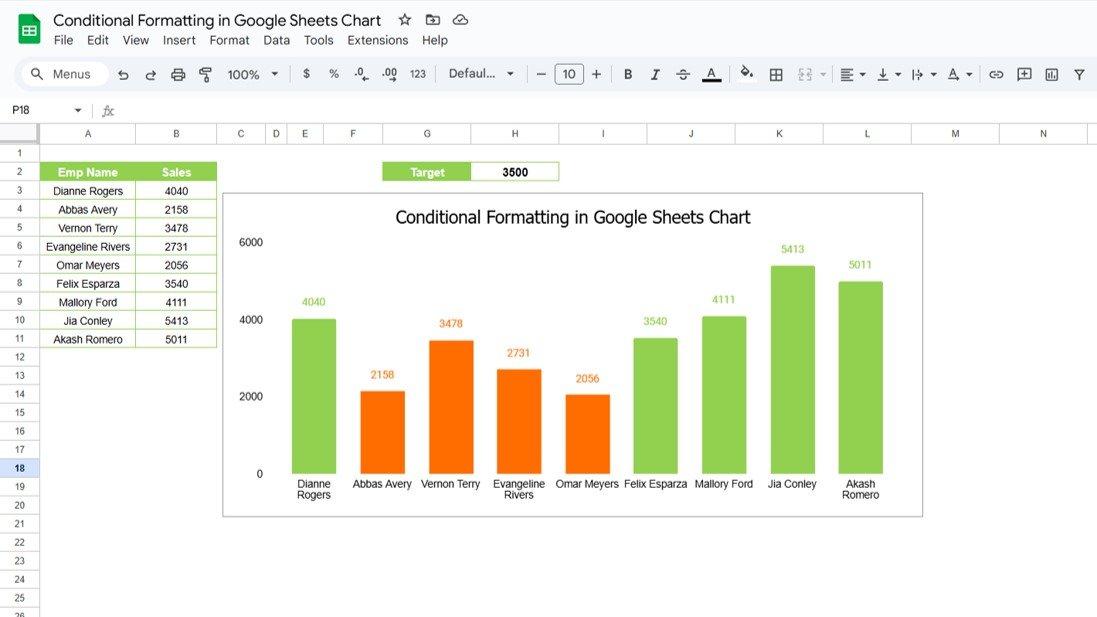
Google Sheets offers a wide range of features to help you visualize and analyze data efficiently. One of the most powerful and visually appealing options is Conditional Formatting in Google Sheets Charts. By using conditional formatting, you can instantly highlight key data points, making it easier to interpret your data. In this article, we will […]