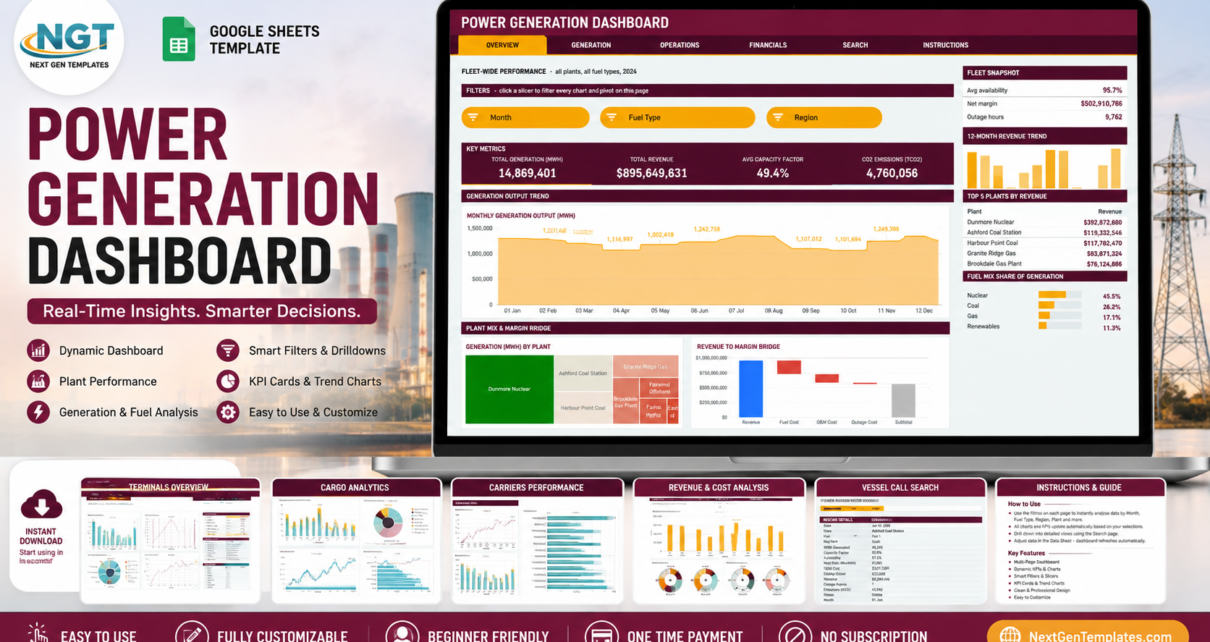
A six-page Power Generation Dashboard in Google Sheets built on native pivot tables and slicers – 16 KPI cards, 18 charts and a record lookup covering MWh, capacity factor, availability, outage hours, revenue and margin across your generation fleet.
Online Tutorial for Data Analysis and Automation
A six-page Power Generation Dashboard in Google Sheets built on native pivot tables and slicers – 16 KPI cards, 18 charts and a record lookup covering MWh, capacity factor, availability, outage hours, revenue and margin across your generation fleet.