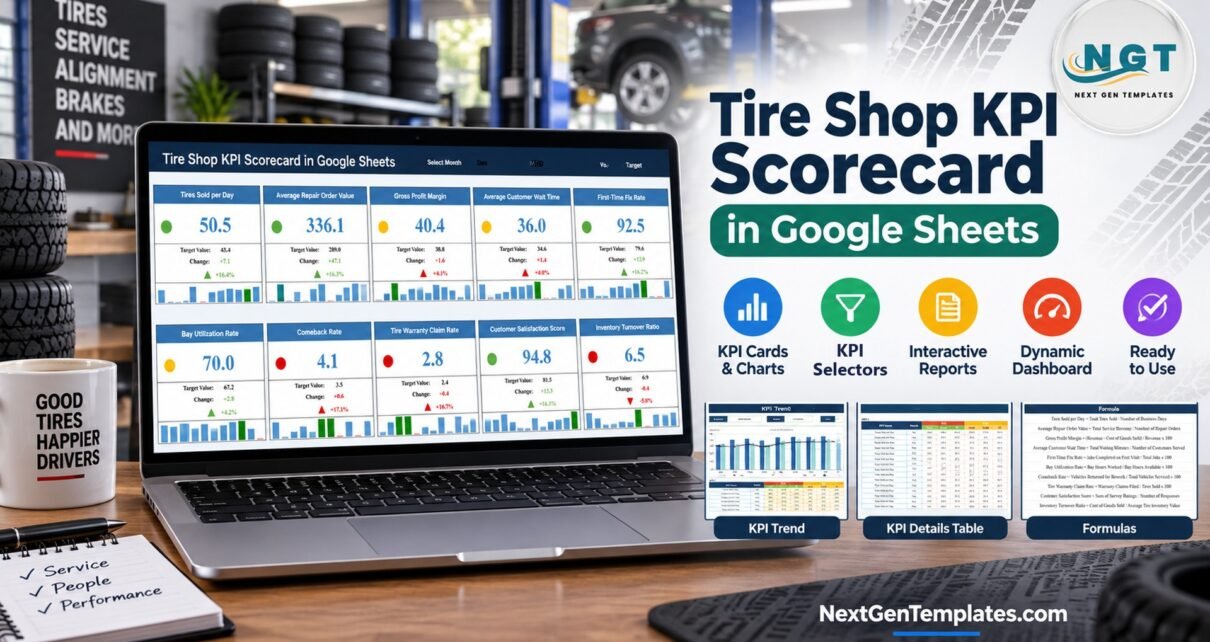
A tire shop already records every figure a monthly review needs. Units and invoice totals sit in the point-of-sale system, bay hours and wait times in the work orders, comebacks and warranty claims in the service log, and stock values in the inventory count. What is usually missing is one page that lines those numbers up in the same shape every month. The Tire Shop KPI Scorecard in Google Sheets is that page: ten tire shop KPIs, a month picker, an MTD / YTD switch and direction-aware traffic lights, in a copy you own in Google Drive.
This guide walks through every tab, the ten KPIs and how they are scored, who the template suits, and the three small issues in the current copy along with their fixes.
Get the Tire Shop KPI Scorecard in Google Sheets
What Is the Tire Shop KPI Scorecard in Google Sheets?
It is a monthly KPI scorecard – not a transaction-level analytical dashboard and not a shop management system. You type aggregate monthly figures (Actual, Target and prior year) for ten KPIs, and the Scorecard page turns them into ten cards, each with a status light, the change against your chosen comparison and a twelve-month mini chart. Everything in this tire shop KPI template is formula-driven, so it runs in any browser with no add-on, macro or subscription.
The ten KPIs are split into five groups: Sales & Revenue, Service Operations, Quality, Customer and Inventory. Seven are upper-the-better (UTB) and three are lower-the-better (LTB), and the traffic lights respect that direction.
Key Features
- 🚙 10 KPI cards on one page – value, target or PY value, change, percentage change, arrow, status light and a mini chart.
- 📅 Select Month dropdown – any month from January to December.
- 🔄 MTD or YTD – switch every card between month-to-date and year-to-date.
- ⚖️ Vs. Target or Vs. PY – compare with the plan or with the same period last year.
- 🚦 Direction-aware status – a falling Comeback Rate or Tire Warranty Claim Rate counts as an improvement.
- 📈 KPI Trend page – one KPI at a time with MTD and YTD Actual vs Target vs PY charts.
- 📝 Editable KPI Definition and Input Data tabs – rename, redefine and retype without touching a formula.
- 👥 Shared through Google Drive – owner, service manager and bookkeeper can read the same live copy.
A Tab-by-Tab Walkthrough
Scorecard
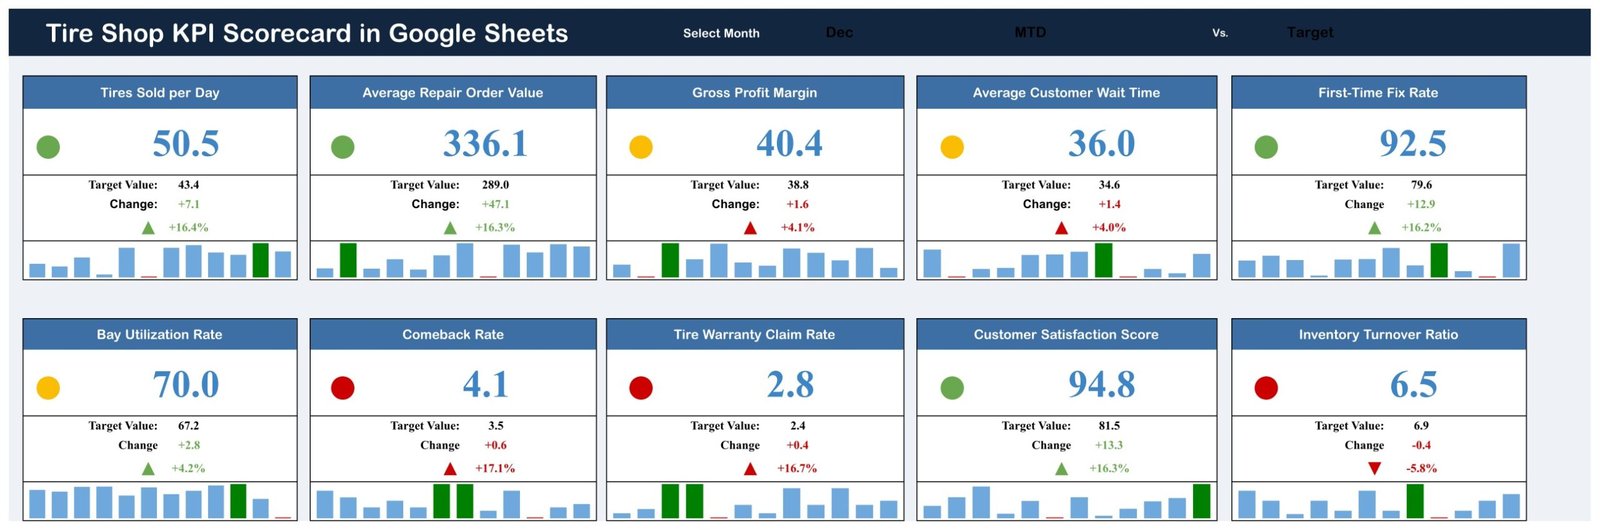
The header carries three dropdowns: Select Month, MTD / YTD, and Vs. (Target or PY). Below them sit ten cards in two rows. In the supplied December MTD vs Target example, four KPIs are green, three amber and three red. Tires Sold per Day reads 50.5 against a target of 43.4, First-Time Fix Rate reads 92.5 against 79.6, and Customer Satisfaction Score reads 94.8 against 81.5. On the other side, Comeback Rate (4.1 vs 3.5) and Tire Warranty Claim Rate (2.8 vs 2.4) are red because both are lower-the-better, and Inventory Turnover Ratio (6.5 vs 6.9) is red because it fell short. These are fictional demonstration figures, not benchmarks.
KPI Trend
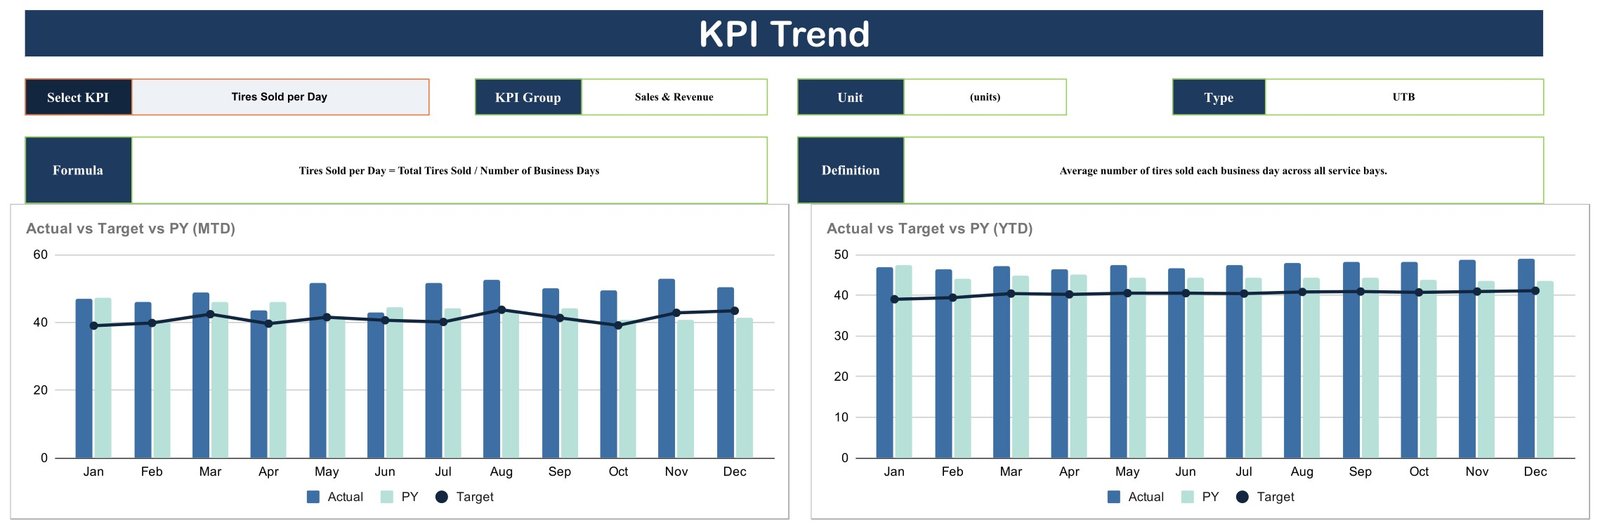
Choose a KPI from the Select KPI dropdown and the page shows its KPI group, unit, type, written formula and definition, followed by two column-and-line charts: Actual vs Target vs PY for MTD, and the same for YTD, across all twelve months.
KPI Definition
The master list: number, KPI group, KPI name, unit, formula, definition and type for all ten metrics. Read this first and adjust the wording so each KPI matches how your shop measures it.

Input Data
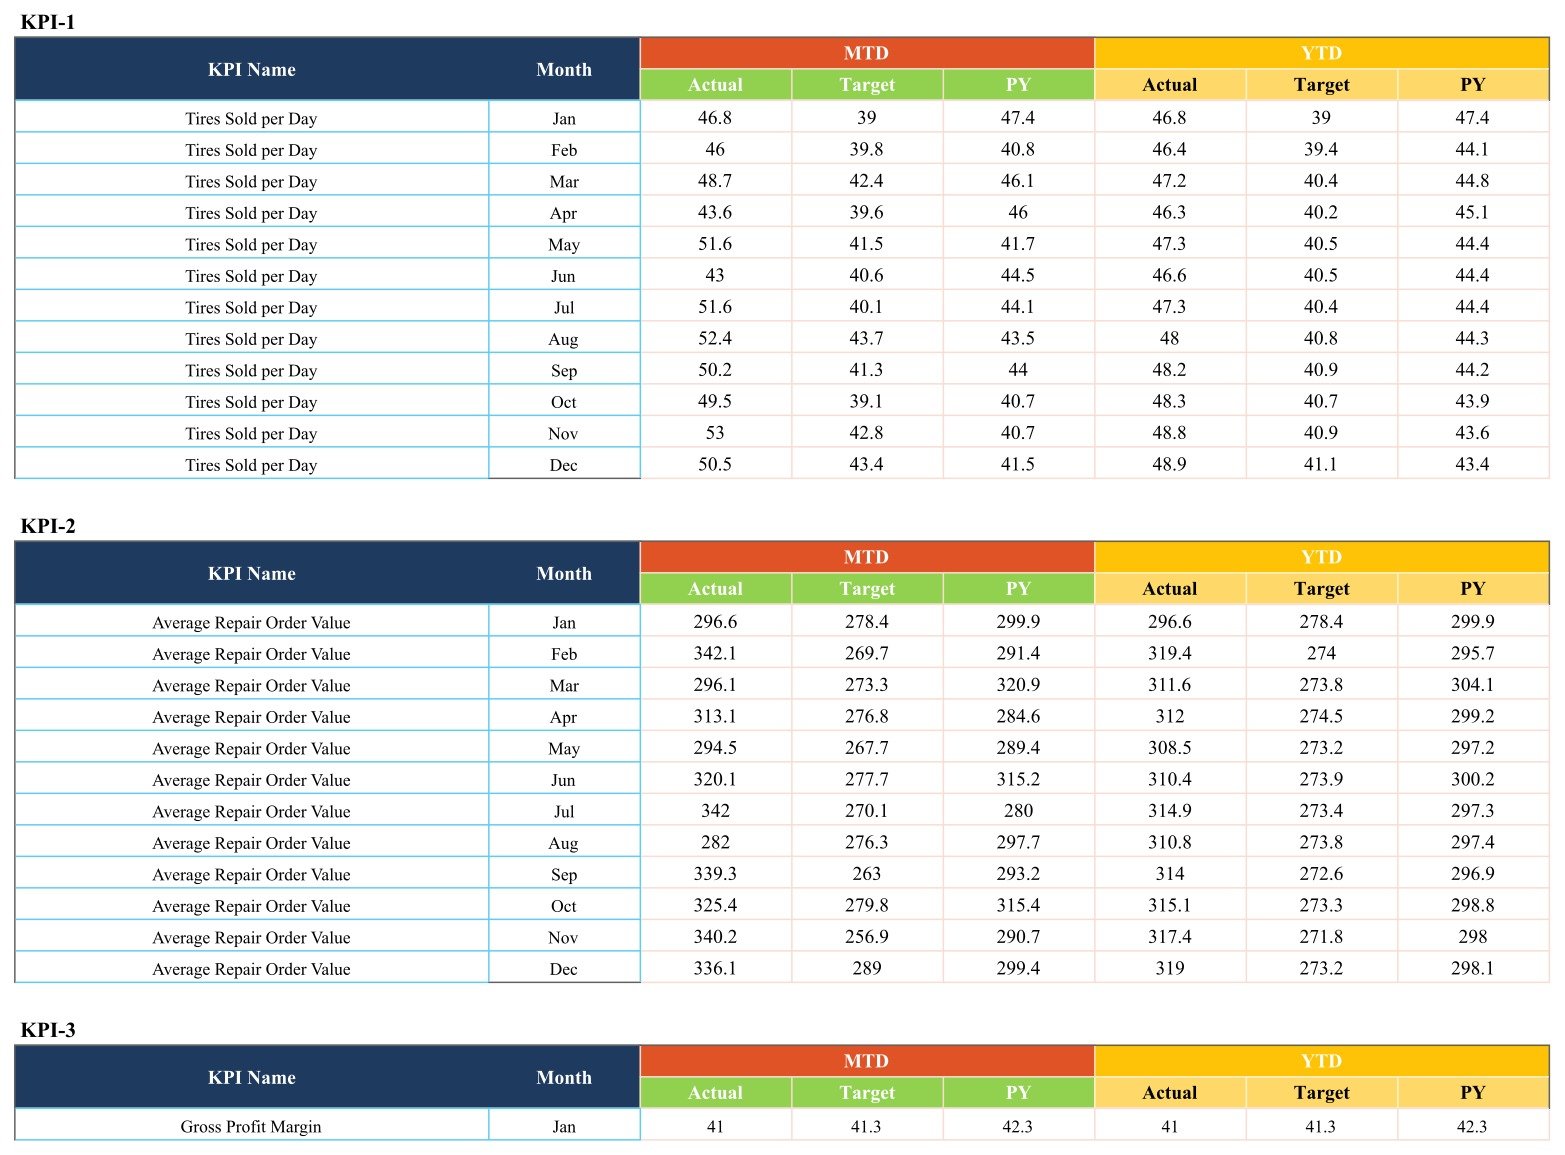
Each KPI has a numbered block with twelve monthly rows and six value columns: MTD Actual, Target and PY, then YTD Actual, Target and PY. You type the YTD figures yourself, because the right roll-up differs by KPI – an average for a rate, a running figure for a volume.
Color Settings and helper tabs
Color Settings documents the red / amber / green bands. By default a UTB KPI is green only when it beats its comparison by more than 10%, amber when it is up to 10% better, and red when it is level or worse; LTB KPIs mirror this. The calculation reads its own band table on the Support tab, so change both if you change a band. Support and Trend_Support are helper tabs that feed the cards and charts.
The 10 Tire Shop KPIs and How They Are Scored
| # | KPI | Group | Unit | Formula | Type |
|---|---|---|---|---|---|
| 1 | Tires Sold per Day | Sales & Revenue | units | Total Tires Sold / Number of Business Days | UTB |
| 2 | Average Repair Order Value | Sales & Revenue | $ | Total Service Revenue / Number of Repair Orders | UTB |
| 3 | Gross Profit Margin | Sales & Revenue | % | (Revenue – Cost of Goods Sold) / Revenue x 100 | UTB |
| 4 | Average Customer Wait Time | Service Operations | min | Total Waiting Minutes / Number of Customers Served | LTB |
| 5 | First-Time Fix Rate | Service Operations | % | Jobs Completed on First Visit / Total Jobs x 100 | UTB |
| 6 | Bay Utilization Rate | Service Operations | % | Bay Hours Worked / Bay Hours Available x 100 | UTB |
| 7 | Comeback Rate | Quality | % | Vehicles Returned for Rework / Total Vehicles Serviced x 100 | LTB |
| 8 | Tire Warranty Claim Rate | Quality | % | Warranty Claims Filed / Tires Sold x 100 | LTB |
| 9 | Customer Satisfaction Score | Customer | score | Sum of Survey Ratings / Number of Responses | UTB |
| 10 | Inventory Turnover Ratio | Inventory | turns | Cost of Goods Sold / Average Tire Inventory Value | UTB |
Read together, these tire shop performance metrics answer the questions an owner actually asks each month: are we selling enough, are we doing the work right first time, are customers waiting too long, and is stock moving?
Google Sheets Scorecard vs. Excel vs. Shop Software
| Area | This Google Sheets KPI scorecard | Excel edition | Tire / auto shop software |
|---|---|---|---|
| Price model | One-time purchase | One-time purchase | Monthly subscription |
| Where it runs | Any browser with a Google account | Desktop Excel | Vendor app |
| Collaboration | Built in through Drive sharing | OneDrive / SharePoint | Seat-based |
| KPI list | Includes First-Time Fix Rate, Wait Time and Tire Warranty Claim Rate | A different list (Alignment Attach Rate, Tire Install Time, Appointment No-Show) | Vendor reports |
| Data capture | You type monthly totals | You type monthly totals | Automatic from transactions |
| Runs invoicing, booking or stock | No | No | Usually yes |
If you work in desktop Excel, the Tire Shop KPI Scorecard in Excel is a separate product with its own KPI list and extra analysis pages. The two editions do not share the same ten KPIs, so pick the one whose list matches what you want to watch.
Who It Is For – and Who It Is Not For
A good fit for independent tire and wheel shop owners who review results once a month, service managers who report bay, wait-time and comeback figures to an owner, and bookkeepers who prepare a monthly KPI pack for tire dealers.
Not a fit for shops that want numbers pulled automatically from a POS, anyone needing invoicing, appointment booking, tire storage or stock control, or multi-site chains that need store-by-store drill-down inside one file. The scorecard reports on those areas; it does not run them.
How to Set It Up
- Open the PDF from your download, click the Google Sheets link and choose File > Make a copy.
- Review the ten KPIs, formulas and UTB/LTB types on KPI Definition.
- Replace the fictional values on Input Data with your own monthly MTD and YTD figures.
- On Scorecard, pick a month, MTD or YTD, and Target or PY.
- Open KPI Trend for any red or amber card.
Known Issues in the Current Copy – and the Fixes
We would rather you hear these from us than find them yourself:
- June and July blank the cards. The Select Month dropdown spells these months “June” and “July”, while the data rows use “Jun” and “Jul”. In your copy, select the month cell, open Data > Data validation and change the two entries to Jun and Jul.
- The Read Me tab is empty. Setup steps are in the PDF and in this guide.
- Gross Profit Margin change colour. On that card the change figure shows in red even when the margin beats its comparison. The status light and arrow are correct; adjust the text colour under Format > Conditional formatting if it bothers you.
Real-World Use Cases
A two-bay tire and alignment shop owner enters last month’s totals on the first Monday of the month, sees Tire Warranty Claim Rate in red and opens KPI Trend to check whether it is one bad month or a rising pattern.
A service manager reads Average Customer Wait Time, Bay Utilization Rate and First-Time Fix Rate side by side to separate a staffing problem from a workflow problem.
A bookkeeper for several tire dealers keeps one copy per client and shares each through Google Drive with the owner.
More Google Sheets KPI Scorecards for Service Businesses
The same scorecard format is available for other trades. See the Garage Door Service KPI Scorecard in Google Sheets, the Appliance Repair Business KPI Scorecard in Google Sheets and the Handyman Services KPI Scorecard in Google Sheets. If you also plan vehicle servicing, the Fleet Maintenance Calendar in Google Sheets covers the scheduling side.
Curious how scorecards like this are built? The Excel Pivot Tables & Dashboards course on NextGenTemplates Academy covers the reporting skills behind them, with practice files to follow along.
Frequently Asked Questions
What KPIs does the tire shop KPI scorecard track?
Tires Sold per Day, Average Repair Order Value, Gross Profit Margin, Average Customer Wait Time, First-Time Fix Rate, Bay Utilization Rate, Comeback Rate, Tire Warranty Claim Rate, Customer Satisfaction Score and Inventory Turnover Ratio.
Which KPIs are lower-the-better?
Average Customer Wait Time, Comeback Rate and Tire Warranty Claim Rate.
Does it connect to my POS?
No. You type or paste monthly totals; there is no live connection to any system.
Do I need an add-on or macros?
No. It is formula-driven and runs in Google Sheets in any browser.
Are the sample numbers benchmarks?
No. They are fictional values that show the scorecard working before you enter your own.
Conclusion
The Tire Shop KPI Scorecard in Google Sheets gives a tire shop one consistent monthly page for sales, service, quality, customer and inventory results, with lights that respect each KPI’s direction and a trend view for anything that turns red. Fix the June/July dropdown entries in your copy, type your own figures, and the review that used to take an evening of exports takes a few minutes.
Download the Tire Shop KPI Scorecard in Google Sheets
Built by PK – Microsoft Certified Professional with 15+ years of Excel, Google Sheets and Power BI experience, founder of NextGenTemplates. Last updated: September 2026.