Field service businesses run on speed, accuracy, and customer satisfaction. However, many teams still track technicians, response times, and costs in disconnected spreadsheets. As a result, managers struggle to measure performance clearly. Moreover, reporting takes too much time.
Therefore, you need a structured system.
In this article, we have created a Field Service KPI Dashboard in Google Sheets. This ready-to-use dashboard helps you track technician productivity, service quality, cost efficiency, and operational performance — all in one place.
Below, you will find:
-
Complete KPI list with Unit
-
Aggregation formula logic
-
KPI definition
-
Lower the Better (LTB) or Upper the Better (UTB)
-
Explanation of all 6 worksheets
-
Key features of the dashboard
Key Features of Field Service KPI Dashboard in Google Sheets
This KPI dashboard contains 6 structured worksheets designed for dynamic performance tracking.
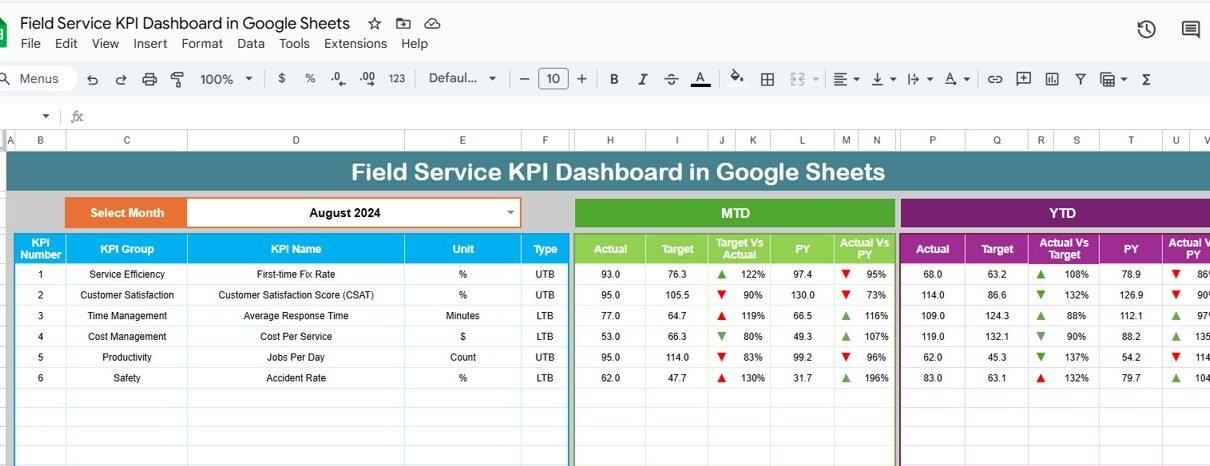
Dashboard Sheet Tab (Main Sheet)
This is the primary performance monitoring page.
Key Functionalities:
-
📅 Month Selection Dropdown (Cell D3)
-
Dynamic update for selected month
-
MTD vs Target vs Previous Year comparison
-
YTD vs Target vs Previous Year comparison
-
Target vs Actual % variance
-
Previous Year vs Actual % comparison
-
Conditional formatting with up/down arrows
Because of this structure, managers instantly understand performance gaps.

Click to Buy Field Service KPI Dashboard in Google Sheets
KPI Trend Sheet Tab
This sheet helps in deep KPI analysis.
You can select the KPI name from a dropdown.
The sheet displays:
-
KPI Group
-
KPI Unit
-
KPI Type (LTB or UTB)
-
KPI Formula
-
KPI Definition
-
Monthly trend chart
Therefore, you can analyze one KPI in detail across the year.

Click to Buy Field Service KPI Dashboard in Google Sheets
Actual Number Sheet Tab
Here, you enter actual MTD and YTD numbers.
Key Inputs:
- Month selection in Cell E1 (enter first month of year)
- Enter MTD values
- YTD values auto-calculate (if cumulative logic applied)
Because of structured data entry, dashboard updates automatically.

Click to Buy Field Service KPI Dashboard in Google Sheets
Target Sheet Tab
In this sheet:
-
Enter monthly MTD target values
-
Enter YTD cumulative targets
Since targets define performance direction, this sheet plays a crucial role.

Click to Buy Field Service KPI Dashboard in Google Sheets
Previous Year Number Sheet Tab
Here, you input:
- Previous year MTD values
- Previous year YTD values
As a result, dashboard compares:
- Actual vs Previous Year
- Growth trends

Click to Buy Field Service KPI Dashboard in Google Sheets
KPI Definition Sheet Tab
This sheet stores:
- KPI Name
- KPI Group
- Unit
- Formula
- Definition
- Type (LTB or UTB)
Because this sheet centralizes KPI logic, reporting becomes consistent.

Click to Buy Field Service KPI Dashboard in Google Sheets
Advantages of Field Service KPI Dashboard in Google Sheets
1. Real-Time Performance Monitoring
You track monthly performance instantly.
2. Target vs Actual Comparison
You quickly identify performance gaps.
3. Previous Year Benchmarking
You measure growth trends easily.
4. Technician Performance Visibility
You analyze productivity and utilization clearly.
5. Financial Control
You monitor service revenue and cost effectively.
6. SLA Compliance Tracking
You ensure timely service delivery.
Best Practices for the Field Service KPI Dashboard
Click to Buy Field Service KPI Dashboard in Google Sheets
To get maximum benefit, follow these best practices:
1. Update Data Monthly
Always enter MTD data consistently.
2. Validate Data Accuracy
Check service hours and revenue entries before analysis.
3. Monitor LTB KPIs Closely
Focus on response time, backlog, and repeat visits.
4. Set Realistic Targets
Base targets on historical trends.
5. Review KPI Trends Quarterly
Analyze performance direction instead of only monthly numbers.
6. Train Team on KPI Definitions
Ensure everyone understands how KPIs calculate.
Who Should Use This Dashboard?
Click to Buy Field Service KPI Dashboard in Google Sheets
-
Field service managers
-
Facility management companies
-
HVAC service companies
-
IT support service providers
-
Telecom field teams
-
Maintenance service organizations
Conclusion
Field service operations require tight control over time, cost, and customer satisfaction. However, manual reporting slows down performance tracking.
The Field Service KPI Dashboard in Google Sheets solves this problem. It provides structured tracking for MTD and YTD performance, target comparisons, and previous year benchmarking — all in one dynamic system.
Visit our YouTube channel to learn step-by-step video tutorials
Youtube.com/@NeotechNavigators
Watch the step-by-step video tutorial: