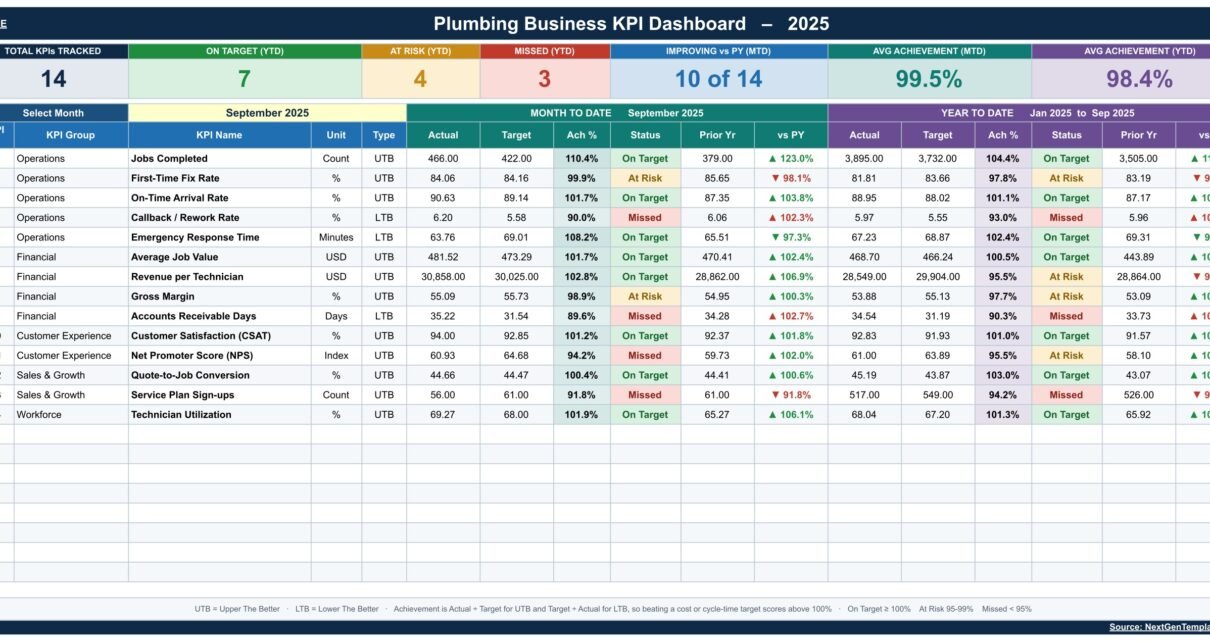
Track 14 plumbing KPIs across 5 groups in Google Sheets. One month picker drives MTD and YTD achievement, traffic lights, a per-KPI trend page and a group analysis page. No add-ons, no scripts.
Online Tutorial for Data Analysis and Automation
Track 14 plumbing KPIs across 5 groups in Google Sheets. One month picker drives MTD and YTD achievement, traffic lights, a per-KPI trend page and a group analysis page. No add-ons, no scripts.
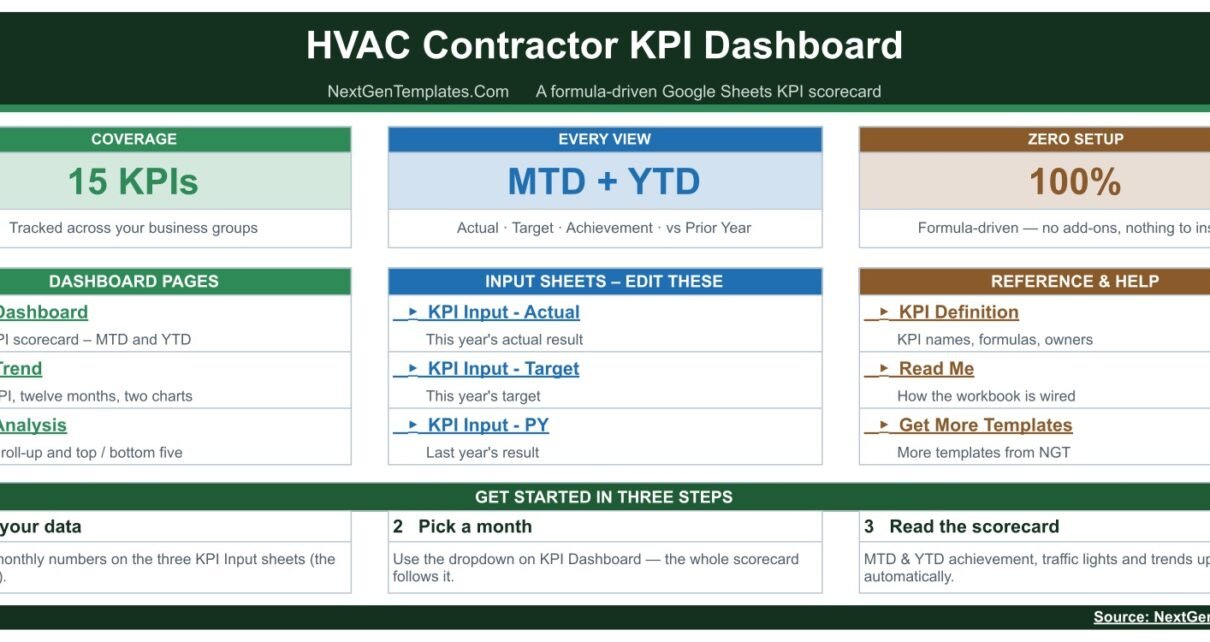
Track 15 HVAC contractor KPIs in Google Sheets with MTD and YTD achievement, prior-year comparison and traffic-light status. One month dropdown drives the scorecard, the KPI Trend page and the group analysis – formula-driven, nothing to install.

The Auto Repair Dashboard in Google Sheets tracks 4 KPIs across 4 interactive analysis pages with 15 pre-built charts covering revenue, technician performance, vehicle make analysis, and job status. Job Record Lookup included. $9.99 one-time vs $99–$299/month for shop management SaaS.
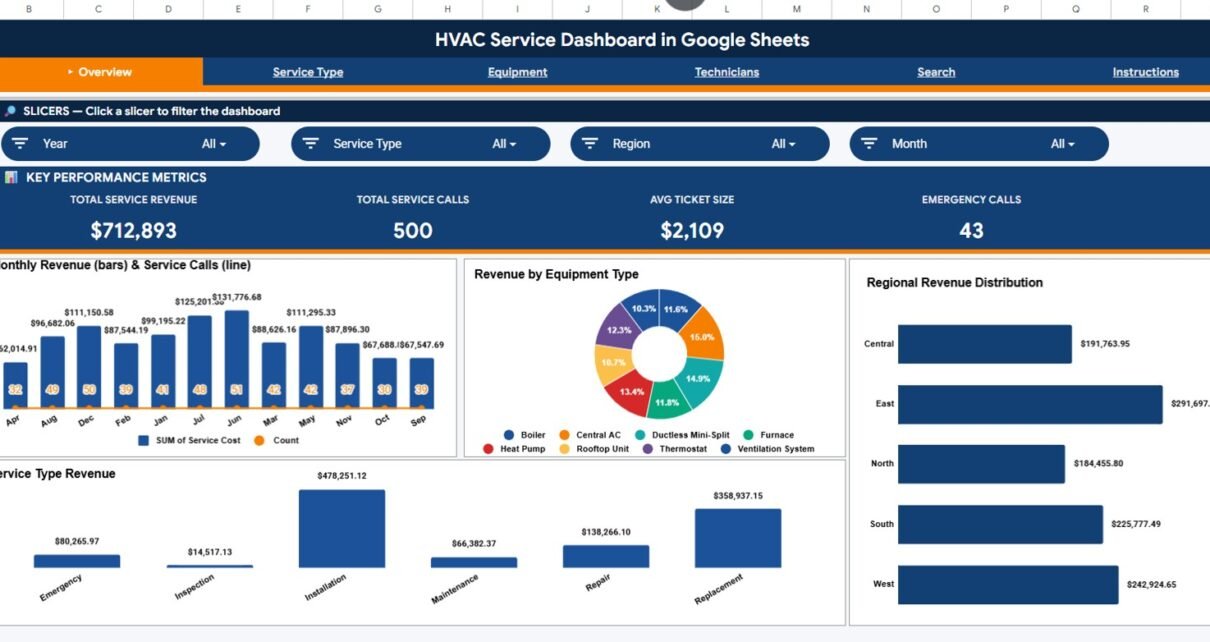
Track HVAC service revenue, calls, ticket size, and emergency volume in Google Sheets. 4 KPIs, 11 charts, 3 analysis pages, plus a Service Ticket Lookup — $9.99 one-time vs $99+/technician/month for ServiceTitan or Housecall Pro.
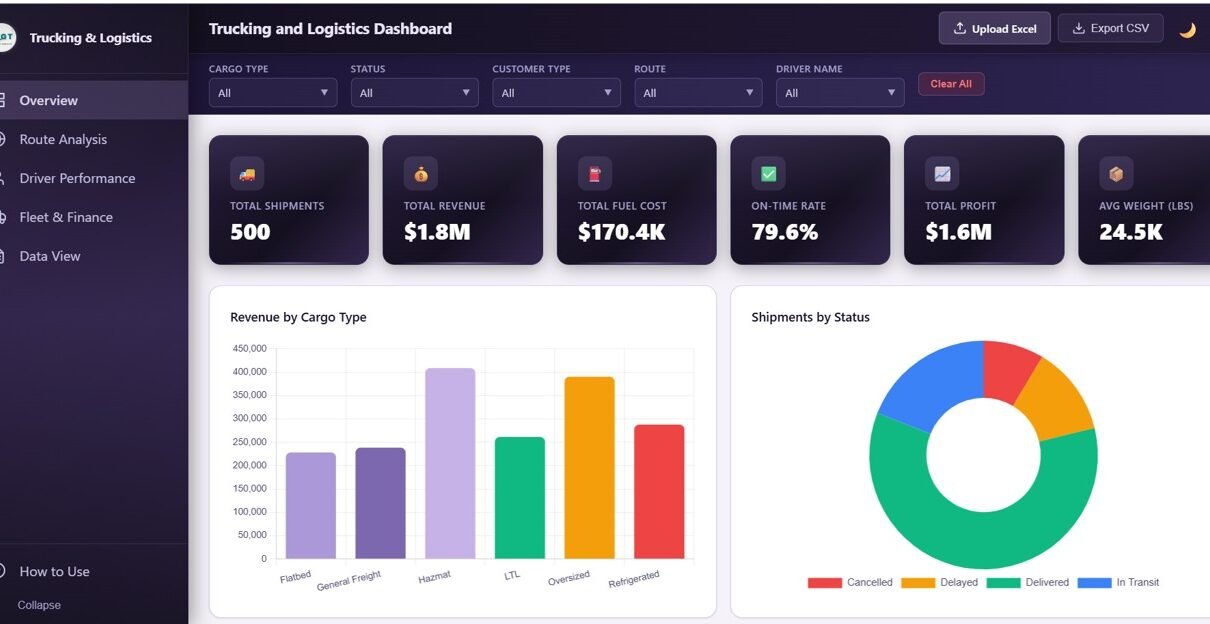
HVAC Service Dashboard in HTML — 5 pages, 6 KPIs, 20+ charts. Track revenue, technicians, regions and SLAs offline. $12.99 one-time, no SaaS subscription.
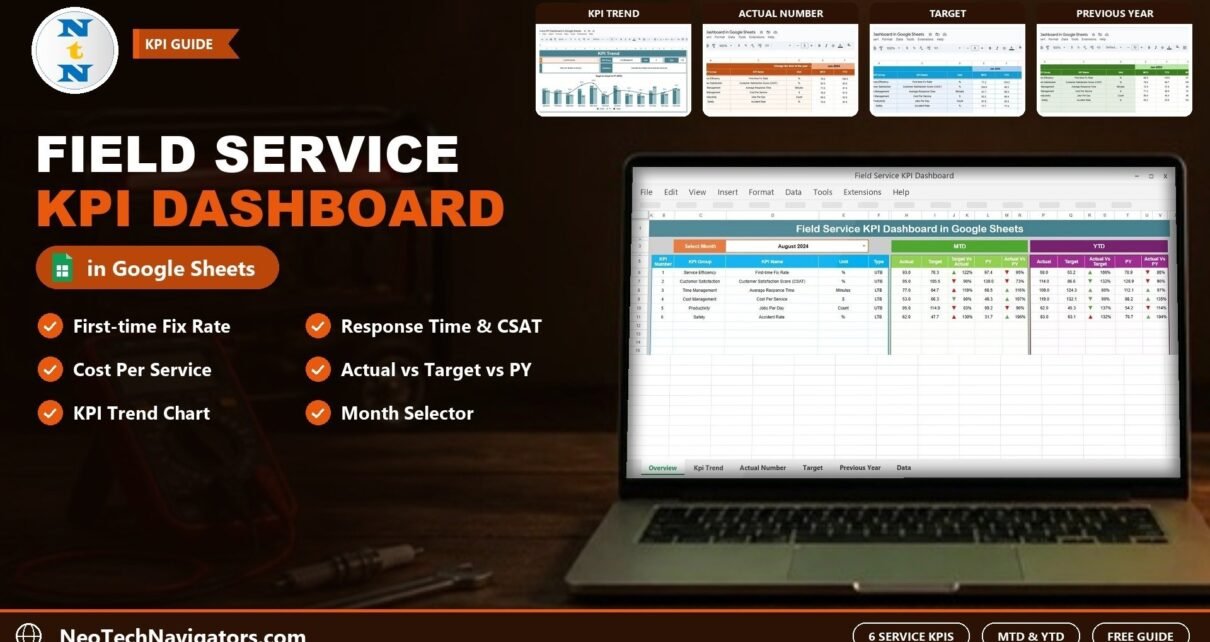
A Google Sheets KPI dashboard for field service teams that tracks First-time Fix Rate, CSAT, Average Response Time, Cost Per Service, Jobs Per Day and Accident Rate with MTD/YTD Actual vs Target vs Previous Year.