Managing reseller performance requires clear tracking, strong visibility, and timely decision-making. However, many businesses still rely on scattered reports and manual calculations. As a result, managers struggle to identify underperforming resellers, revenue gaps, and growth opportunities.
Therefore, companies now prefer structured digital dashboards. The Reseller KPI Dashboard in Google Sheets provides a powerful yet simple solution. It helps businesses track monthly and yearly performance, compare targets, monitor trends, and analyze reseller effectiveness — all in one interactive dashboard.
What Is a Reseller KPI Dashboard in Google Sheets?
Click to Buy Reseller KPI Dashboard in Google Sheets
A Reseller KPI Dashboard in Google Sheets is a performance monitoring system that tracks sales, profitability, growth, and operational efficiency of resellers.
Instead of reviewing multiple spreadsheets, managers view all KPIs in one structured dashboard. Moreover, they can switch months dynamically and analyze both MTD (Month-To-Date) and YTD (Year-To-Date) performance.
Because Google Sheets works online, teams collaborate in real time without version control issues.
Key Features of Reseller KPI Dashboard in Google Sheets
This dashboard contains 6 structured worksheets designed for full reseller performance tracking.
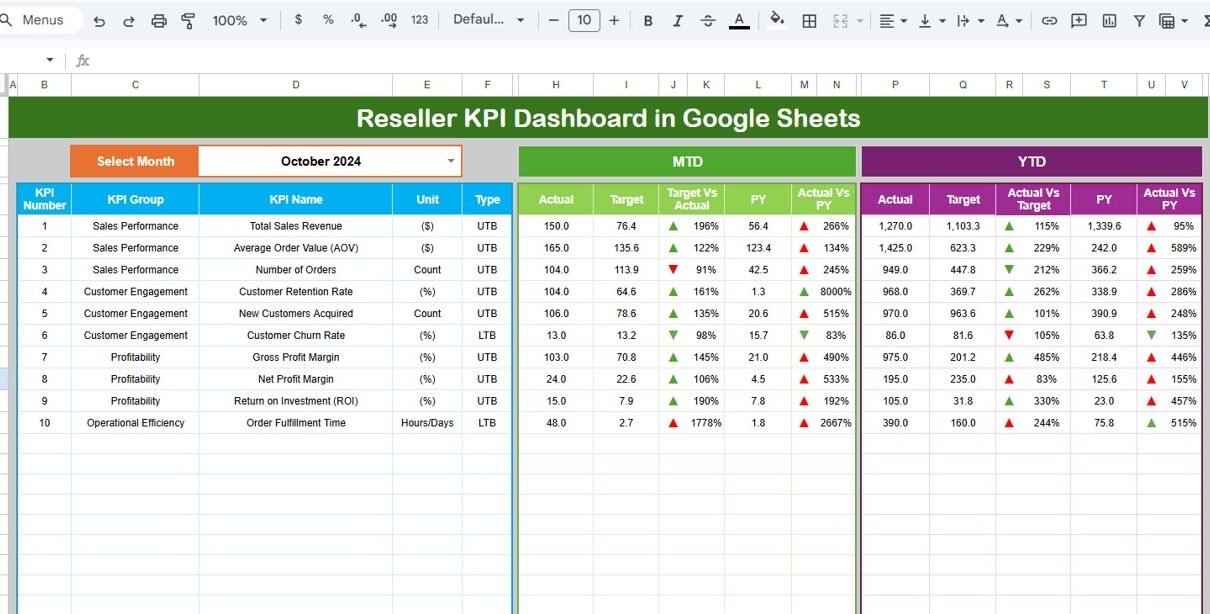
Dashboard Sheet Tab (Main Sheet)
This sheet acts as the central performance panel.
Key Highlights:
- Month selection dropdown in Cell D3
- Entire dashboard updates automatically based on selected month
- Displays:
MTD Section:
- MTD Actual
- MTD Target
- MTD Previous Year
- Target vs Actual (with up/down arrow)
- PY vs Actual (with up/down arrow)
YTD Section:
- YTD Actual
- YTD Target
- YTD Previous Year
- Target vs Actual comparison
- PY vs Actual comparison
- Conditional formatting indicators
Because of dynamic formulas, users analyze performance instantly.

Click to Buy Reseller KPI Dashboard in Google Sheets
KPI Trend Sheet Tab
This sheet provides detailed KPI-level insights.
Features:
-
KPI selection dropdown in Cell C3
-
Displays:
- KPI Group
- Unit
- KPI Type (LTB or UTB)
- Formula
- KPI Definition
Monthly trend chart visualization
YTD performance tracking
Therefore, managers easily analyze performance movement over time.

Click to Buy Reseller KPI Dashboard in Google Sheets
Actual Number Sheet Tab
This sheet captures current year actual values.
How It Works:
- Change month in Cell E1
- Enter MTD and YTD numbers
- Input first month of financial year in E1
- Data flows automatically to dashboard
Because of structured layout, data entry remains simple and organized.

Click to Buy Reseller KPI Dashboard in Google Sheets
Target Sheet Tab
In this sheet:
- Enter monthly MTD target
- Enter YTD cumulative target
- Targets update automatically in dashboard
Therefore, managers compare planned vs actual performance easily.

Click to Buy Reseller KPI Dashboard in Google Sheets
Previous Year Number Sheet Tab
This sheet stores last year’s performance data.
- Enter MTD values
- Enter YTD cumulative numbers
- Enables historical comparison
- Drives growth analysis
Because businesses need benchmarking, this sheet adds strong analytical value.

Click to Buy Reseller KPI Dashboard in Google Sheets
KPI Definition Sheet Tab
This sheet acts as KPI master data.
Fields Included:
- KPI Name
- KPI Group
- Unit
- Formula
- KPI Definition
- KPI Type (UTB / LTB)
This ensures clarity and consistency across reports.

Click to Buy Reseller KPI Dashboard in Google Sheets
Advantages of Reseller KPI Dashboard in Google Sheets
Using this dashboard delivers multiple strategic benefits.
Real-Time Monitoring
Managers track performance monthly without delay.
Clear Target Comparison
Visual indicators highlight overperformance or underperformance.
Historical Benchmarking
Previous year comparison reveals growth trends.
Improved Accountability
Each KPI has defined formula and owner.
Cloud Collaboration
Teams access data anytime, anywhere.
Data Transparency
Single source of truth reduces reporting errors.
Cost Effective
No expensive BI software required.
Best Practices for Reseller KPI Dashboard
Click to Buy Reseller KPI Dashboard in Google Sheets
To maximize effectiveness, follow these best practices.
1. Define KPIs Clearly
Always document formula and definition.
2. Update Data Monthly
Enter actual numbers consistently.
3. Review Trends Regularly
Use KPI Trend sheet for deeper insights.
4. Avoid Overloading KPIs
Focus on critical performance indicators.
5. Monitor LTB KPIs Closely
Track return rate, discount ratio, and payment days carefully.
6. Align Targets with Strategy
Set realistic but challenging targets.
7. Validate Data Accuracy
Double-check entries before reporting.
Conclusion
Click to Buy Reseller KPI Dashboard in Google Sheets
The Reseller KPI Dashboard in Google Sheets provides a structured, dynamic, and powerful performance management system. Because it integrates actual numbers, targets, and previous year comparisons, it gives leadership complete visibility.
Moreover, the dashboard supports real-time monitoring, better planning, and stronger financial control. Therefore, organizations that rely on reseller networks should adopt this KPI system to drive sustainable growth and profitability.
If you want structured reseller performance tracking with clear KPIs, automated comparisons, and trend analysis, this dashboard delivers exactly what you need.
Frequently Asked Questions (FAQs)
Click to Buy Reseller KPI Dashboard in Google Sheets
1. What is the main purpose of a Reseller KPI Dashboard?
It tracks reseller sales, profitability, growth, and operational performance in one system.
2. Can I customize the KPIs?
Yes. You can add or remove KPIs based on business needs.
3. What does UTB and LTB mean?
UTB means Upper the Better. LTB means Lower the Better.
4. How often should I update the dashboard?
You should update it monthly for accurate tracking.
5. Can multiple users access the dashboard?
Yes. Google Sheets allows real-time collaboration.
6. Does this dashboard support annual analysis?
Yes. It supports both MTD and YTD performance tracking.
Visit our YouTube channel to learn step-by-step video tutorials
Youtube.com/@NeotechNavigators
Watch the step-by-step video tutorial: