The Church Transaction Analysis Dashboard in Google Sheets helps churches turn income, expense, fund, vendor, payment method and status records into a clear reporting dashboard. Instead of reviewing hundreds of transaction rows one by one, treasurers and finance committees get headline KPI cards, slicers, income and expense charts, a Transaction ID lookup, a User Guide and one structured data sheet.
For many churches, the challenge is not collecting data but explaining it in monthly finance meetings. A spreadsheet may hold every tithe, offering, building fund gift, utilities bill, ministry expense and vendor payment, but leaders still need a visual way to answer simple questions. How much came in? How much went out? Which fund received the most giving? Which category drives expenses? Which transaction needs review?
This template is built for that workflow. It runs in Google Sheets, so the finance team can share it through Google Drive and work on it together in the browser.
🎥 Watch the Video Tutorial
Get the Church Transaction Analysis Dashboard
Key Features of the Church Transaction Analysis Dashboard in Google Sheets
The dashboard follows the way church finance teams usually review monthly records. The Overview page gives executive totals, while the Income and Expenses pages separate giving from spending, so one crowded report does not try to answer every question at once.
Each dashboard page has four slicers for fast filtering, such as Year, Type, Fund, Month, Category, Payment Method and Status. The Search tab adds a lookup for checking one Transaction ID at a time, and the User Guide explains how everything fits together.
Because it is a Google Sheets dashboard, it is easier to share than a desktop-only spreadsheet. A treasurer can keep edit rights, while pastors or committee members get view access for review meetings.
KPI Cards and Slicers by Page
| Page | KPI cards | Slicers |
|---|---|---|
| Overview | Total Income, Total Expenses, Net Surplus, Transactions | Year, Type, Fund, Month |
| Income | Total Income, Gift Count, Largest Gift, Avg Gift Size | Year, Fund, Category, Payment Method |
| Expenses | Total Expenses, Transactions, Largest Expense, Avg Expense | Year, Fund, Category, Status |
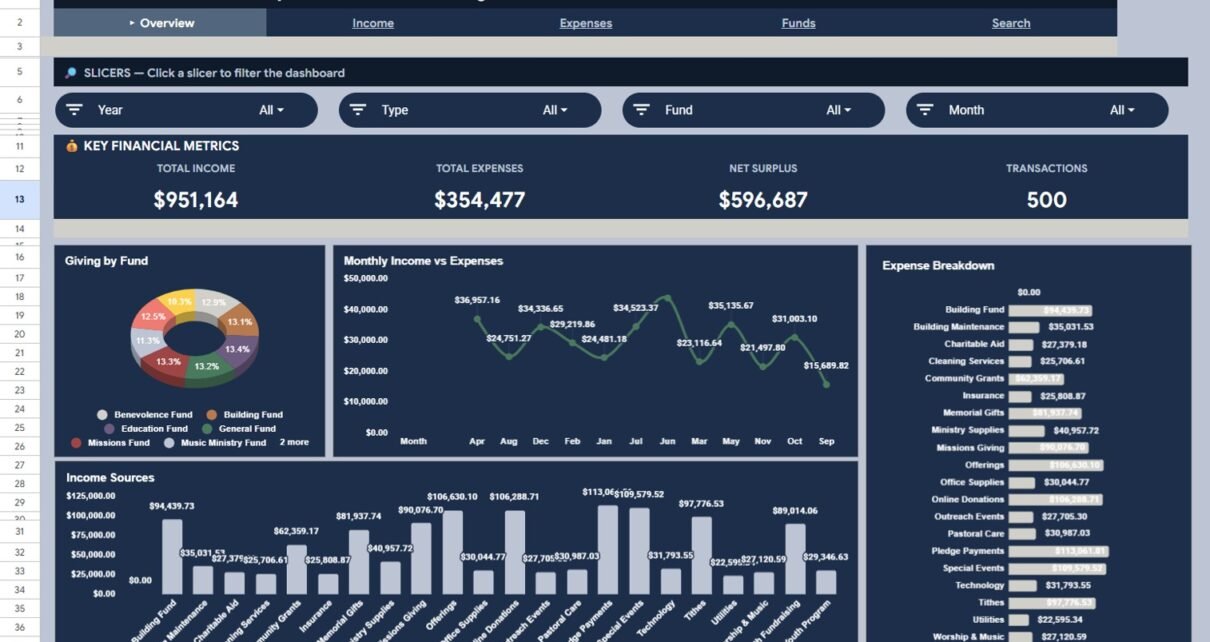
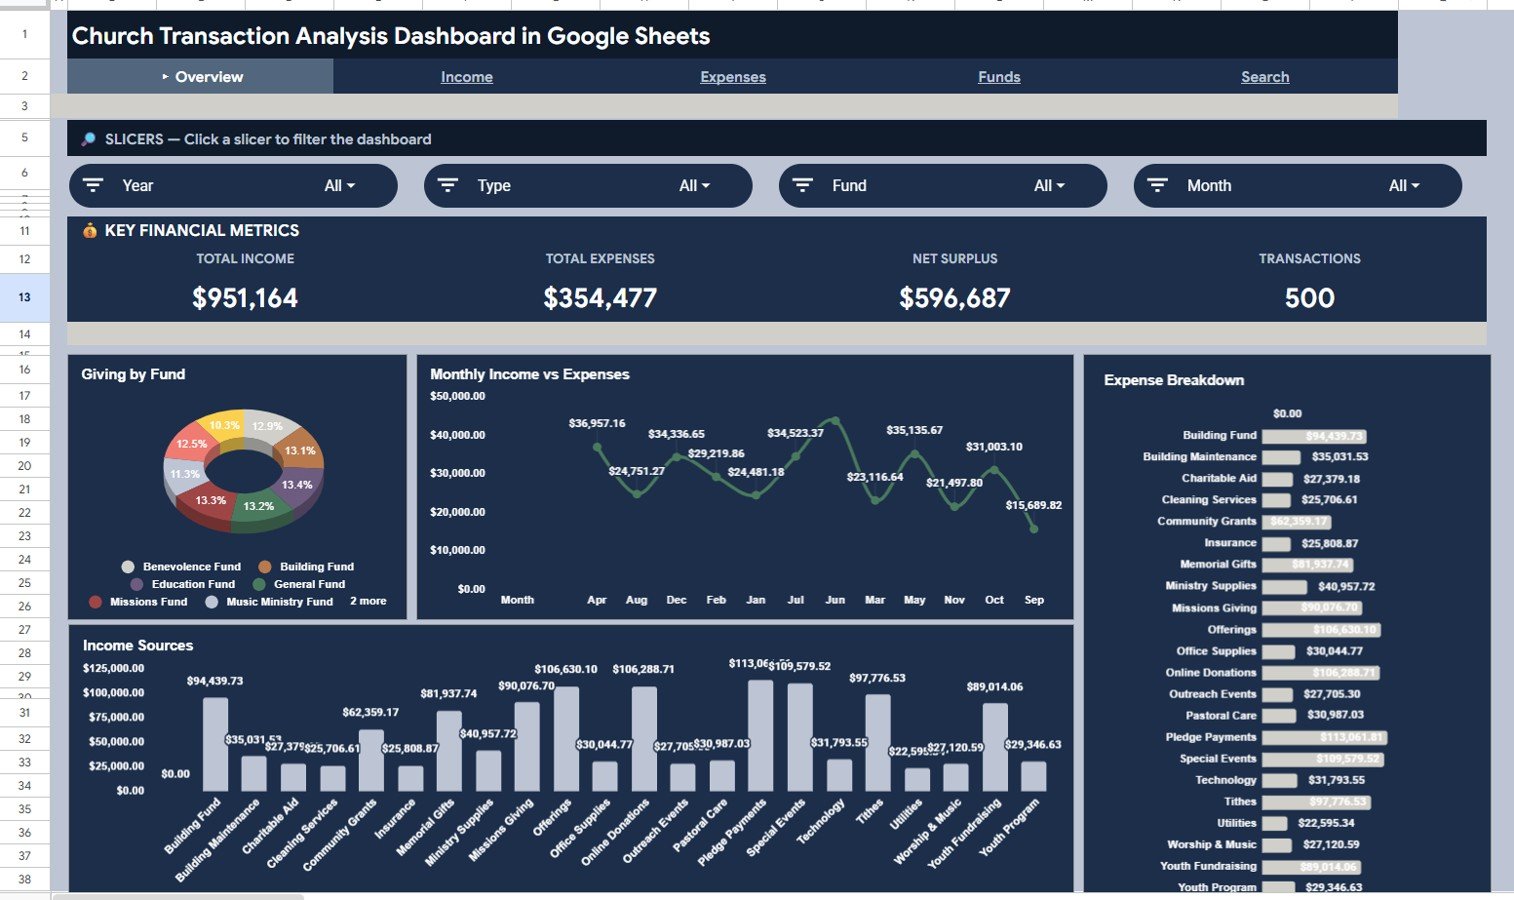
Net Surplus is Total Income minus Total Expenses. In the sample data that is $951,164 − $354,477 = $596,687, and the 500 sample transactions split into 287 gifts and 213 expenses.
Dashboard Pages Explained
1. Overview Page
The Overview page tells the high-level story of church finances. The cards at the top show Total Income, Total Expenses, Net Surplus and Transactions, which give the finance team an immediate read on whether the period is healthy or needs attention.
Giving by Fund: shows how giving is spread across funds such as the Benevolence, Building, Education, General, Missions and Music Ministry funds. It helps leaders see which funds are well supported and which may need more communication.
Monthly Income vs Expenses: plots monthly totals across the year, so you can spot high-expense months and seasonal patterns before they become a budgeting problem.
Income Sources and Expense Breakdown: list totals by category, such as Tithes, Offerings, Pledge Payments, Online Donations, Building Maintenance, Utilities, Pastoral Care and Technology. Use the Type slicer to show only Income or only Expense records.
2. Income Page
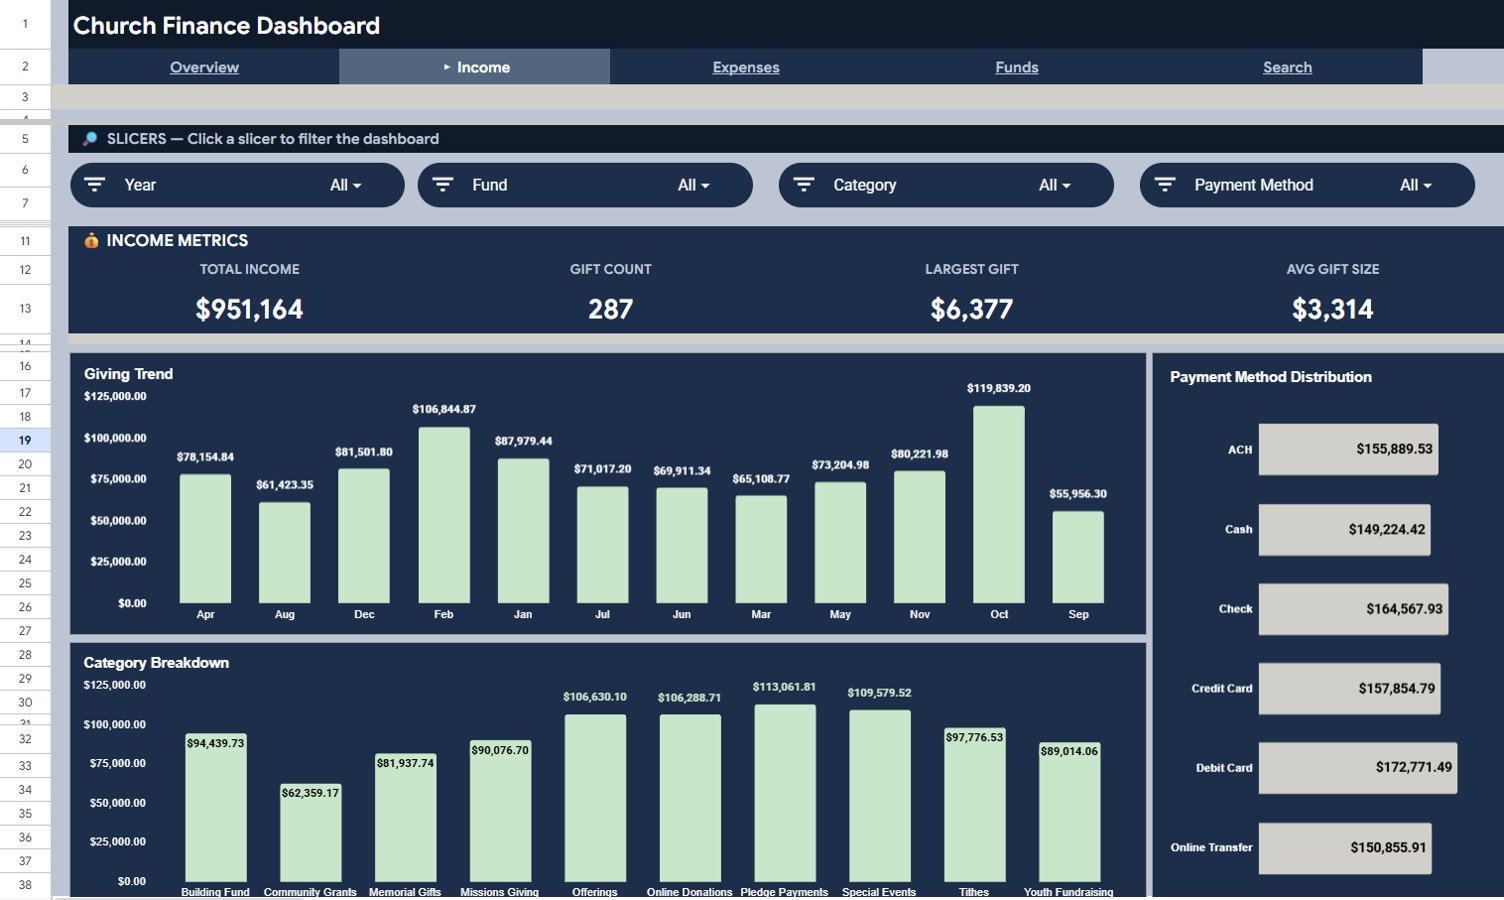
The Income page focuses only on incoming transactions. Its cards are Total Income, Gift Count, Largest Gift and Avg Gift Size, and its charts are Giving Trend, Payment Method Distribution and Category Breakdown.
Use this page to understand giving behaviour. The monthly trend shows whether giving is stable or seasonal. Payment Method Distribution compares ACH, Cash, Check, Credit Card, Debit Card and Online Transfer, and Category Breakdown shows the mix of income sources.
3. Expenses Page
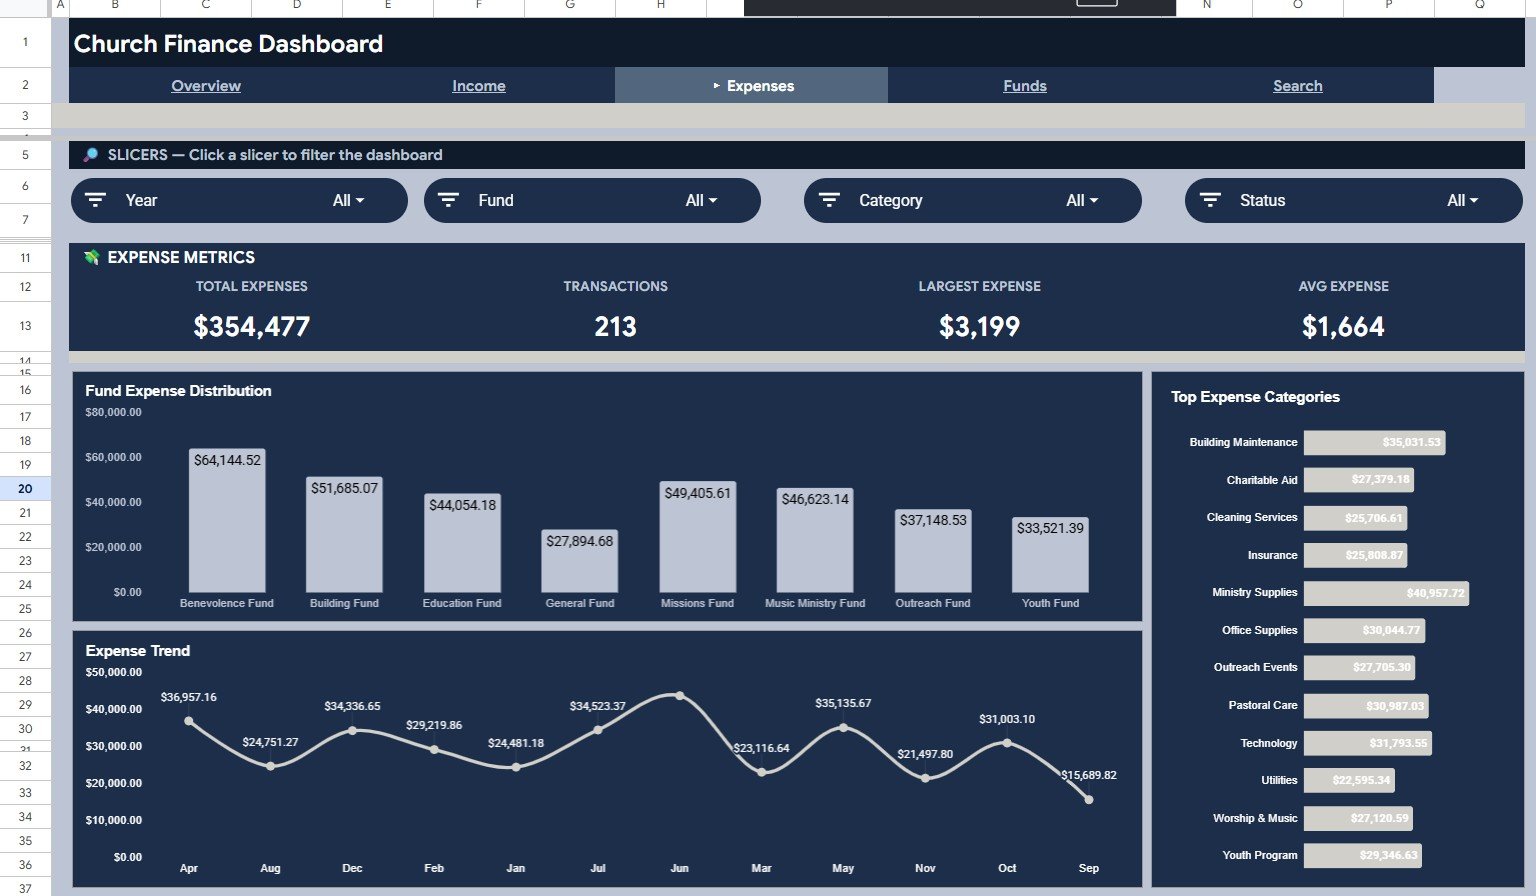
The Expenses page focuses only on outgoing transactions. Its cards are Total Expenses, Transactions, Largest Expense and Avg Expense, and its charts are Fund Expense Distribution, Top Expense Categories and Expense Trend.
This page shows where money is being used. Fund Expense Distribution shows how each fund supports spending, Top Expense Categories highlights the largest cost areas, and Expense Trend reveals recurring spikes or unusual changes.
4. Funds Page
The navigation bar also includes a Funds page. According to the template’s User Guide, it shows per-fund performance, total activity and monthly giving by fund.
5. Search Page
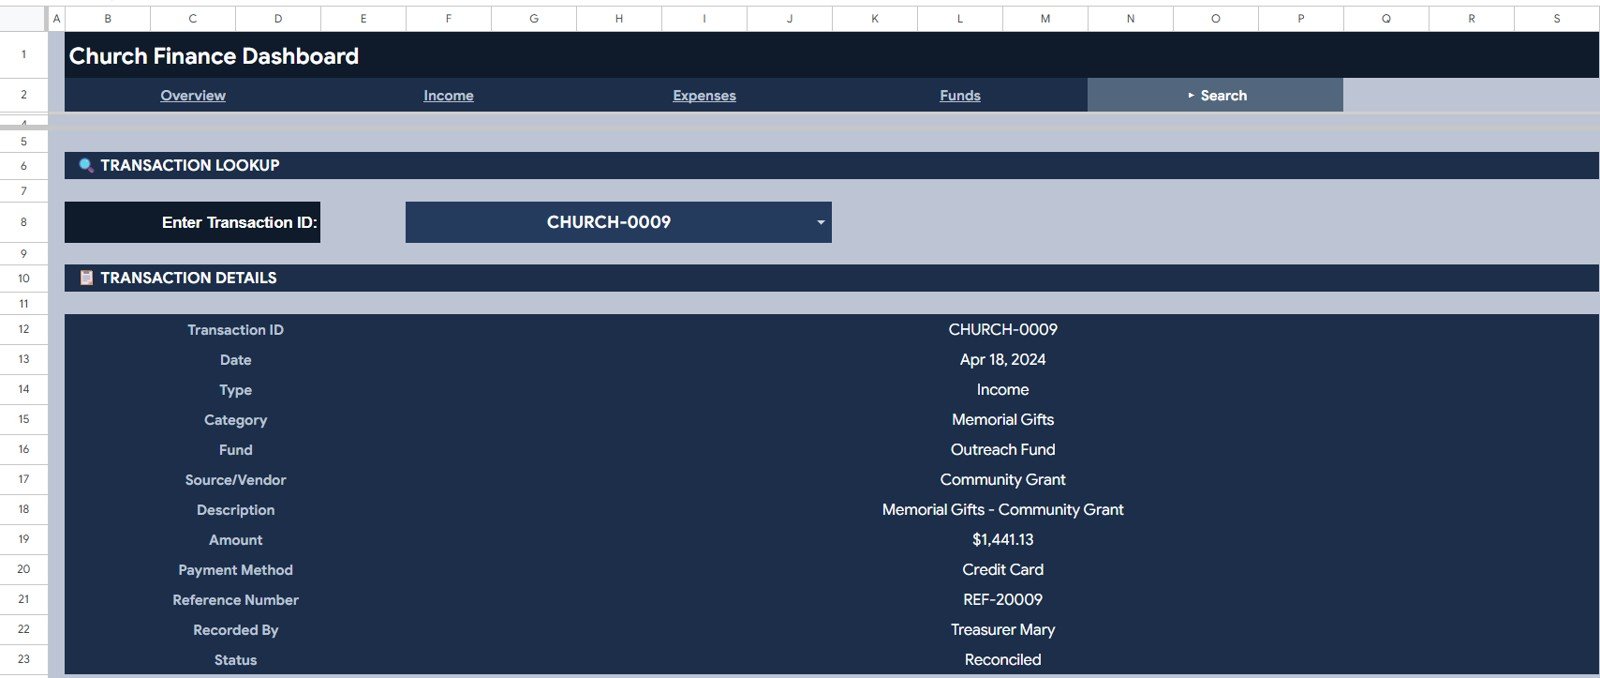
The Search page is a transaction lookup. Select a Transaction ID from the dropdown and it shows the Transaction ID, Date, Type, Category, Fund, Source/Vendor, Description, Amount, Payment Method, Reference Number, Recorded By and Status.
This is useful during audits, committee questions, vendor checks and monthly reviews. Instead of filtering the raw data, you pull one complete record in a clean view.
6. User Guide Page
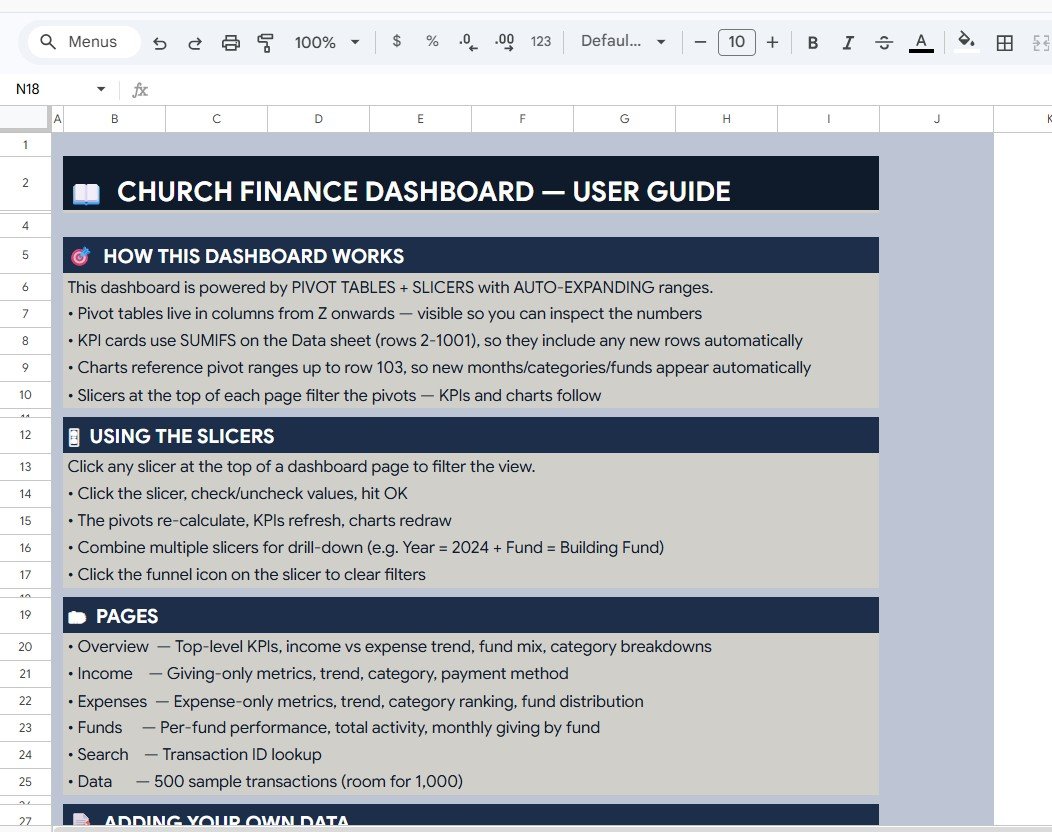
The User Guide explains how the dashboard works. It is powered by pivot tables and slicers with auto-expanding ranges, and the KPI cards use SUMIFS on the Data sheet. The guide also covers how to use the slicers, what each page shows and how to add your own data. This helps volunteer finance teams, because not every user needs advanced spreadsheet knowledge.
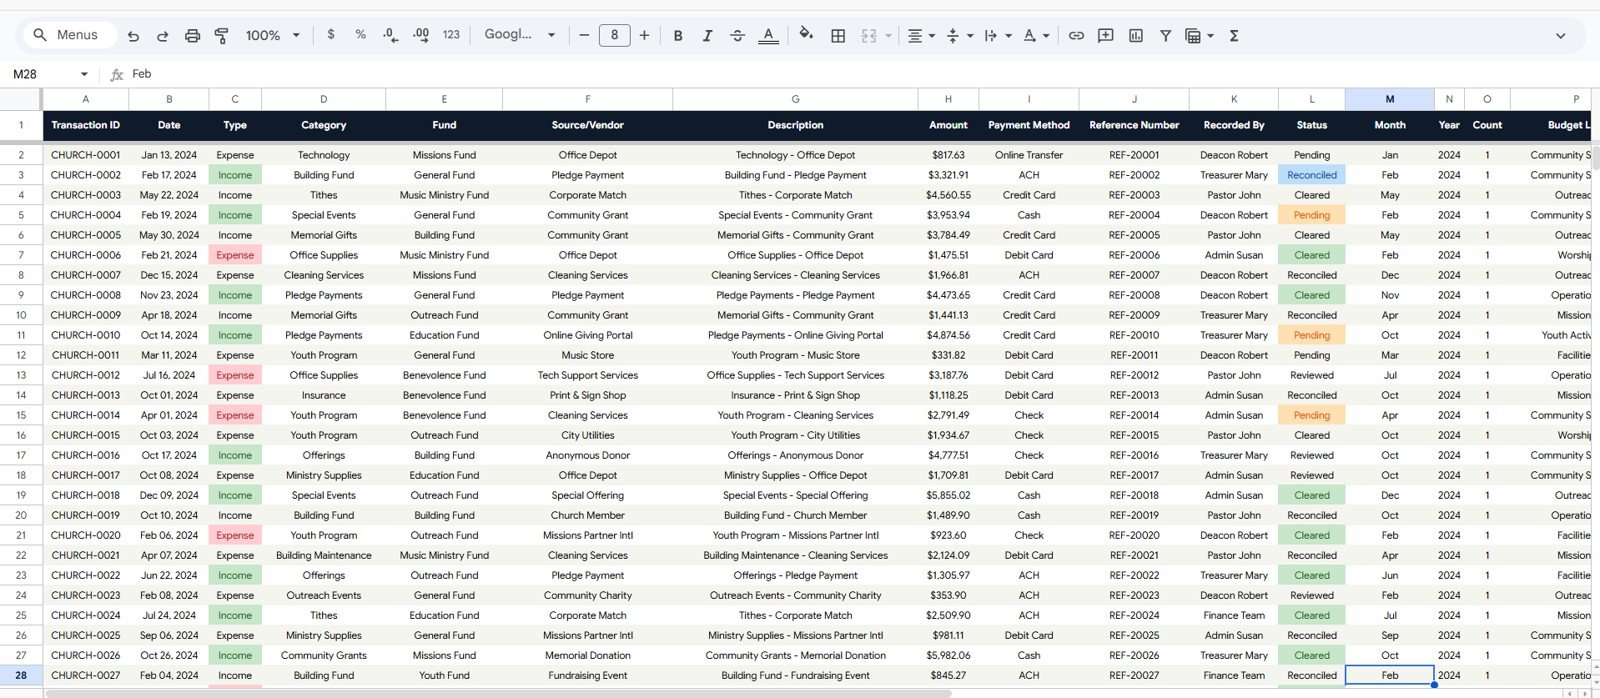
7. Data Sheet
The Data Sheet is the source table. Its columns include Transaction ID, Date, Type (Income or Expense), Category, Fund, Source/Vendor, Description, Amount, Payment Method, Reference Number, Recorded By, Status, Month and Year. Status values in the sample include Pending, Cleared, Reviewed and Reconciled. The template ships with 500 sample transactions and room for 1,000. Add or replace records in the same format and the pages, slicers, charts and Search tab keep working.
Church Transaction Analysis Dashboard in Google Sheets vs. Excel vs. Church Management Software
| Feature | Google Sheets Dashboard | Microsoft Excel Dashboard | Paid Church Software |
|---|---|---|---|
| Cost | One-time purchase | One-time template cost | Monthly or annual subscription |
| Platform | Browser-based Google Sheets | Desktop Excel or Microsoft 365 | Vendor web app |
| Setup time | Copy file and replace data | Open workbook and refresh data | Account setup and onboarding |
| Real-time team collaboration | Native sharing through Google Drive | Possible with OneDrive | Usually role-based |
| Mobile access | Google Sheets app | Excel app | Vendor app |
| Customizable fields | Editable spreadsheet columns | Editable workbook | Limited by vendor settings |
| Transaction lookup | Built-in Search tab | Depends on file design | Usually available |
| Donor receipts and bank reconciliation | No | No | Usually yes |
Who Should Use This Template
This template suits church treasurers, pastors, ministry administrators, finance committees, nonprofit bookkeepers and volunteer teams that already have transaction data and need visual reporting. It also helps small and mid-size churches that want a clear reporting file without subscribing to a full church management platform.
It is not meant to replace accounting software, donation processing, payroll, bank reconciliation, donor tax statements or member management. Think of it as a reporting layer for prepared transaction data.
Real-World Use Cases
Maria, church treasurer: updates the Data Sheet each month and presents Total Income, Total Expenses, Net Surplus and Transactions from the Overview page at finance committee meetings.
David, senior pastor: reviews Giving by Fund before board updates so he can explain how the general, missions, building and outreach funds are moving.
James, volunteer bookkeeper: uses the Search tab when someone asks about a specific vendor payment, payment method or reference number.
Advantages of the Church Transaction Analysis Dashboard in Google Sheets
The main advantage is clarity. Income, expenses and lookups each have their own tab, so users do not need to search raw rows for every answer. Slicers make filtering fast, and Google Sheets sharing keeps everyone on the same version of the file.
The second advantage is cost control. Instead of paying a monthly fee for a reporting system, the church uses a one-time template and keeps its data in its own Google Drive.
Limitations to Know
The dashboard is spreadsheet-based, so it does not connect to bank accounts, online giving platforms or accounting systems. If a church needs direct imports, approval workflows, donor receipts or automated reconciliation, it should use dedicated accounting or church management software alongside this dashboard.
Protect the Data Sheet from accidental edits once your records are loaded. Keep one owner responsible for structure changes and give other users view-only access where possible.
Best Practices
- Keep the Data Sheet column order unchanged and add new records below the existing rows.
- Use consistent names for funds, categories and payment methods so charts do not split one item into several spellings.
- Check the Search tab during monthly close to confirm that reference numbers, Recorded By and Status fields are complete.
- Use Google Drive permissions carefully so the dashboard can be reviewed without giving everyone edit access. Google’s guide to sharing files from Google Drive explains the options.
Related Templates and Guides
For a broader church view, see the Church Finance Dashboard in Google Sheets, also available in Excel and in Power BI.
On NeoTech Navigators, you can read the full walkthrough of the Church Finance Dashboard in Google Sheets and its HTML version. Churches that also run grants or appeals may like the Nonprofit Grant Dashboard, the Nonprofit Fundraising Dashboard and the Donation Management Tracker.
Since this dashboard runs on pivot tables and slicers, the Excel Pivot Tables and Dashboards course on NextGenTemplates Academy is a good next step if you want to customise it or build your own.
Frequently Asked Questions
What does the Church Transaction Analysis Dashboard in Google Sheets track?
It tracks church transactions across income, expenses, funds, categories, sources or vendors, payment methods, reference numbers, Recorded By and status, with a Transaction ID lookup.
Can I use this dashboard for my own church funds?
Yes. Replace the sample records with your own funds and categories while keeping the same column structure in the Data Sheet.
Does the dashboard include a search tool?
Yes. The Search page lets you select a Transaction ID and see the full record straight away.
Do I need Excel to use it?
No. The template is built for Google Sheets and runs in your browser with a Google account.
Can multiple people review the dashboard?
Yes. Share the file through Google Drive with view or edit permissions.
Is this a replacement for church accounting software?
No. It is a dashboard for analysis and reporting. Use it alongside accounting or donation systems for official bookkeeping, bank reconciliation, receipts and tax reporting.
About the Author
Built by PK, a Microsoft Certified Professional with 15+ years of Excel, Google Sheets and Power BI experience. He founded NextGenTemplates, and its YouTube channels reach 300K+ subscribers. Every template is built by hand and tested before release.
Wrapping Up
The Church Transaction Analysis Dashboard in Google Sheets gives churches a practical way to review income, expenses, funds, vendors, payment methods and individual transactions without building charts from scratch. It is simple enough for volunteer teams, structured enough for monthly finance meetings and easy to share through Google Drive.
Get the Church Transaction Analysis Dashboard
📅 Last updated: October 2026