Fintech reporting gets noisy when transaction value, fee revenue, status, platform, region, risk, and analyst data sit in separate exports. The Fintech Dashboard in Google Sheets brings those records into 7 sheet tabs, 4 top cards, 20 chart views, multiple slicers, a transaction lookup page, and a data input sheet. It is built for teams that need transaction review without another monthly dashboard subscription.Fintech Dashboard in Google Sheets
Click here to Purchase the Fintech Dashboard in Google Sheets
Key Features of Fintech Dashboard in Google Sheets
- 7 connected sheet tabs: Overview, Product Mix, Platform Split, Revenue Engine, Risk Center, Search, and Data.
- 4 headline KPI cards: Gross TXN Value, Total Transactions, Fee Revenue, and Success Rate.
- 20 chart views: Track monthly transaction volume, product performance, region value, platform share, fee revenue, user segments, risk levels, analyst workload, processing time, and experience score.
- Multiple slicers: Filter dashboard views quickly by fields such as month, product, region, platform, segment, status, or risk level.
- Transaction Lookup sheet: Select a Txn ID and review the complete transaction record from one place.
- Editable Data sheet: Replace sample records in the same format and refresh the dashboard analysis from your own data.
- Google Sheets sharing: Share the dashboard through Google Drive for team review, comments, or controlled editing.
Dashboard Pages Explanation
1. Overview Page
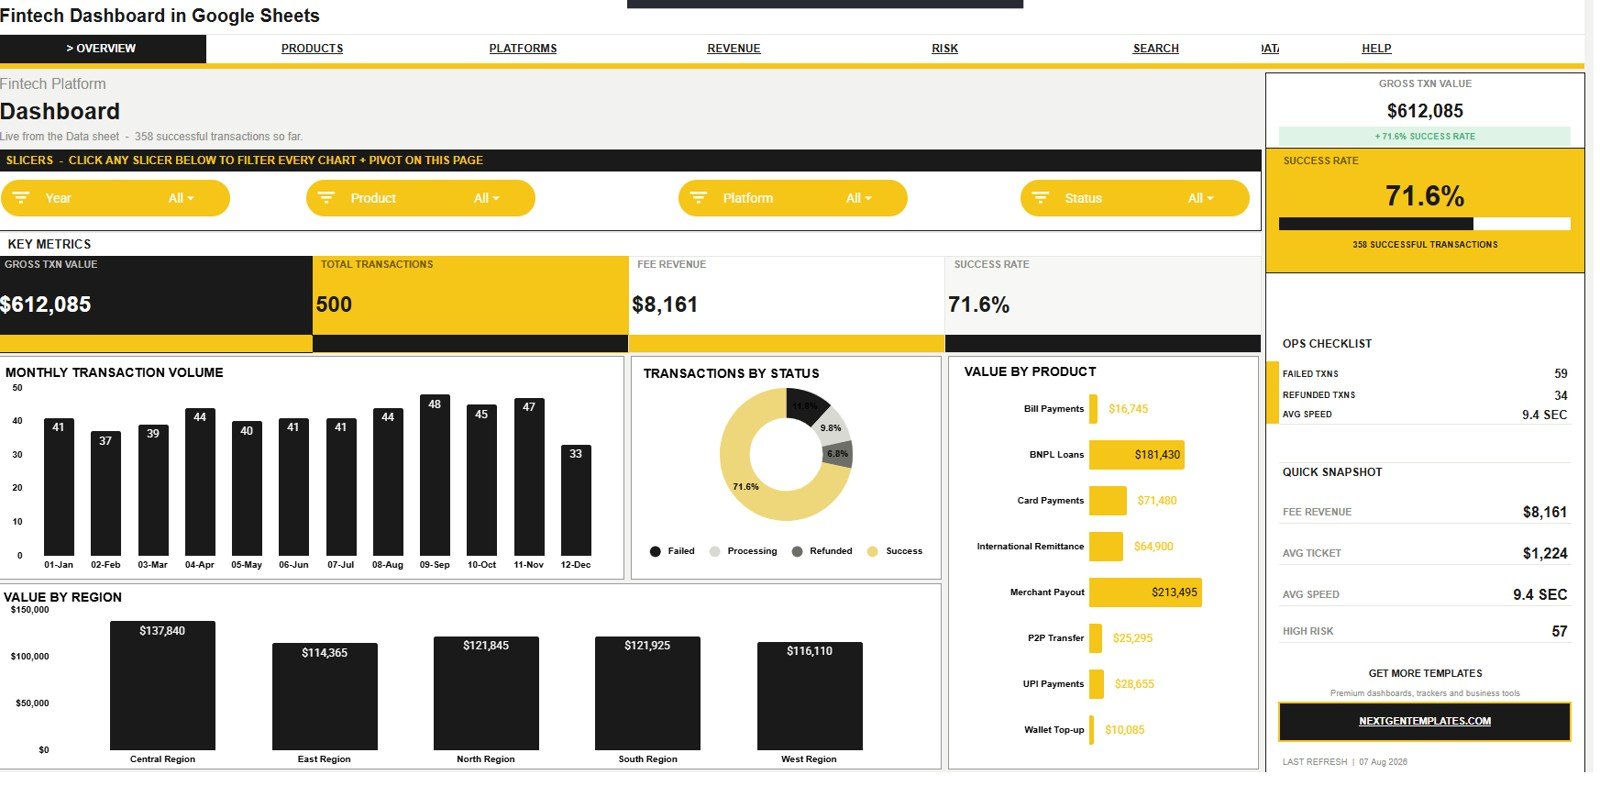
The Overview Page is the high-level command page. The top cards show Gross TXN Value, Total Transactions, Fee Revenue, and Success Rate so a fintech team can understand value, volume, monetization, and completion quality before opening deeper pages.
Monthly Transaction Volume by Month: This chart shows transaction count by month. Use it to compare growth, seasonal behavior, and changes after campaigns, launches, or operational changes.
Transactions by Status: This chart separates transactions by status. It helps the team see successful, failed, pending, reversed, or review-needed records instead of relying only on total count.Fintech Dashboard in Google Sheets
Value by Product: This chart compares transaction value across product lines. It helps identify whether wallets, cards, lending, merchant payments, remittances, or other products are driving the most value.Fintech Dashboard in Google Sheets
Value by Region: This chart shows transaction value by region. It helps leaders compare markets and decide where growth, support, or risk review needs more attention.
2. Product Mix
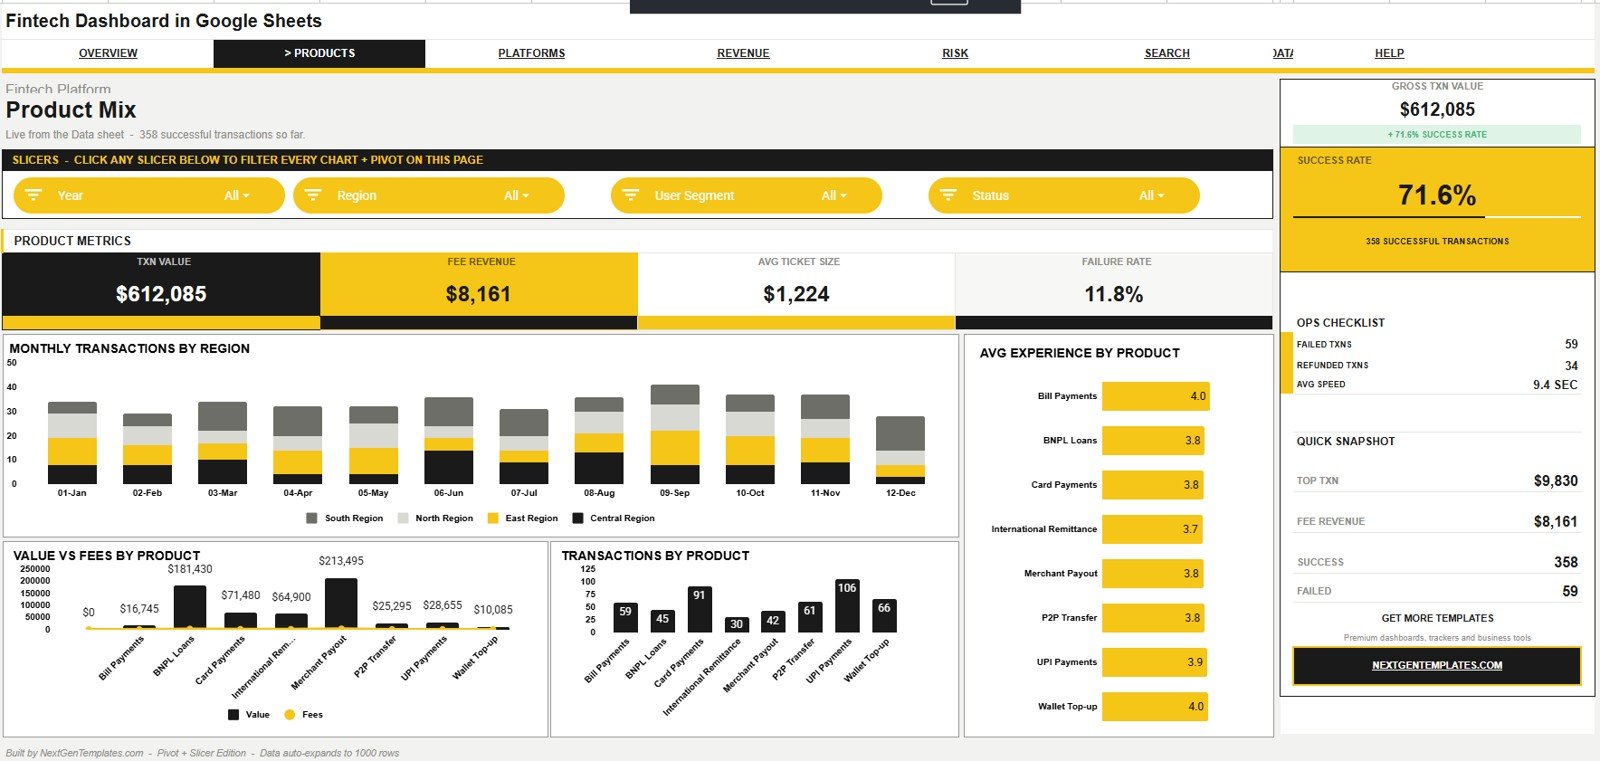
The Product Mix sheet focuses on how each product contributes to usage, value, revenue, and experience. It is helpful when the business needs to know which products are scaling and which products need experience or pricing review.
Monthly Transactions by Region: This chart tracks transaction count by region over months. Use it to see whether regional growth is broad-based or concentrated in a few markets.
Average Experience by Product: This chart compares customer or user experience score by product. It helps uncover products that have strong value but weaker user satisfaction.
Transaction Value and Fee Revenue by Product: This chart compares product-level transaction value with related fee revenue. It helps separate high-value products from the products that actually produce more fee income.
Transactions by Product: This chart shows the transaction count for each product. It helps identify usage leaders and products that may need promotion, education, or redesign.
3. Platform Split
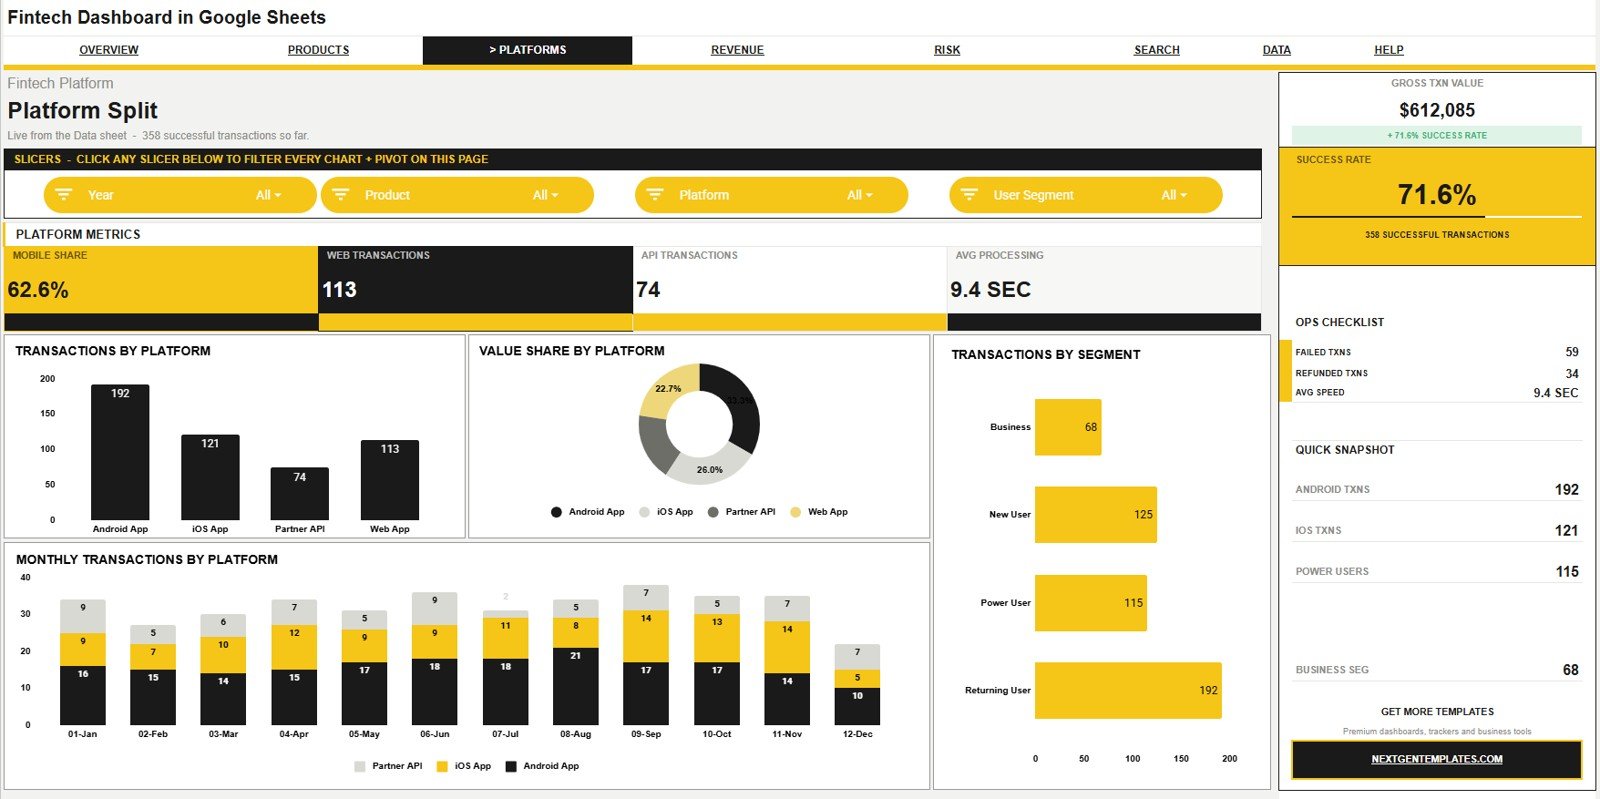
The Platform Split sheet reviews transaction activity by platform and user segment. It is useful for fintech teams that need to compare app, web, API, partner, or channel performance in one view.
Transactions by Platform: This chart compares transaction count by platform. It helps reveal whether users rely more on mobile, web, API, merchant, partner, or other transaction channels.
Value Share by Platform: This chart shows how transaction value is distributed across platforms. It helps identify channels with smaller volume but larger value, or high-volume channels with lower value share.
Transactions by User Segment: This chart compares transaction count across user segments. It helps teams evaluate retail, merchant, premium, enterprise, new, or returning customer behavior.
Monthly Transactions by Platform: This chart tracks platform activity across months. It helps spot channel shifts, migration trends, and changes after app releases or partner launches.
4. Revenue Engine
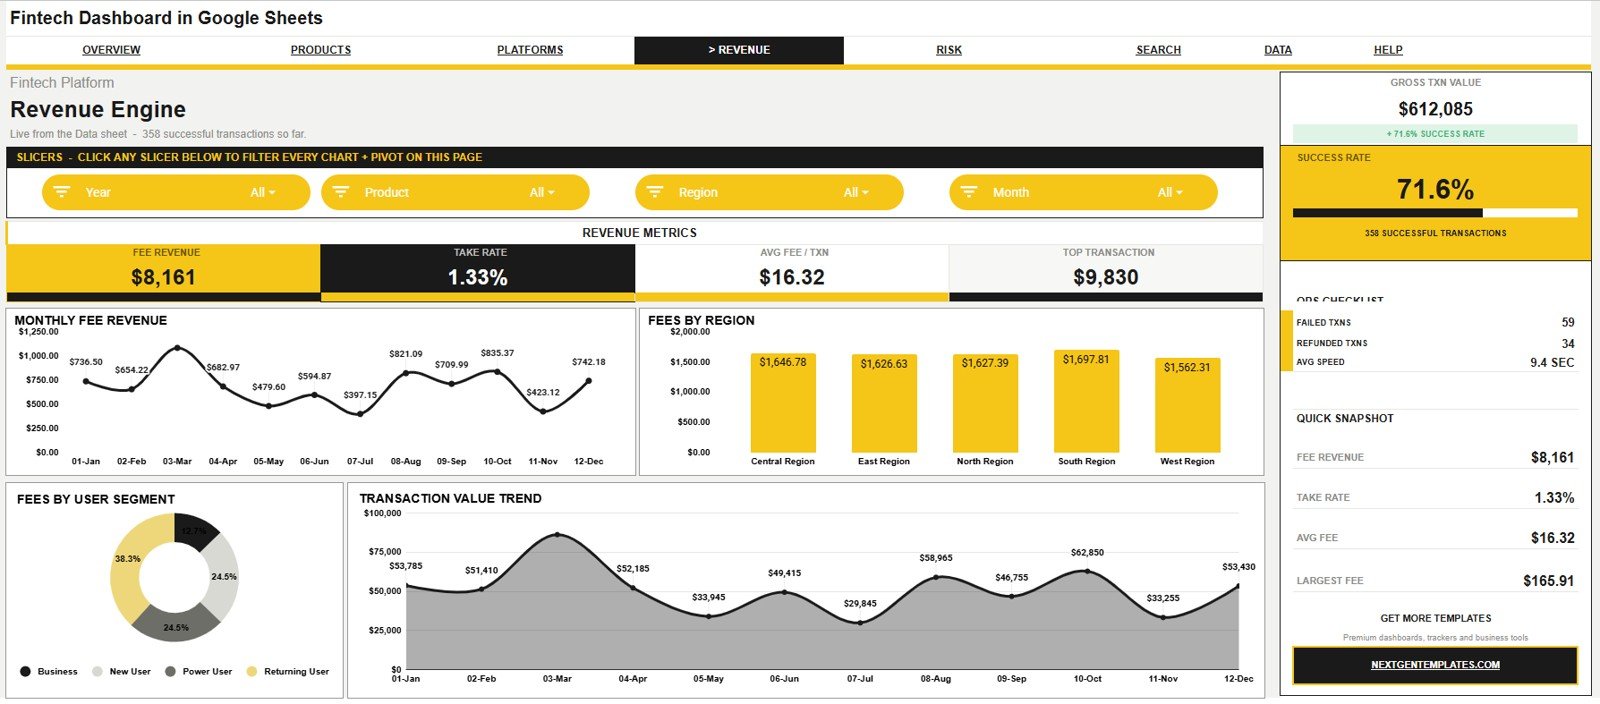
The Revenue Engine sheet connects transaction movement with fee revenue. It gives finance and product teams a way to compare value, fees, region, and segment without building separate reports.
Monthly Fee Revenue by Month: This chart shows fee revenue over time. Use it to review whether monetization is rising along with transaction activity or lagging behind volume.
Fees by Region: This chart compares fee revenue by region. It helps identify which markets are monetizing best and which regions may need pricing, adoption, or product review.
Fee Revenue by User Segment: This chart shows which customer or user segments create the most fee revenue. It helps refine target segments, pricing discussions, and retention priorities.
Transaction Value by Month: This chart shows monthly transaction value. It helps compare revenue movement with the underlying value moving through the fintech platform.
5. Risk Center
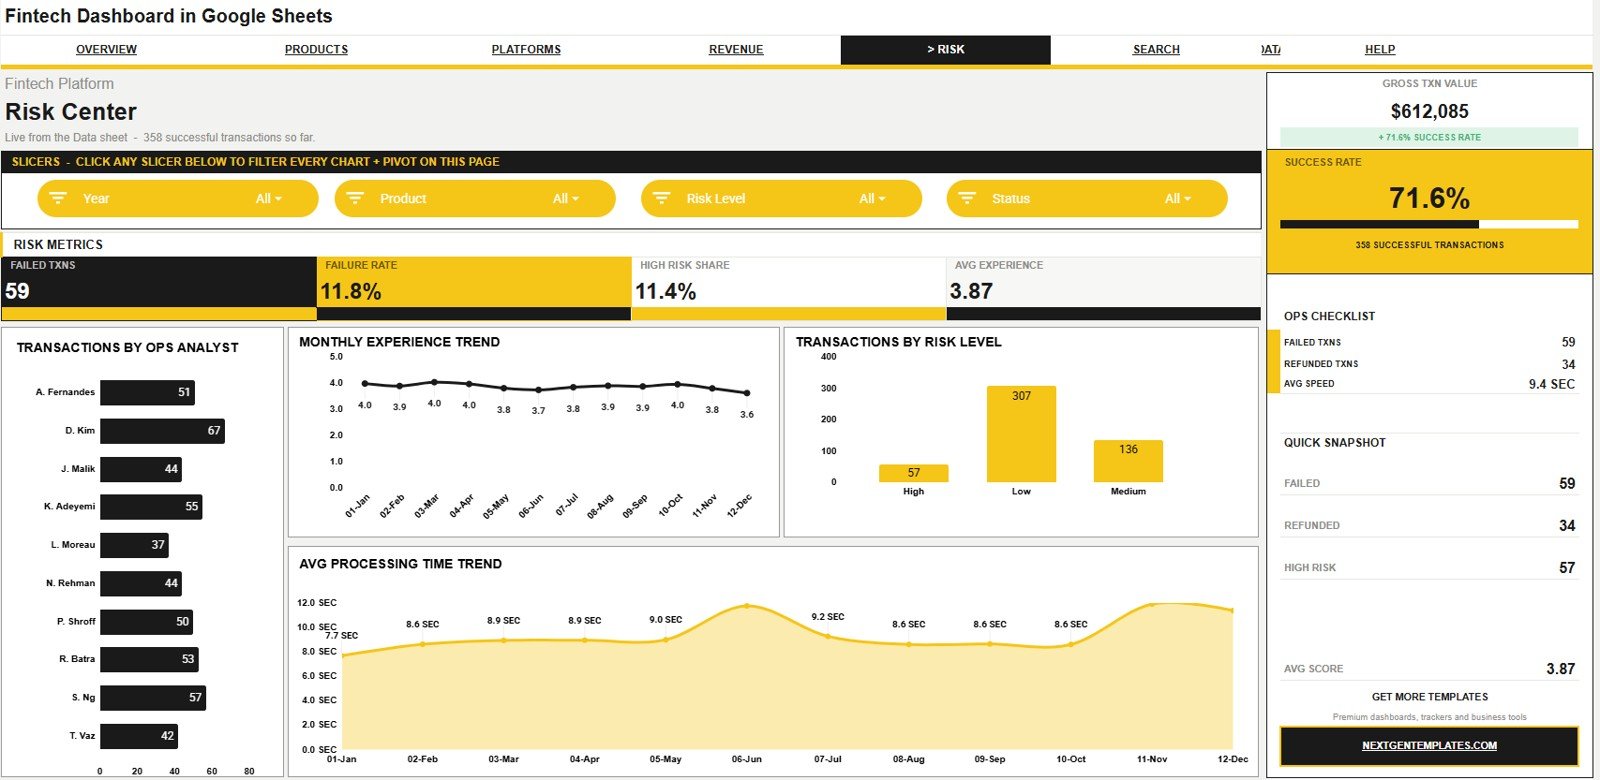
The Risk Center sheet brings operations, risk, and customer experience into the same review page. It is especially useful for teams that need to monitor processing speed, risk levels, and analyst workload.
Transactions by Ops Analyst: This chart compares transaction count by analyst. It helps managers see workload distribution and spot where review queues may be uneven.
Average Experience by Month: This chart tracks average experience score over time. It helps connect operational changes with customer experience movement.
Transactions by Risk Level: This chart separates transaction count by risk level. It helps the risk team see whether low, medium, high, or flagged activity is changing.
Average Processing Time by Month: This chart shows processing time by month. It helps identify whether transaction handling is becoming faster or slower as volume changes.
6. Search Sheet Tab
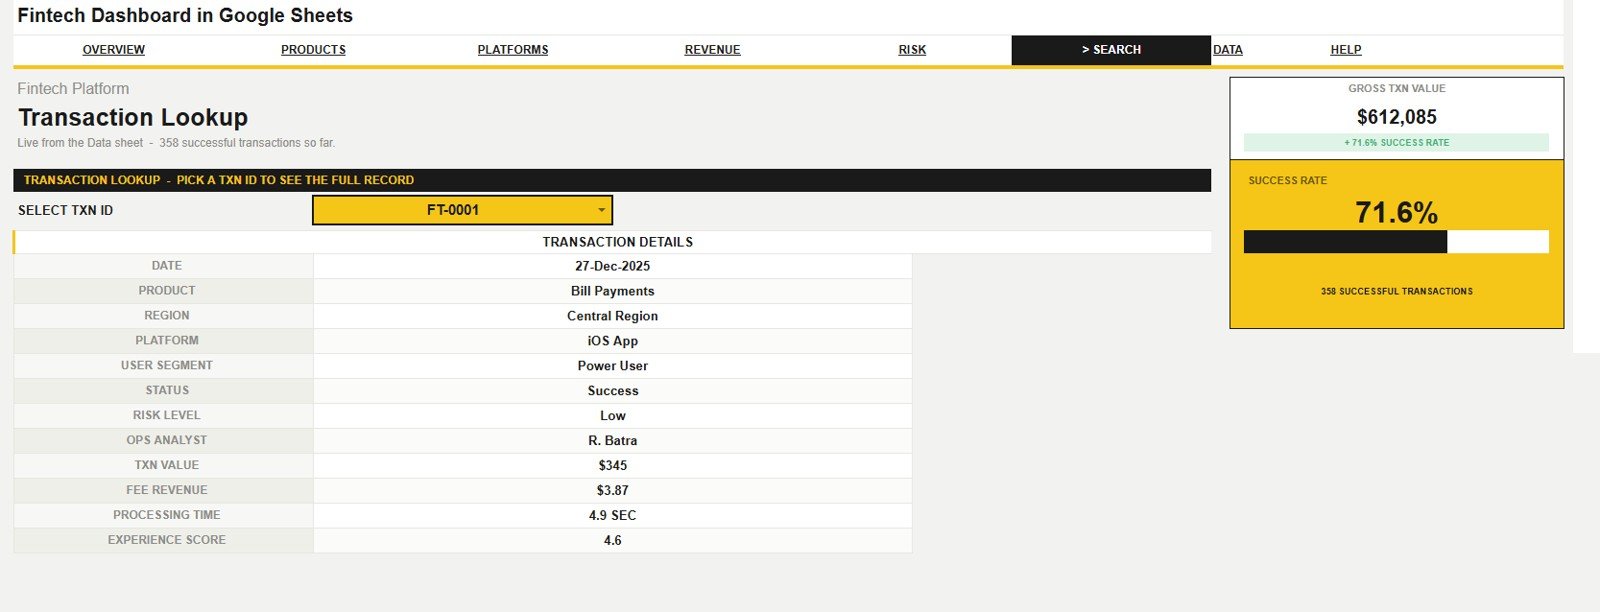
This is the Transaction Lookup sheet. Select a Txn ID to see the full record for a specific transaction, including date, product, region, platform, user segment, status, risk level, ops analyst, transaction value, fee revenue, processing time, and experience score.
7. Data Sheet Tab
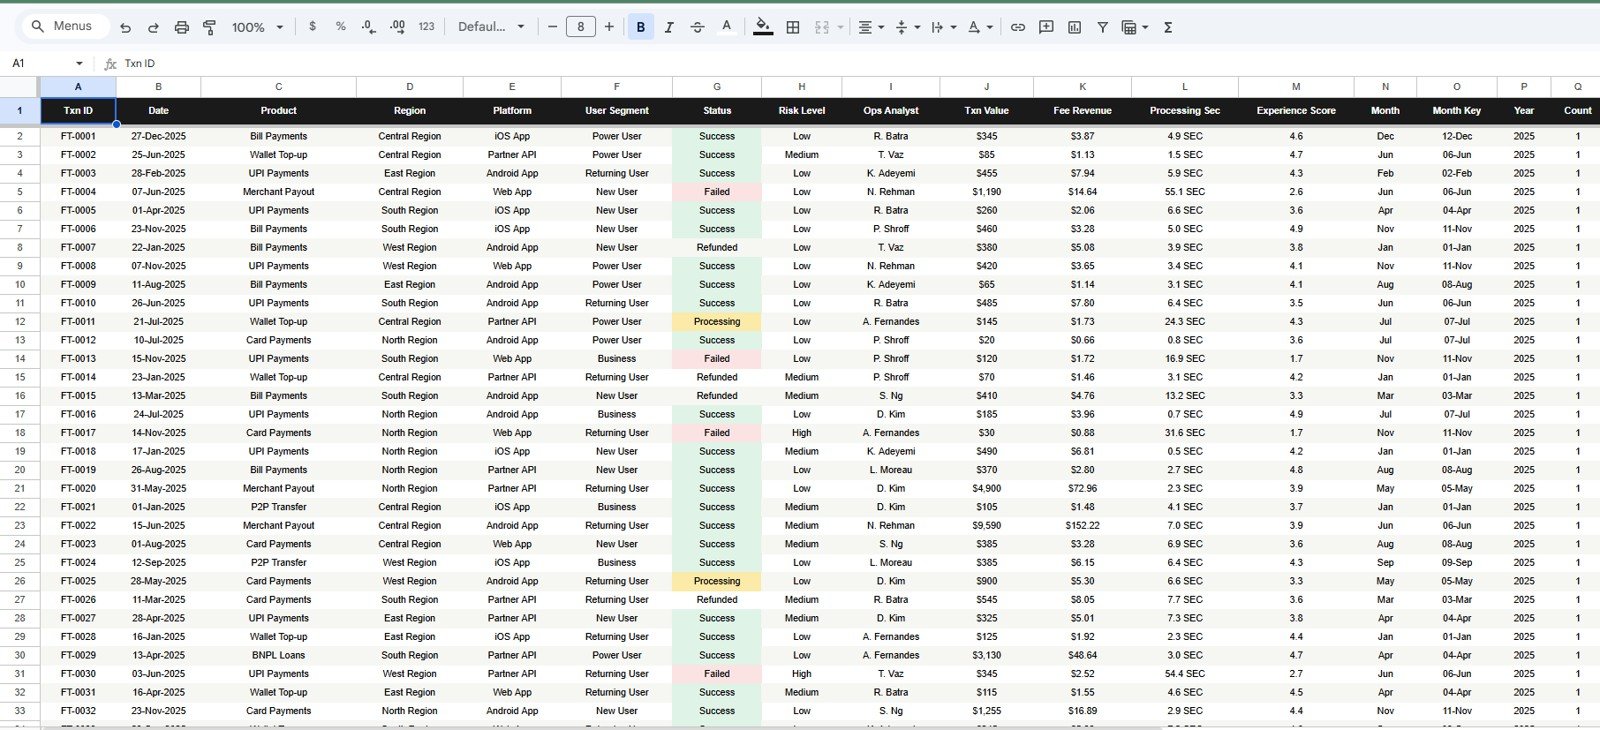
This is the Data sheet. Add your transaction records in the same format as the sample data so the cards, charts, slicers, and transaction lookup continue to work correctly.
Fintech Dashboard in Google Sheets vs. Microsoft Excel Dashboard vs. Paid Fintech SaaS – Feature Comparison
| Feature | Fintech Dashboard in Google Sheets | Microsoft Excel dashboard | Paid fintech SaaS or BI tool |
|---|---|---|---|
| Cost | $9.99 one-time template price | Template price plus Microsoft access | Monthly or annual subscription |
| Platform | Google Sheets in browser and Drive | Excel desktop or web | Vendor cloud or BI platform |
| Setup time | Copy file and replace sample records | Open workbook and configure sharing | Connector setup or analyst build |
| Real-time team collaboration | Native Google Sheets sharing | Depends on OneDrive or SharePoint | Usually plan-based |
| Mobile access | Google Sheets app or mobile browser | Excel app or browser | Usually included |
| Customizable fields | Edit product, platform, region, segment, risk, and analyst fields | Editable but formula changes need care | Depends on admin permissions |
| Share with link | Yes, through Google Drive | Yes, through Microsoft cloud sharing | Usually account or seat based |
| Year-1 cost at 5 users | One-time template cost, plus any Google Workspace plan already used | Template plus licensing if needed | Can become hundreds or thousands of dollars |
| Transaction lookup | Included | Must be built or customized | Usually tied to vendor data model |
Who Should Use This Template
This dashboard is a good fit for fintech founders, payment operations leads, finance analysts, banking analysts, product managers, risk teams, and consultants who need a fast transaction reporting layer in Google Sheets.
It is also useful for teams that export transaction data from payment processors, wallets, banking systems, internal tools, or SQL reports and want to turn that export into a reusable dashboard.
It is not the right tool for real-time fraud scoring, SOC 2-controlled reporting workflows, bank-grade permissions, automated payment gateway ingestion, or streaming transaction monitoring.
Real-World Use Cases
A fintech founder preparing an investor update reviews Gross TXN Value, Total Transactions, Fee Revenue, Success Rate, and monthly value movement before the weekly metrics meeting.
A payment operations manager uses Platform Split and Risk Center to see channel volume, analyst workload, risk level distribution, and processing time changes.
A finance analyst at a wallet company uses Revenue Engine to explain why transaction value and fee revenue may move differently across regions and user segments.
Advantages of Fintech Dashboard in Google Sheets
- Fast setup: Copy the Google Sheet, replace sample data, and start reviewing charts without a BI implementation.
- Clear transaction funnel: See value, count, fees, success, product, platform, region, risk, and lookup detail in one workbook.
- Low one-time cost: The $9.99 price is easier for small teams than a recurring dashboard subscription.
- Easy collaboration: Google Sheets makes it simple to share a view-only or edit link with the right team members.
- Flexible fields: Product, region, platform, segment, status, risk, and analyst labels can match your business.
Opportunities for Improvement
- Data entry is manual unless your team builds an import or Apps Script workflow.
- The template does not replace a controlled finance warehouse or payment processor dashboard.
- Very large transaction datasets may require summarized exports instead of raw transaction history.
- The dashboard does not make automated risk decisions; it supports review and reporting.
Best Practices
- Keep the Data sheet column order unchanged so formulas, charts, slicers, and lookup fields remain reliable.
- Use consistent labels for products, regions, platforms, statuses, risk levels, and analysts.
- Refresh the dashboard on a fixed weekly or monthly schedule so trend charts stay meaningful.
- Use the Search Sheet before team reviews when a specific transaction needs quick explanation.
- Use slicers thoughtfully. Google explains that slicers can filter tables, charts, and pivot tables in custom dashboards in the official Google Sheets slicers help.
Explore Relevant Templates
- Fintech Dashboard in Google Sheets – the product page for this template.
- Blockchain and Cryptocurrency Dashboard in Google Sheets – useful for crypto transaction and market analysis.
- SaaS Onboarding Dashboard in Google Sheets – useful for signup, activation, and retention reporting.
- Tax Deduction and Receipt Tracker in Google Sheets – useful for finance recordkeeping.
- Browse Google Sheets Dashboard Templates on NextGenTemplates.
Frequently Asked Questions
What does the Fintech Dashboard in Google Sheets track?
It tracks gross transaction value, total transactions, fee revenue, success rate, monthly volume, transaction status, product value, region value, platform usage, user segments, fee revenue, risk levels, processing time, experience score, and transaction lookup details.
Can I use it for wallet, lending, card, or payment data?
Yes. The product, platform, region, segment, status, risk, and analyst labels are editable, so the template can support many fintech transaction models.
Does this template connect directly to payment gateways?
No. It is built for pasted or imported transaction data. Direct payment gateway connections would require a separate integration.
What is the Search Sheet tab for?
The Search Sheet tab lets you select a Txn ID and see the full record for that transaction, including value, fee revenue, risk, analyst, processing time, and experience score.
Can multiple people view the dashboard?
Yes. Because it runs in Google Sheets, you can share the file with view, comment, or edit permissions through Google Drive.
Is this a one-time purchase?
Yes. The template is sold as a one-time purchase on NextGenTemplates. There are no recurring subscription fees from NextGenTemplates for the file.
About the Author
Built by PK – Microsoft Certified Professional with 15+ years of Excel, Google Sheets, and Power BI experience. Founder of NextGenTemplates, reaching 300K+ subscribers across YouTube channels. Every template is hand-built and tested before release.
Conclusion
The Fintech Dashboard in Google Sheets gives fintech, payments, finance, and risk teams a practical way to review transaction performance without building a dashboard from scratch. With 7 sheet tabs, 4 top KPI cards, 20 chart views, slicers, search, and a clean Data sheet, it turns exported transaction records into a repeatable review file.
Click here to Purchase the Fintech Dashboard in Google Sheets
For more Google Sheets tutorials and dashboard walkthroughs, visit Youtube.com/@NeoTechNavigators.
Last updated: August 7, 2026.