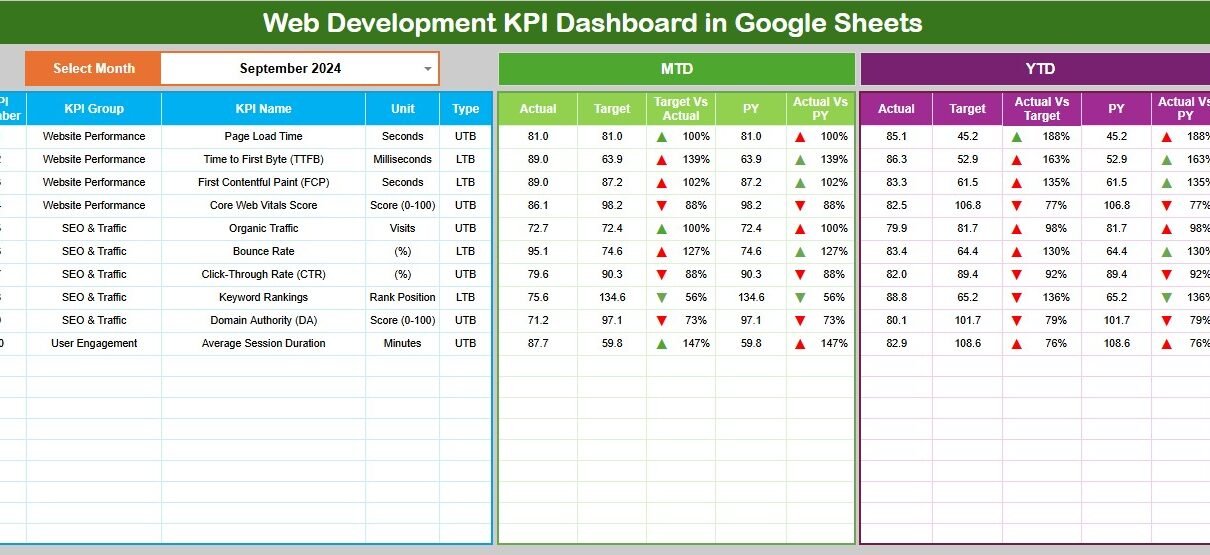
The Web Development KPI Dashboard in Google Sheets turns monthly website performance and SEO data into a clear KPI review system with 10 headline cards, 6 sheet tabs, 8 overview comparison charts and dedicated input tabs for current year, target and previous-year data. Instead of checking page speed, rankings, traffic and engagement in separate files, your team can review Page Load Time, TTFB, FCP, Core Web Vitals Score, Organic Traffic, Bounce Rate, CTR, Keyword Rankings, Domain Authority and Average Session Duration from one editable Google Sheets template.Web Development KPI Dashboard in Google Sheets
This dashboard is useful when you already collect web data from analytics, Search Console, page-speed tools or SEO platforms and need a monthly reporting layer. It is not a live crawler or ranking tracker. It is a practical spreadsheet for target setting, MTD review, YTD tracking and year-over-year comparison. For background on why page experience metrics matter, see Google Search Central’s documentation on page experience in Google Search.
Get the Web Development KPI Dashboard in Google Sheets
Key Features of Web Development KPI Dashboard in Google Sheets
- 10 website KPI cards: page speed, server response, Core Web Vitals, traffic, engagement, rankings and domain authority in one top strip.Web Development KPI Dashboard in Google Sheets
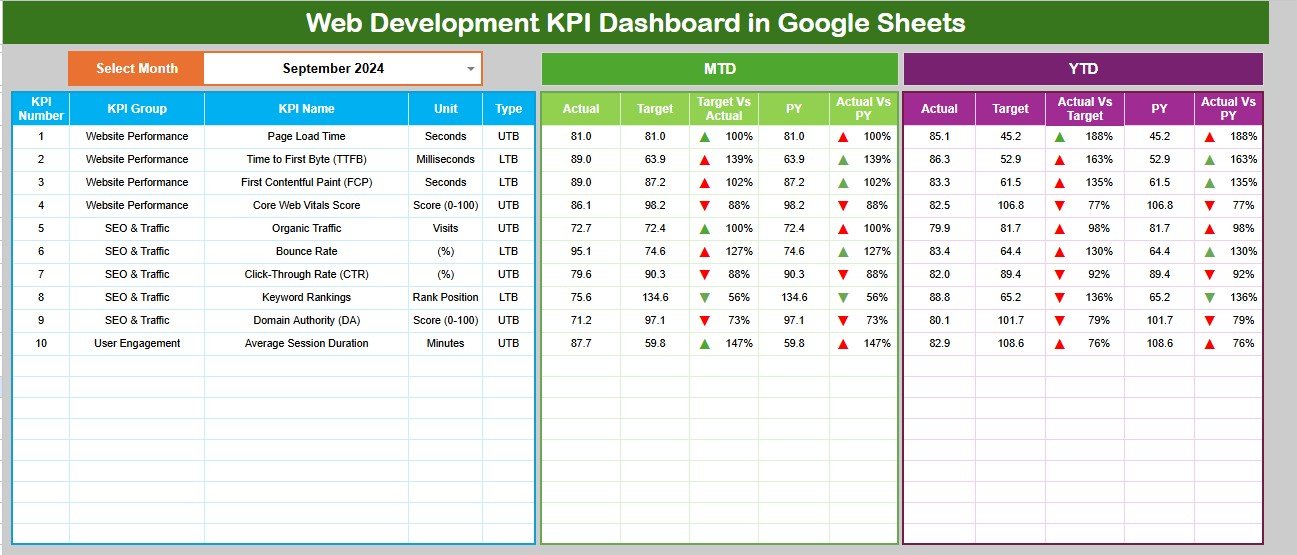
- MTD and YTD comparison: actual, target and previous-year views support monthly reviews and leadership updates.
- Multiple slicers: filter dashboard analysis quickly without rebuilding formulas.
- KPI Trend tab: select one KPI and review actual, target and previous-year movement by month.
- Current Year, Target and Previous Year tabs: keep source values separated so updates stay clean.
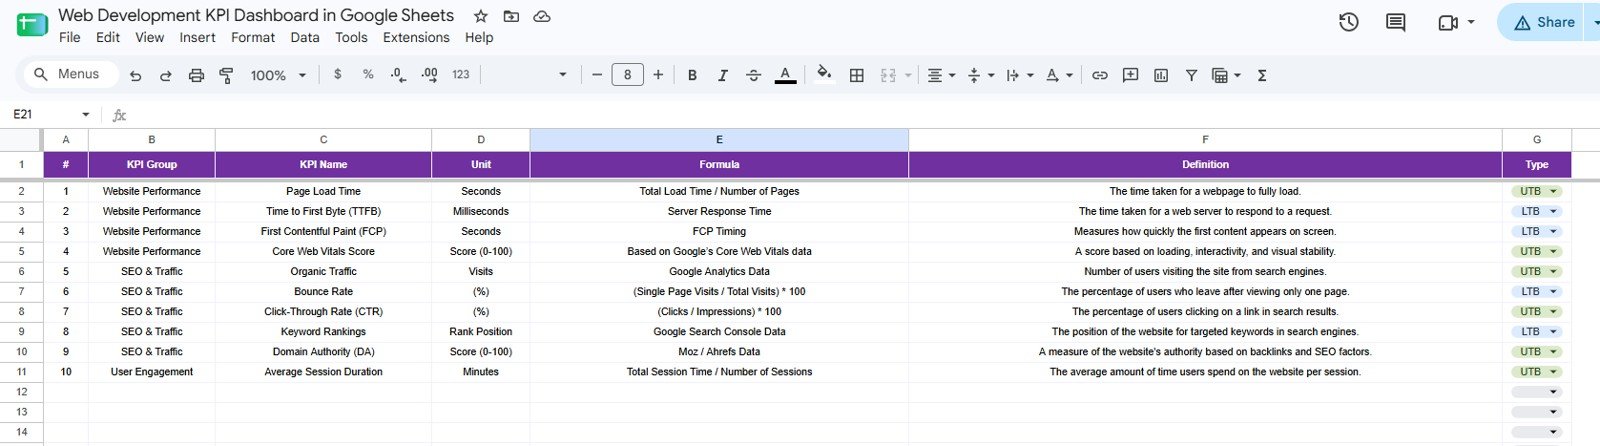
- KPI Setup tab: maintain KPI group, KPI name, unit, formula, definition and KPI type in the same structure.
- Google Sheets format: copy to Drive, share with your team and collaborate through normal Sheets permissions.Web Development KPI Dashboard in Google Sheets
Dashboard Pages Explanation
1 – Overview Page
The Overview Page is the main reporting view. The top cards summarize Page Load Time, Time to First Byte, First Contentful Paint, Core Web Vitals Score, Organic Traffic, Bounce Rate, Click-Through Rate, Keyword Rankings, Domain Authority and Average Session Duration.
MTD Actual by KPI Name: This chart shows the current-month actual value for each website KPI. It helps you see which metrics are strongest before checking targets.Web Development KPI Dashboard in Google Sheets
MTD Target by KPI Name: This chart lists the current-month target for every KPI. It gives the team a visible benchmark for page speed, traffic, rankings and engagement goals.Web Development KPI Dashboard in Google Sheets
MTD Target Vs Actual by KPI Name: This comparison shows whether each KPI is ahead of or behind its monthly goal. It is useful for sprint reviews, SEO standups and client status meetings.
MTD Actual Vs PY by KPI Name: This chart compares current-month actuals with the same KPI’s previous-year value. It helps separate real improvement from normal seasonality.
YTD Actual by KPI Name: This chart accumulates current-year performance by KPI. It helps leadership see whether the year is moving in the right direction beyond one month.
YTD Target by KPI Name: This chart summarizes year-to-date target values. It gives context before judging whether a KPI is truly on track.
YTD Actual Vs Target by KPI Name: This comparison highlights which KPIs are beating or missing their year-to-date goals. It is the strongest view for quarterly performance conversations.
YTD Actual Vs PY by KPI Name: This chart compares year-to-date actuals against last year’s year-to-date baseline. It is useful for website owners who need to prove YoY progress.Web Development KPI Dashboard in Google Sheets
2 – KPI Trend
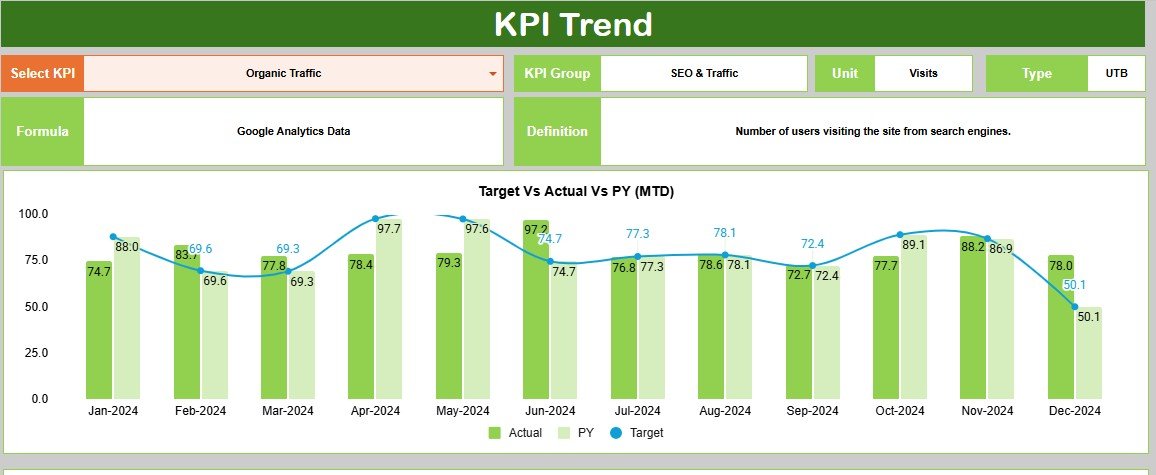
The KPI Trend tab lets you select one KPI and inspect it month by month. It is the tab to open when one metric needs more explanation than the overview can provide.
Target Vs Actual Vs PY by Month: This chart places three lines or series together for the selected KPI. You can see whether current performance is closing the gap to target and improving against last year.
Actual by Month: This view isolates the current-year actual trend. It is useful for spotting sudden speed, traffic or engagement movement.
PY by Month: This view shows the previous-year pattern for the selected KPI. It helps explain whether dips and peaks are seasonal.
Target by Month: This view shows the planned monthly target path. Teams can check whether targets are realistic or need adjustment.
Formula by Selected KPI: The formula area explains how the selected KPI should be calculated. This keeps metric definitions consistent across reporting cycles.
Definition by Selected KPI: The definition area explains what the KPI means and why it is tracked. This is helpful when reports are shared with non-technical stakeholders.
3 – Current Year Data
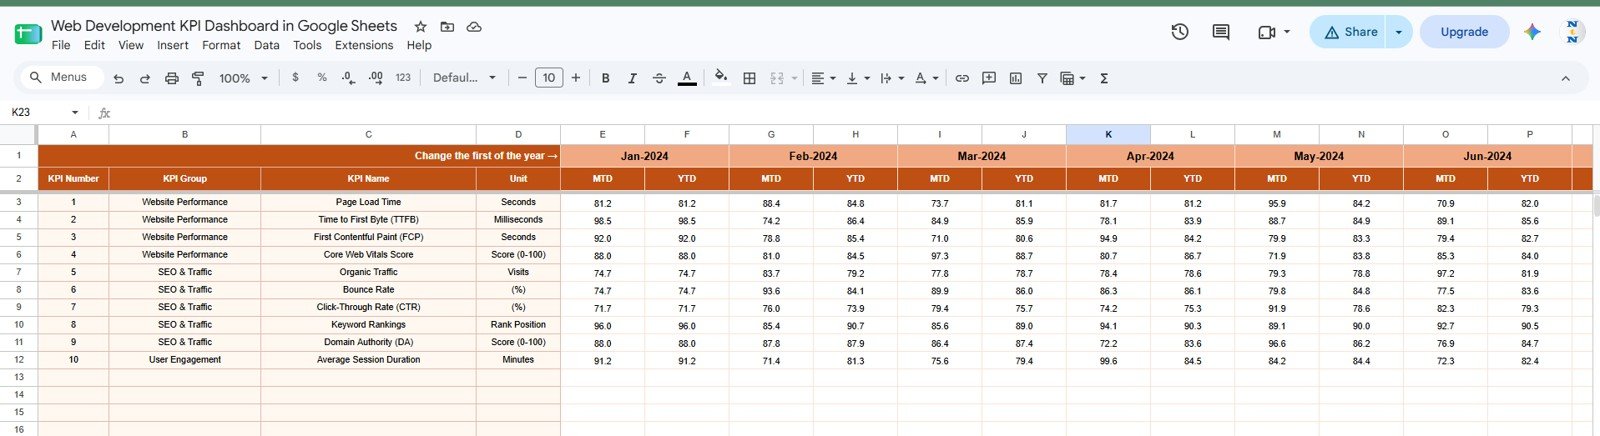
The Current Year Data tab stores actual web KPI values for the active reporting year. It includes MTD Actual by KPI Name and Month, YTD Actual by KPI Name and Month, Actual Performance by KPI Group and Unit by KPI Name.
Use this sheet after exporting or collecting current performance values. Keeping actuals separate from targets and previous-year values makes monthly maintenance easier.
4 – Target Data
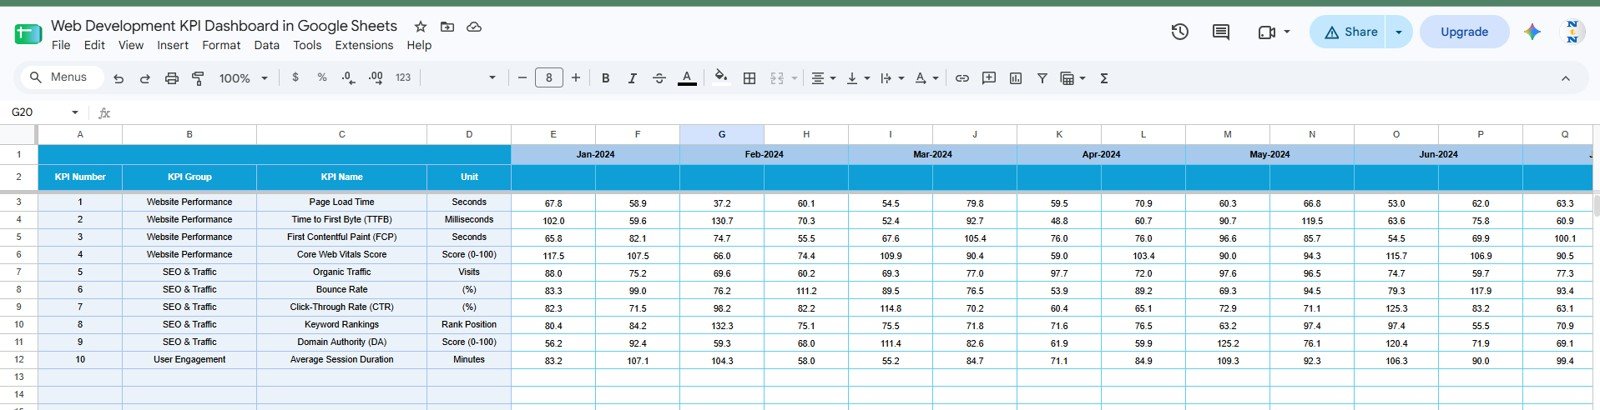
The Target Data tab holds goal values for every KPI and month. It includes Target Value by KPI Name and Month, Monthly Target by KPI Group, Target Baseline by KPI Name and Unit by KPI Name.
This tab is where web managers, SEO leads or agency owners record the expected performance path. When targets are maintained cleanly, the overview comparisons become much more useful.
5 – Previous Year Data
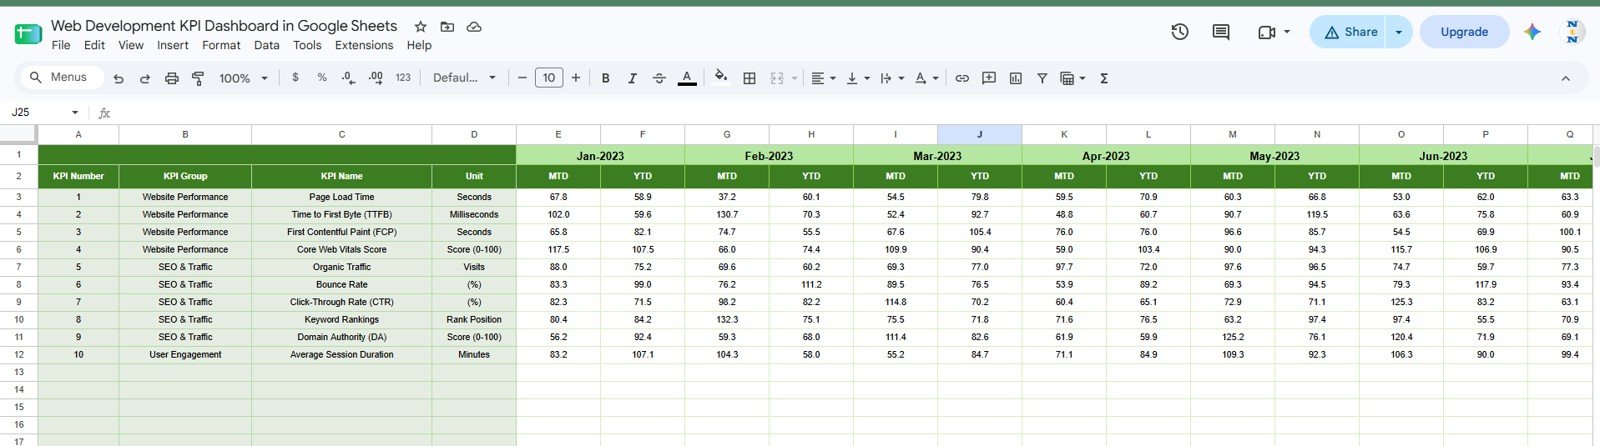
The Previous Year Data tab provides the baseline for year-over-year analysis. It includes Previous Year MTD by KPI Name and Month, Previous Year YTD by KPI Name and Month, Previous Year Performance by KPI Group and Unit by KPI Name.
Use this tab to load last year’s website performance numbers. It helps explain whether the site is truly improving or simply repeating seasonal traffic patterns.
6 – KPI Setup Sheet Tab
The KPI Setup Sheet tab stores KPI group, KPI name, unit, formula, definition and KPI type in a consistent format. It is the dictionary behind the dashboard.
Teams should review this tab first, because clear KPI definitions prevent confusing reports later. If your team tracks additional website or SEO metrics, this is the logical place to extend the template.
Web Development KPI Dashboard in Google Sheets vs. Excel vs. Paid CRM/SaaS – Feature Comparison
| Feature | This Google Sheets template | Microsoft Excel dashboard | Paid web analytics SaaS |
|---|---|---|---|
| Cost | $8.99 one-time sale price | Template cost plus Microsoft access | Monthly or annual subscription |
| Platform | Google Sheets in browser | Excel desktop or web | Vendor-hosted app |
| Setup time | Copy file, update KPI setup and enter monthly values | Download, open and maintain locally | Account setup, tags, integrations and dashboards |
| Real-time team collaboration | Native Google Drive sharing | Requires OneDrive or SharePoint | Usually included by paid seat |
| Mobile access | Google Sheets app or browser | Excel mobile or browser | Usually app or browser |
| Customizable fields | Editable KPI Setup tab | Editable workbook | Limited by vendor model |
| Share with link | Yes | Yes, with cloud storage | Usually login controlled |
| Year-1 cost at 5 users | $8.99 before any Google Workspace cost | Template plus license cost | Often hundreds or thousands |
| Best use case | Monthly website KPI review | Offline spreadsheet reporting | Automated real-time analytics |
Who Should Use This Template
This template is a fit for website owners, web developers, SEO managers, technical SEO consultants, content teams, agency account managers and digital marketing leads who need recurring KPI reporting in a shared spreadsheet.Web Development KPI Dashboard in Google Sheets
It is not a full analytics platform. If you need automated data pulls, uptime alerts, crawl diagnostics, rank tracking or session replay, keep using specialist tools and use this dashboard for structured monthly review.
Real-World Use Cases
Maya, technical SEO consultant: loads page speed, FCP, TTFB and Core Web Vitals Score before every client call and uses the KPI Trend tab to explain changes.
Arjun, web agency owner: reviews CTR, organic traffic and rankings after each sprint to see whether technical improvements are turning into search performance.Web Development KPI Dashboard in Google Sheets
Priya, content manager: watches bounce rate and average session duration to decide whether recent content updates are attracting the right visitors.Web Development KPI Dashboard in Google Sheets
Advantages of Web Development KPI Dashboard in Google Sheets
- Low cost: a one-time template is enough for many small teams that do not need another subscription.
- Clear metric ownership: actuals, targets and previous-year values sit in separate tabs.
- Shared review workflow: Google Sheets sharing makes it easy for web, content and SEO teams to work together.
- Editable KPI dictionary: formulas and definitions can be changed to match your reporting rules.
- Browser-based access: no desktop software is required for routine updates.
Opportunities for Improvement
The main limitation is that the dashboard does not collect data automatically. Teams that want live website monitoring, automated Search Console imports or PageSpeed API refreshes will need to connect those workflows separately.Web Development KPI Dashboard in Google Sheets
Some organizations may also want more granular page-level analysis, device split, country split, channel segmentation or landing-page tables. Those are logical extensions if your reporting matures beyond KPI-level tracking.
Best Practices
- Update the KPI Setup Sheet before entering performance data.
- Keep the same units for every month so YTD charts remain meaningful.
- Record targets before the month starts, not after performance is known.
- Use consistent data sources for rankings, authority and traffic.
- Review Core Web Vitals and speed KPIs alongside engagement, not separately.
- Use native Google Sheets sharing permissions carefully, especially for client reporting. Google documents how file sharing permissions work.
Explore Relevant Templates
- Web Development KPI Dashboard in Google Sheets – the product page for this dashboard.
- Web Development KPI Dashboard in Excel – the Excel version for desktop teams.
- Web Development Agencies KPI Dashboard in Power BI – agency reporting in Power BI.
- Software Development KPI Dashboard in Google Sheets – sprint and delivery KPI tracking.
- Digital Marketing Campaign Dashboard in Google Sheets – campaign-level marketingWeb Development KPI Dashboard in Google Sheets analysis.
Want to build KPI dashboards like this yourself? The Excel Pivot Tables & Dashboards course on NextGenTemplates Academy walks through the techniques with practice files.
Frequently Asked Questions
What KPIs are included in this dashboard?
It includes Page Load Time, Time to First Byte, First Contentful Paint, Core Web Vitals Score, Organic Traffic, Bounce Rate, Click-Through Rate, Keyword Rankings, Domain Authority and Average Session Duration.
Does this dashboard connect automatically to Google Analytics?
No. It is a Google Sheets template for structured KPI entry and analysis. You can paste exports or build your own connector workflow if needed.
Can I customize KPI formulas and definitions?
Yes. Use the KPI Setup Sheet tab to maintain KPI group, KPI name, unit, formula, definition and KPI type.
Can multiple people use the dashboard?
Yes. After copying it to Google Drive, share it with view or edit access through normal Google Sheets permissions.Web Development KPI Dashboard in Google Sheets
Is this only for developers?
No. Developers, SEO consultants, marketers, content leads and website owners can all use it because the KPIs cover both technical performance and audience outcomes.Web Development KPI Dashboard in Google Sheets
Does it replace SEO software?
No. SEO tools collect and refresh data. This template organizes the monthly results so targets, actuals and previous-year comparisons are easier to review.
About the Author
Built by PK – Microsoft Certified Professional with 15+ years of Excel, Google Sheets, and Power BI experience. Founder of NextGenTemplates, reaching 300K+ subscribers across YouTube channels. Every template is hand-built and tested before release.
Conclusion
The Web Development KPI Dashboard in Google Sheets gives teams a practical way to review website speed, Core Web Vitals, traffic, bounce rate, CTR, rankings, domain authority and session duration against monthly targets and previous-year baselines. It is best for teams that already collect web data and want a cleaner shared reporting process.Web Development KPI Dashboard in Google Sheets
Get the Web Development KPI Dashboard in Google Sheets
Last updated: 15 August 2026.