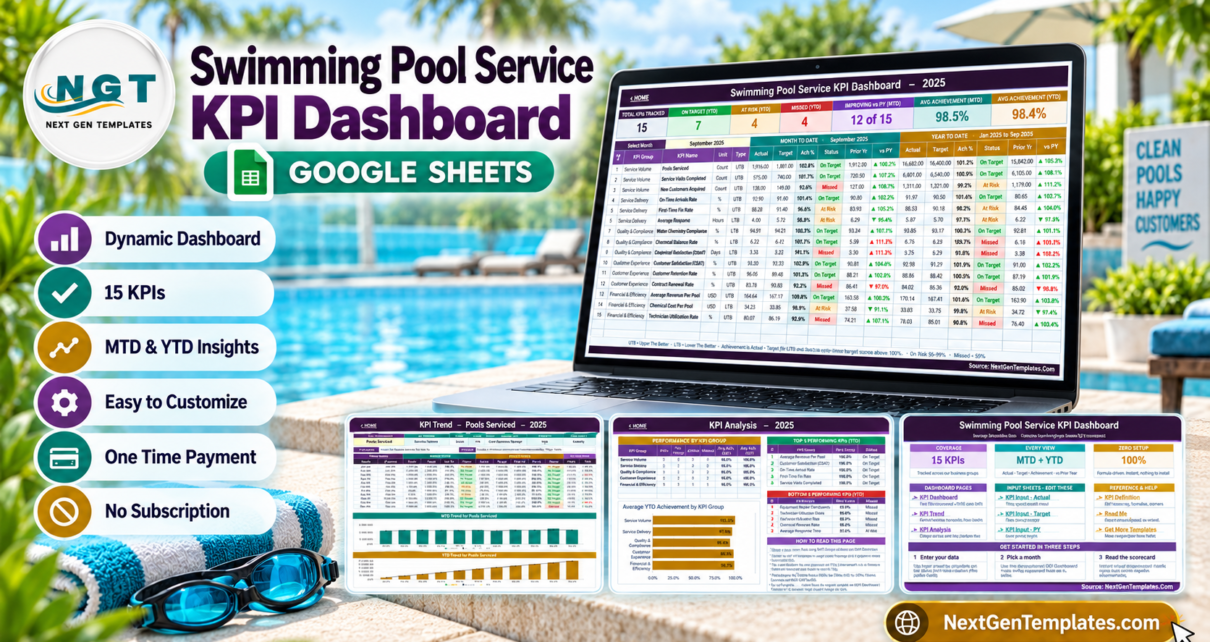
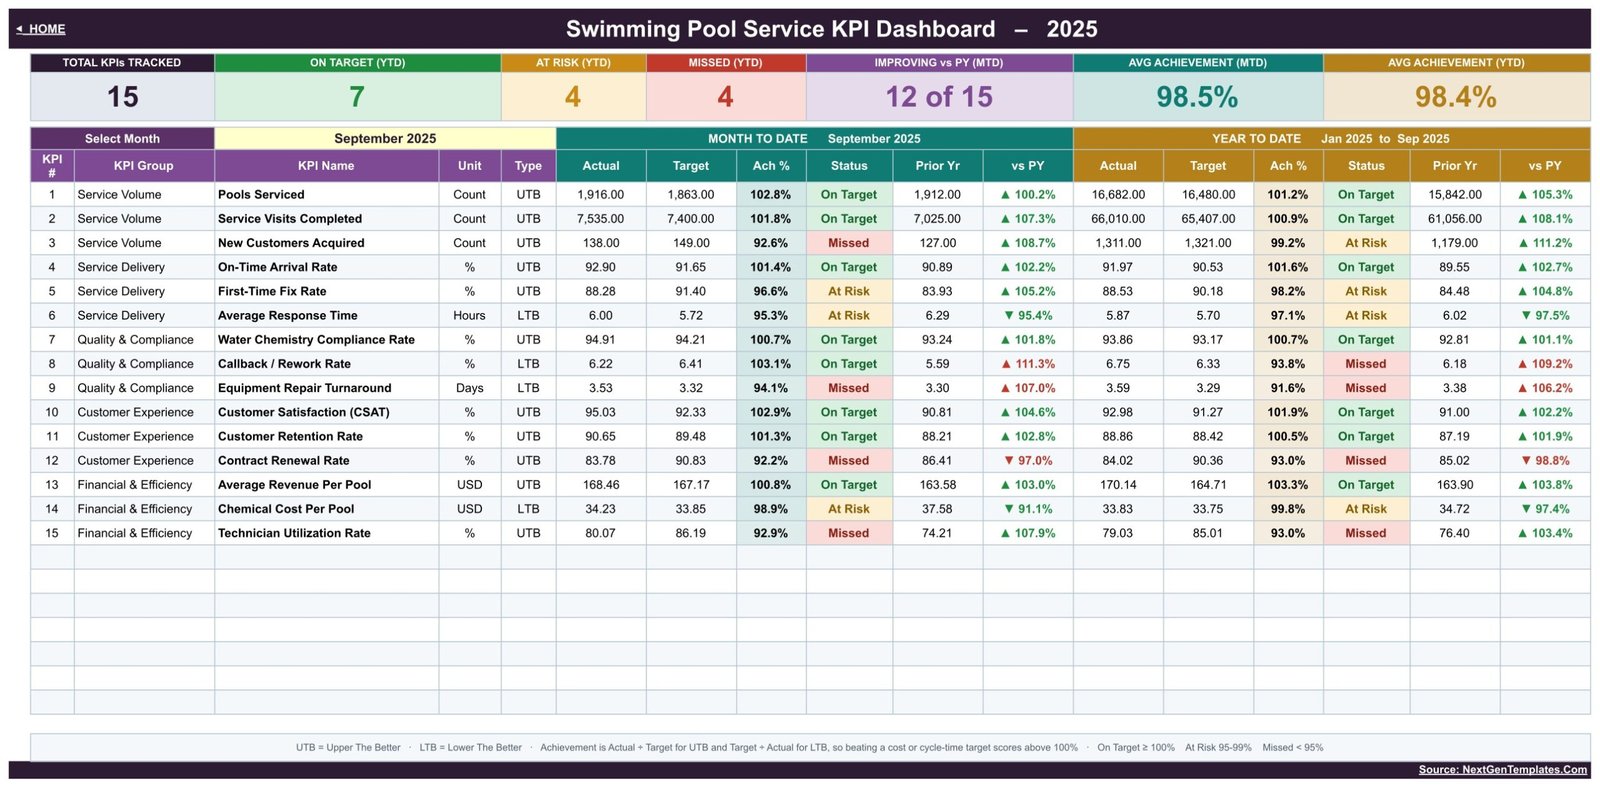
A pool service company can look busy while its margin, response time, or repeat-work rate quietly moves the wrong way. The Swimming Pool Service KPI Dashboard in Google Sheets turns 15 monthly KPIs into a single review system: 5 groups, 12 months, MTD and YTD views, target and prior-year comparisons, a trend page, and a top/bottom-five analysis. The sample September view contains 7 On Target, 4 At Risk, and 4 Missed YTD KPIs, with 98.4% average YTD achievement. Those figures are sample data, not a benchmark for the pool industry.Swimming Pool Service KPI Dashboard
This is the KPI Dashboard family: a 15-row scorecard plus dedicated Trend and Analysis pages. It is different from the published Swimming Pool Service KPI Scorecard in Google Sheets, which is a separate 10-KPI product with a different structure.Swimming Pool Service KPI Dashboard
Key Features of Swimming Pool Service KPI Dashboard in Google Sheets
15 KPIs across five management groups
The supplied register covers Service Volume, Service Delivery, Quality & Compliance, Customer Experience, and Financial & Efficiency. Metrics include Pools Serviced, Service Visits Completed, New Customers Acquired, On-Time Arrival Rate, First-Time Fix Rate, Average Response Time, Water Chemistry Compliance Rate, Callback / Rework Rate, Equipment Repair Turnaround, Customer Satisfaction, Customer Retention, Contract Renewal, Average Revenue Per Pool, Chemical Cost Per Pool, and Technician Utilization.Swimming Pool Service KPI Dashboard
Direction-aware achievement and traffic lights
Most KPIs are UTB, or upper the better. Average Response Time, Callback / Rework Rate, Equipment Repair Turnaround, and Chemical Cost Per Pool are LTB, or lower the better. The achievement formula reverses correctly for LTB metrics, so beating a cost or cycle-time target can score above 100% rather than being marked as a failure.Swimming Pool Service KPI Dashboard
One month picker, two reporting horizons
Select a month and the dashboard shows both Month to Date and Year to Date actuals, targets, achievement, status, prior year, and change. The workbook uses monthly summary values rather than job-level transactions.Swimming Pool Service KPI Dashboard
Dashboard Pages Explanation
1. Home
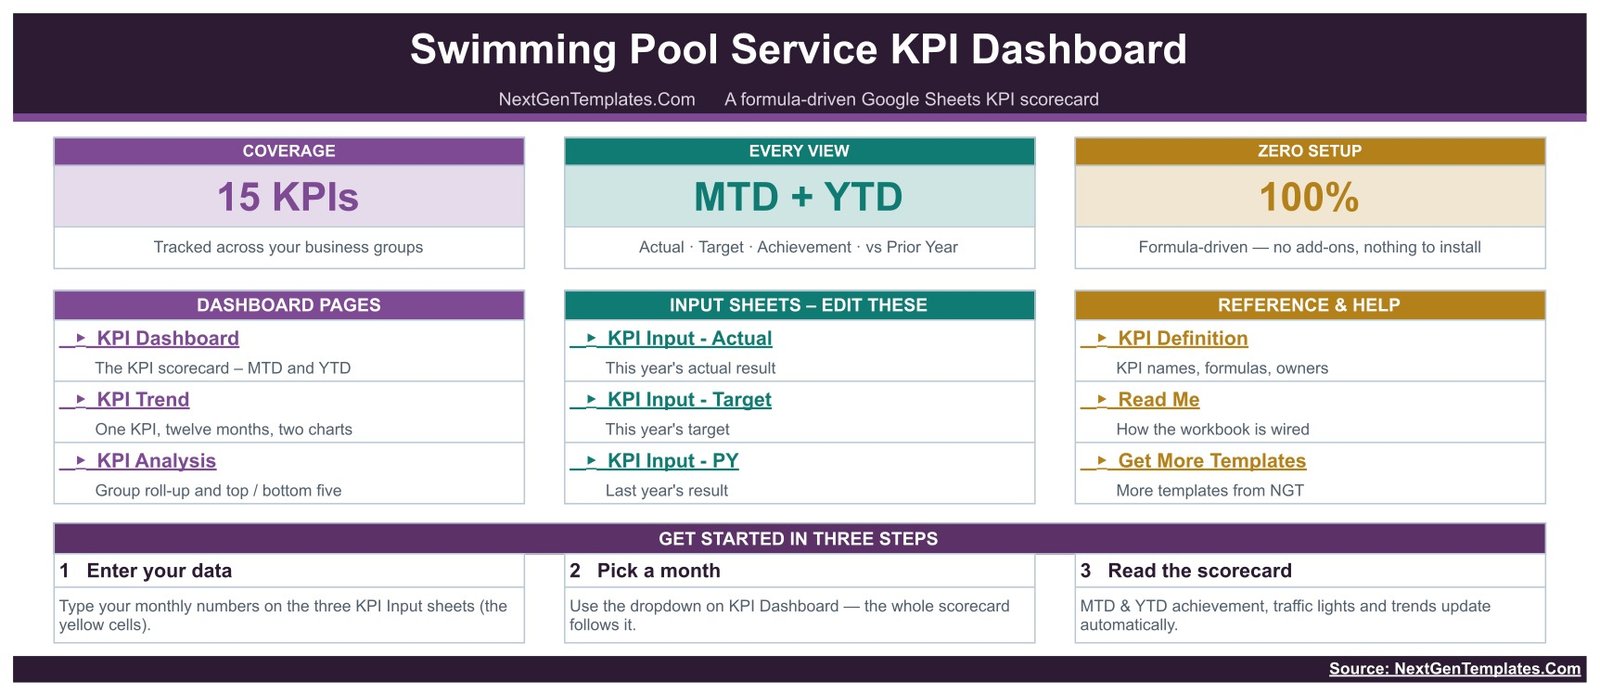
The index states the structure before you begin: 15 KPIs, MTD plus YTD, three editable input sheets, and formula-driven operation with no add-ons. Navigation links open KPI Dashboard, KPI Trend, KPI Analysis, Actual, Target, PY, KPI Definition, Read Me, and Get More Templates.
2. KPI Dashboard
The main page places all 15 KPIs in one table. For each row you can see unit and direction, MTD Actual and Target, achievement percentage, status, prior-year value and comparison, followed by the same YTD fields. Seven summary cards at the top count the tracked KPIs and statuses and show average achievement.
3. KPI Trend
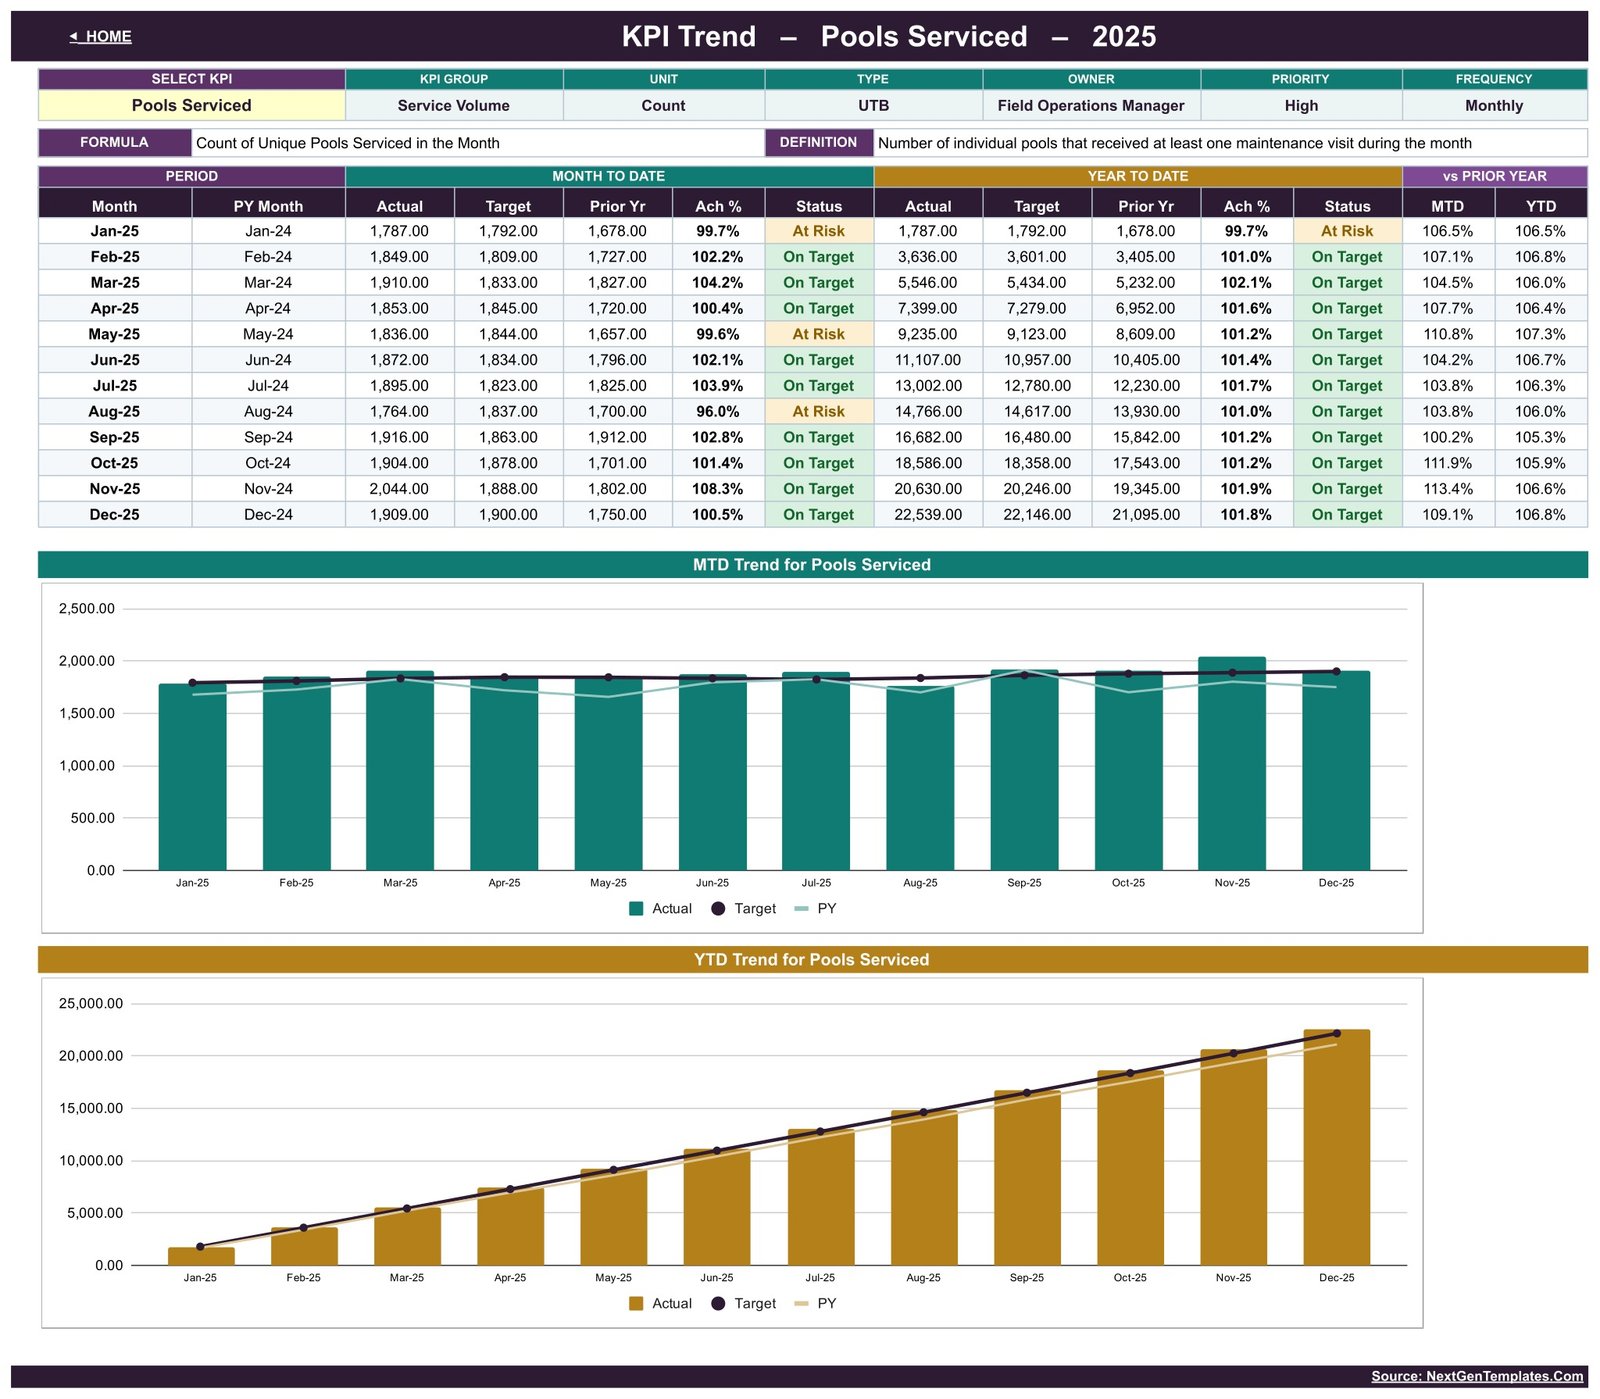
Select one metric to see its group, unit, type, owner, priority, frequency, formula, and definition. A twelve-row table covers MTD and YTD Actual, Target, Prior Year, achievement, and status, followed by two charts: MTD Actual, Target and PY by Month and YTD Actual, Target and PY by Month.
4. KPI Analysis
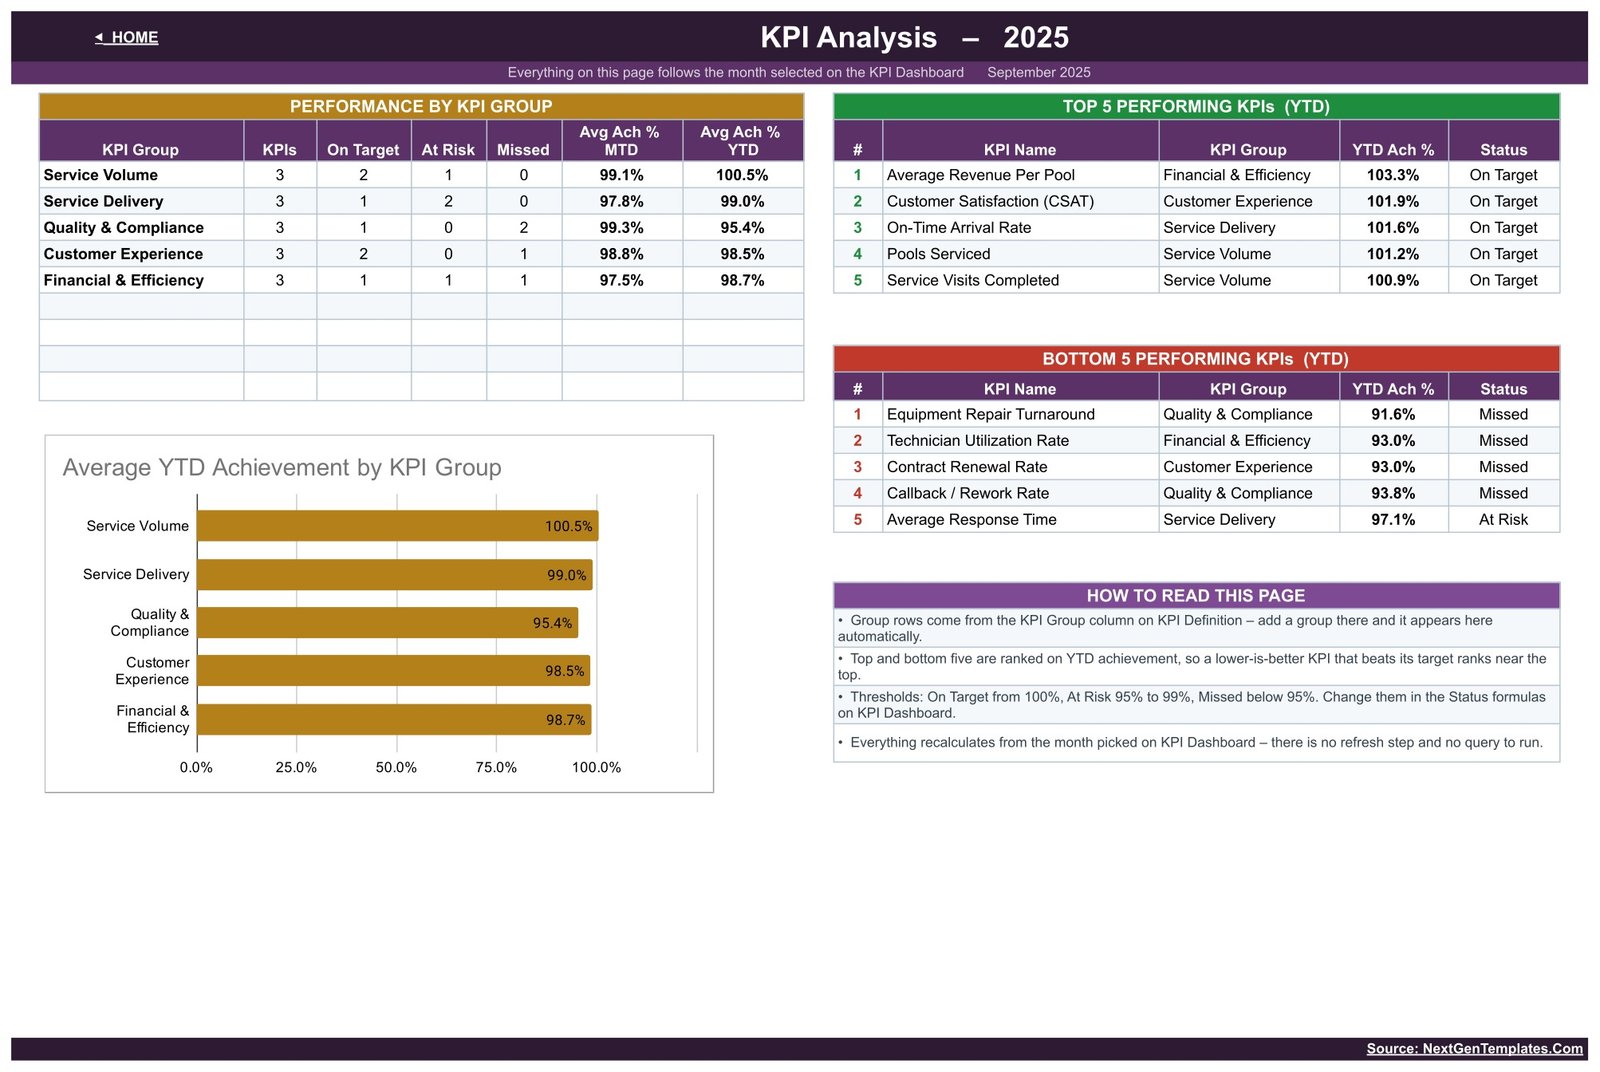
The analysis page rolls up all five groups, counts On Target, At Risk, and Missed KPIs, charts average YTD achievement by group, and lists the top and bottom five YTD performers. Everything follows the month selected on KPI Dashboard.
5. Actual, Target, and PY input sheets
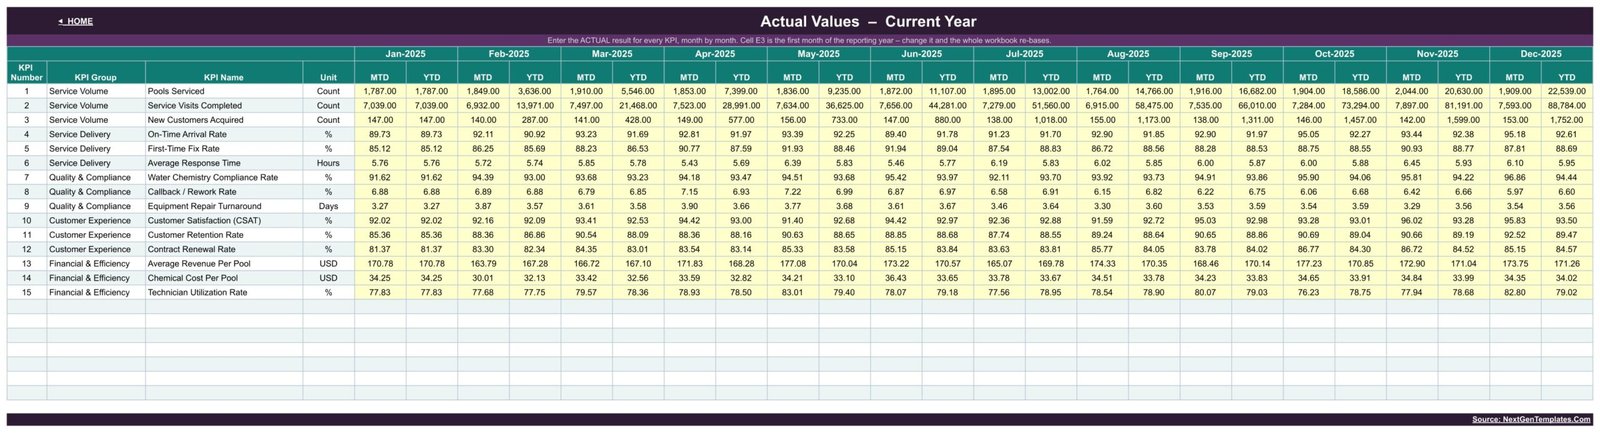
These three tables are the data-entry layer. Each holds the 15 KPIs from January to December with MTD and YTD columns. Type or paste your monthly summaries into the yellow cells and the reporting pages update through formulas.
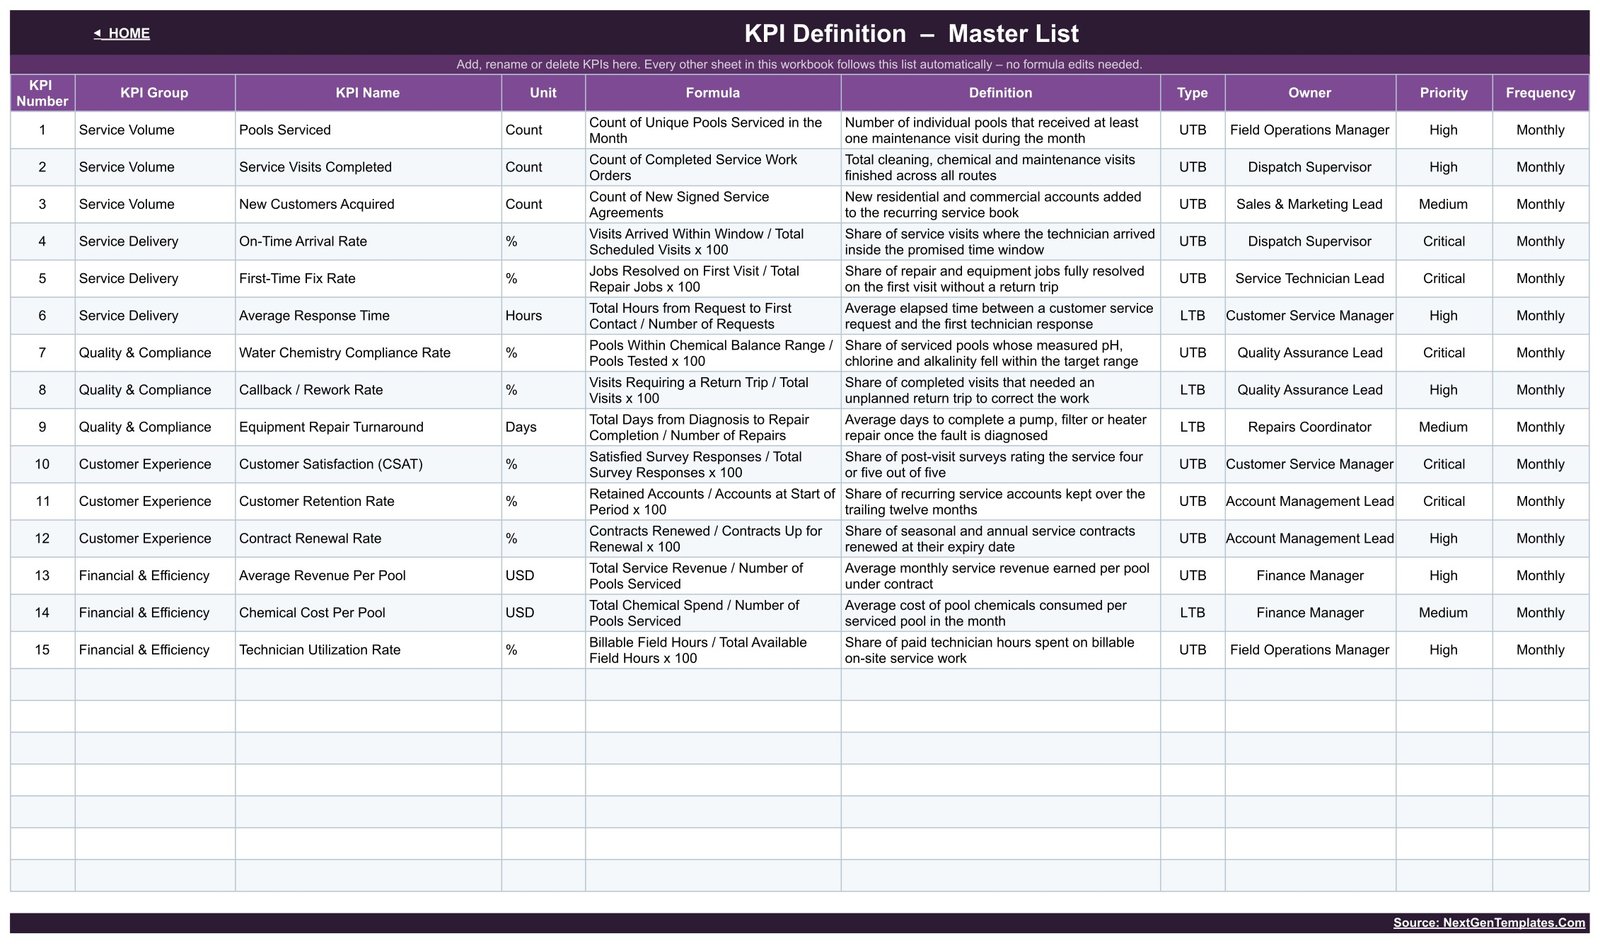
6. KPI Definition
The master register gives each metric a group, unit, written formula, plain-language definition, UTB/LTB direction, owner, priority, and monthly frequency. This page matters because it prevents two managers from using different definitions for the same number.
Swimming Pool Service KPI Dashboard in Google Sheets vs. Excel vs. Paid Field Service SaaS – Feature Comparison
| Area | This template | Excel alternative | Paid field service SaaS |
|---|---|---|---|
| Price | $8.99 one time | Template plus Microsoft 365 if needed | Recurring, often per user |
| Platform | Google Sheets in browser or app | Excel desktop/web | Vendor web and mobile apps |
| Collaboration | Native link sharing | OneDrive co-authoring | Native but seat-based |
| Setup time | Copy, define, paste monthly summaries | Download and configure | Onboarding and data import |
| Custom fields | Names, units, formulas, owners, direction | Editable workbook | Plan-dependent |
| Year-one cost at five users | $8.99 total | File plus licences | Hundreds to thousands |
| Dispatch and invoicing | Not included | Not included | Usually included |
| Water-test records | Not included; summary KPI only | Depends on file | Vendor-dependent |
Who Should Use This Template
It suits an owner-operator, regional pool service manager, dispatcher, quality lead, or finance manager who can produce reliable monthly totals and wants a fixed review board. It is especially useful when several people need browser access without buying separate reporting seats.
It does not suit a company that needs live dispatch, route optimization, technician GPS, customer records, invoices, work orders, chemical logs, automated data imports, or regulatory documentation. In those cases, use operational software and treat this dashboard only as a management summary.
Real-World Use Cases
Nina manages four recurring routes. Service volume is rising, but she reviews On-Time Arrival Rate, First-Time Fix Rate, and Average Response Time before adding another route. Trend charts reveal whether one poor month is a blip or part of a year-long slope.
Ravi leads service quality. He reads Water Chemistry Compliance Rate beside Callback / Rework Rate and Equipment Repair Turnaround. The sheet tells him where to investigate, but he keeps all test results and safety records in the approved operational system.
Amy owns the business. She puts Average Revenue Per Pool, Chemical Cost Per Pool, and Technician Utilization Rate beside retention and renewals before changing a service-plan price.
Advantages of Swimming Pool Service KPI Dashboard in Google Sheets
- Clear structure: one register, three input tables, and three reporting pages.
- No black box: formulas and KPI definitions remain visible and editable.
- Two benchmarks: compare actuals with both plan and prior year.
- Shared ownership: Google Sheets permissions support collaborative monthly updates.
- No recurring fee: one-time payment and no per-user charge.
- Honest scope: it measures monthly results without pretending to replace field service software.
Opportunities for Improvement
- Manual input: there is no automatic connection to route, accounting, CRM, or testing systems.
- Monthly grain: it does not drill to an individual pool, job, technician, route, or day.
- Summary chemistry measure: Water Chemistry Compliance Rate is one entered percentage; no pH, chlorine, alkalinity, dosing, or inspection records are stored.
- Fixed starting structure: 15 supplied rows and five groups are ready to edit, but expanding the model beyond the designed area may require formula changes.
- No alerts: red, amber, and green are visual statuses inside the workbook, not emails or push notifications.
Best Practices
- Agree on every KPI definition before the first monthly review.
- Set the correct UTB or LTB direction whenever you replace a metric.
- Archive the source report behind each monthly summary so a number can be audited later.
- Keep the Actual, Target, and PY KPI names aligned.
- Use view-only sharing for readers and reserve edit access for data owners.
- Review the status table first, the trend second, and the underlying source data third.
- For Google Sheets lookup fundamentals, see Google’s official VLOOKUP guidance.
Explore Relevant Templates
- Swimming Pool Service KPI Scorecard walkthrough – compare the separate 10-KPI scorecard family.
- Garage Door Service KPI Scorecard walkthrough – another field-service measurement example.
- Septic Tank Service KPI Scorecard in Google Sheets – a related route-service template.
- Pest Control Business KPI Scorecard in Google Sheets – another operations companion.
- Browse Google Sheets KPI Dashboards.
Frequently Asked Questions
Is this a KPI Dashboard or KPI Scorecard?
A KPI Dashboard. It has 15 KPI rows plus separate Trend and Analysis pages. The scorecard is a different product with 10 cards.
Do I need a paid Google Workspace account?
No. A free Google account can copy, edit, and share it.
Can I add my own KPIs?
You can replace the supplied names, definitions, units, written formulas, owners, priorities, frequencies, and directions. Keep matching names aligned across the tables.
Are the displayed results industry benchmarks?
No. All displayed numbers are sample data included to demonstrate the formulas and layouts.Swimming Pool Service KPI Dashboard
Does it prove water safety or regulatory compliance?
No. The workbook is not a testing log, dosing calculator, inspection record, certification system, or public-health tool. Follow local requirements and keep approved records separately.Swimming Pool Service KPI Dashboard
Will it import my job data automatically?
No. You enter monthly summary values manually.
How do I receive the template?
The download is a PDF containing the link used to make your own Google Sheets copy.Swimming Pool Service KPI Dashboard
About the Author
Built by PK – Microsoft Certified Professional with 15+ years of Excel, Google Sheets, and Power BI experience. Founder of NextGenTemplates, reaching 300K+ subscribers across YouTube channels. Every template is hand-built and tested before release.Swimming Pool Service KPI Dashboard
Conclusion
The most useful monthly dashboard is not the one with the most charts; it is the one a manager can define, update, read, and challenge consistently. This workbook fixes the review around 15 pool service KPIs while keeping every input and definition visible. If your current process is a collection of emailed totals and ad hoc spreadsheets, the Swimming Pool Service KPI Dashboard in Google Sheets gives those numbers a repeatable home.Swimming Pool Service KPI Dashboard
Get the Swimming Pool Service KPI Dashboard in Google Sheets for $8.99 – one-time payment, no subscription. For more walkthroughs, visit PK An Excel Expert on YouTube.