Most fire-safety servicing firms already know their numbers are somewhere. They are in the job system, in the invoicing export, in a technician’s head. What they usually do not have is one page that shows all of them together, next to a target, once a month, in a form somebody will actually look at.Fire Safety Services KPI Scorecard in Google Sheets
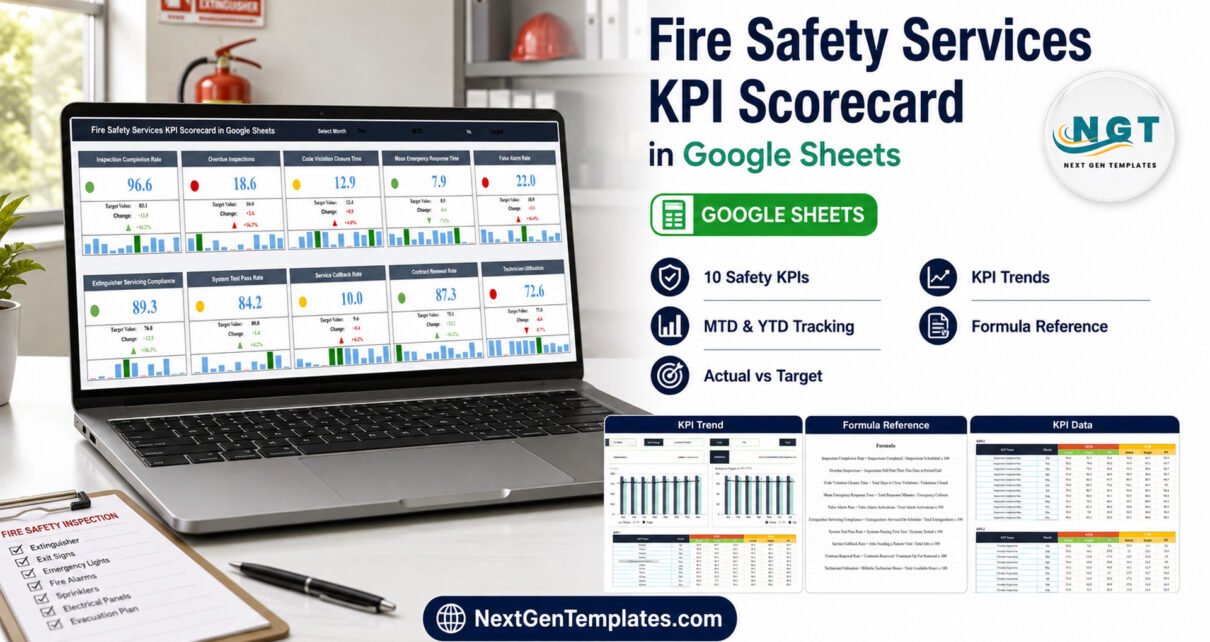
The Fire Safety Services KPI Scorecard in Google Sheets is that page. Ten KPIs across four groups, a traffic light on each, a month picker, an MTD/YTD toggle and a Target/prior-year toggle. It ships with twelve months of sample numbers already typed in, so it works the moment you open it.Fire Safety Services KPI Scorecard in Google Sheets
This walkthrough covers what is actually in the file, what it deliberately does not do, and the two build defects we found when we opened this particular workbook – both fixable in about a minute, both worth knowing before you hand the sheet to anyone.Fire Safety Services KPI Scorecard in Google Sheets
Get the Fire Safety Services KPI Scorecard in Google Sheets
The 10 KPIs, and What Each One Measures
The KPI Definition tab spells out the formula and the direction for every one of them. Five are “upper the better” (UTB) and five are “lower the better” (LTB), which matters because the traffic light reads the direction flag, not just the sign of the variance.
| # | KPI | Group | Unit | Direction |
|---|---|---|---|---|
| 1 | Inspection Completion Rate | Inspection & Compliance | % | UTB |
| 2 | Overdue Inspections | Inspection & Compliance | count | LTB |
| 3 | Code Violation Closure Time | Inspection & Compliance | days | LTB |
| 4 | Mean Emergency Response Time | Response & Emergency | min | LTB |
| 5 | False Alarm Rate | Response & Emergency | % | LTB |
| 6 | Extinguisher Servicing Compliance | Servicing & Maintenance | % | UTB |
| 7 | System Test Pass Rate | Servicing & Maintenance | % | UTB |
| 8 | Service Callback Rate | Servicing & Maintenance | % | LTB |
| 9 | Contract Renewal Rate | Commercial | % | UTB |
| 10 | Technician Utilisation | Commercial | % | UTB |
Every formula is written out in plain English on the KPI Definition tab. Extinguisher Servicing Compliance = Extinguishers Serviced On Schedule / Total Extinguishers x 100. Mean Emergency Response Time = Total Response Minutes / Emergency Callouts. Service Callback Rate = Jobs Needing a Return Visit / Total Jobs x 100. You can argue with any of them and change the text, which is the point.Fire Safety Services KPI Scorecard in Google Sheets
The Eight Tabs, Explained
Scorecard
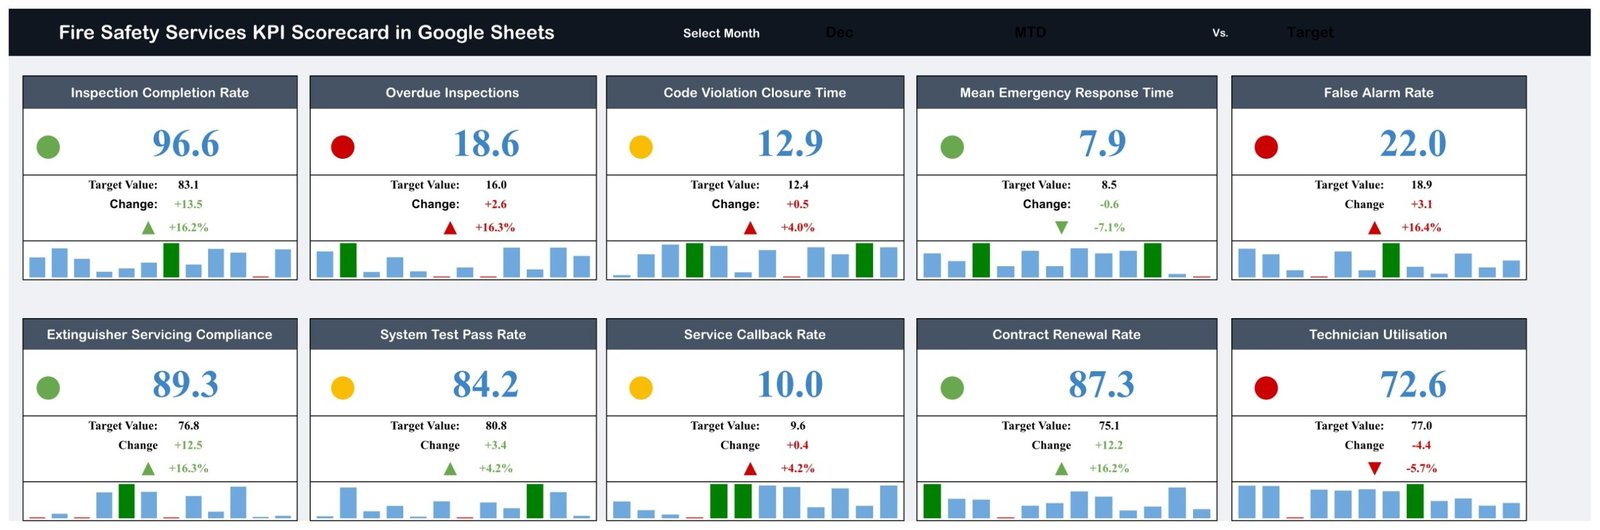
Ten cards, two rows of five. Each card shows the KPI name, a status dot, the current value, the target, the absolute change, the percentage change with an arrow, and a twelve-month bar sparkline with the selected month picked out. Across the top: Select Month, an MTD / YTD dropdown and a Vs. Target / Vs. PY dropdown.Fire Safety Services KPI Scorecard in Google Sheets
On the sample data, December MTD against Target reads four green, three amber and three red. The reds are Overdue Inspections (18.6 against a target of 16.0), False Alarm Rate (22.0% against 18.9%) and Technician Utilisation (72.6% against 77.0%). The greens are Inspection Completion Rate, Mean Emergency Response Time, Extinguisher Servicing Compliance and Contract Renewal Rate.Fire Safety Services KPI Scorecard in Google Sheets
Note how Overdue Inspections and False Alarm Rate go red because they went up, while Technician Utilisation goes red because it went down. That is the direction flag doing its job, and it is the single most common thing scorecards of this kind get wrong.
Fire Safety Services KPI Scorecard in Google Sheets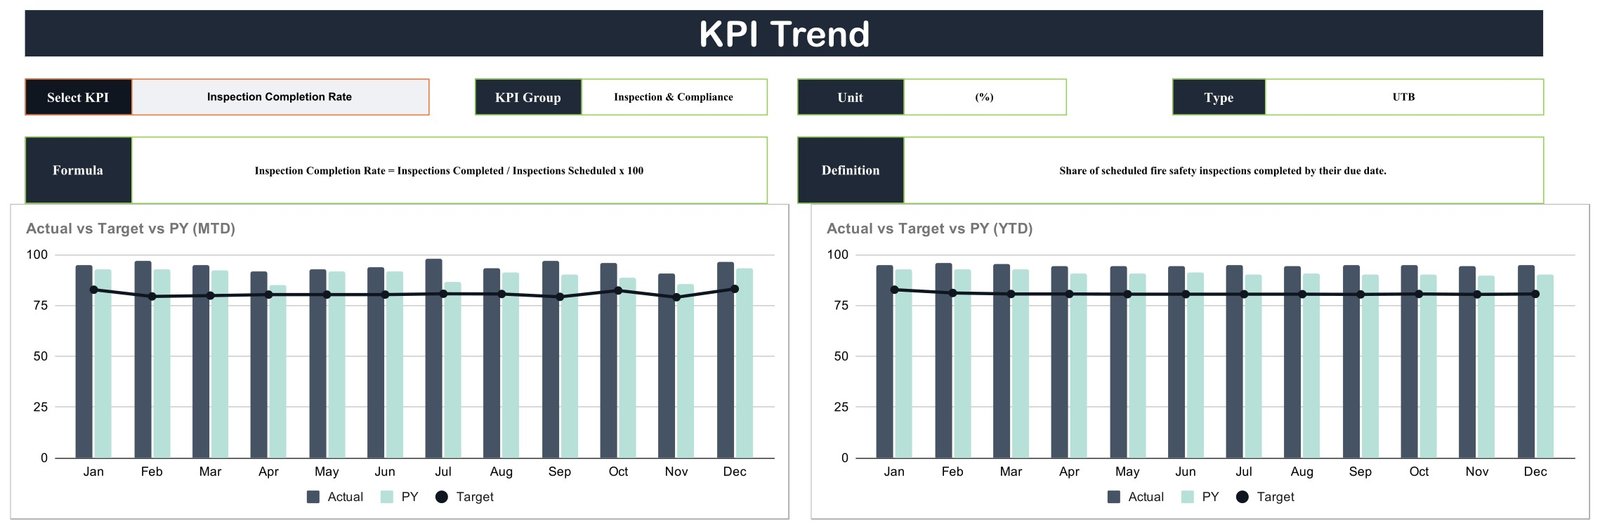
KPI Trend
One dropdown picks a KPI. The page fills in its group, unit, type (UTB or LTB), formula and definition, then draws two charts across Jan to Dec: Actual vs Target vs PY (MTD) and Actual vs Target vs PY (YTD). Actual and PY are grouped columns, Target is a line over the top. The YTD chart is the flatter of the two by design – it is a running average, so it smooths out the month-to-month noise you see on the left.
KPI Definition
Ten rows: number, group, name, unit, formula, definition, type. This is the tab you edit to rename a KPI or change how it is worked out. Everything else in the workbook reads from here.Fire Safety Services KPI Scorecard in Google Sheets

Input Data
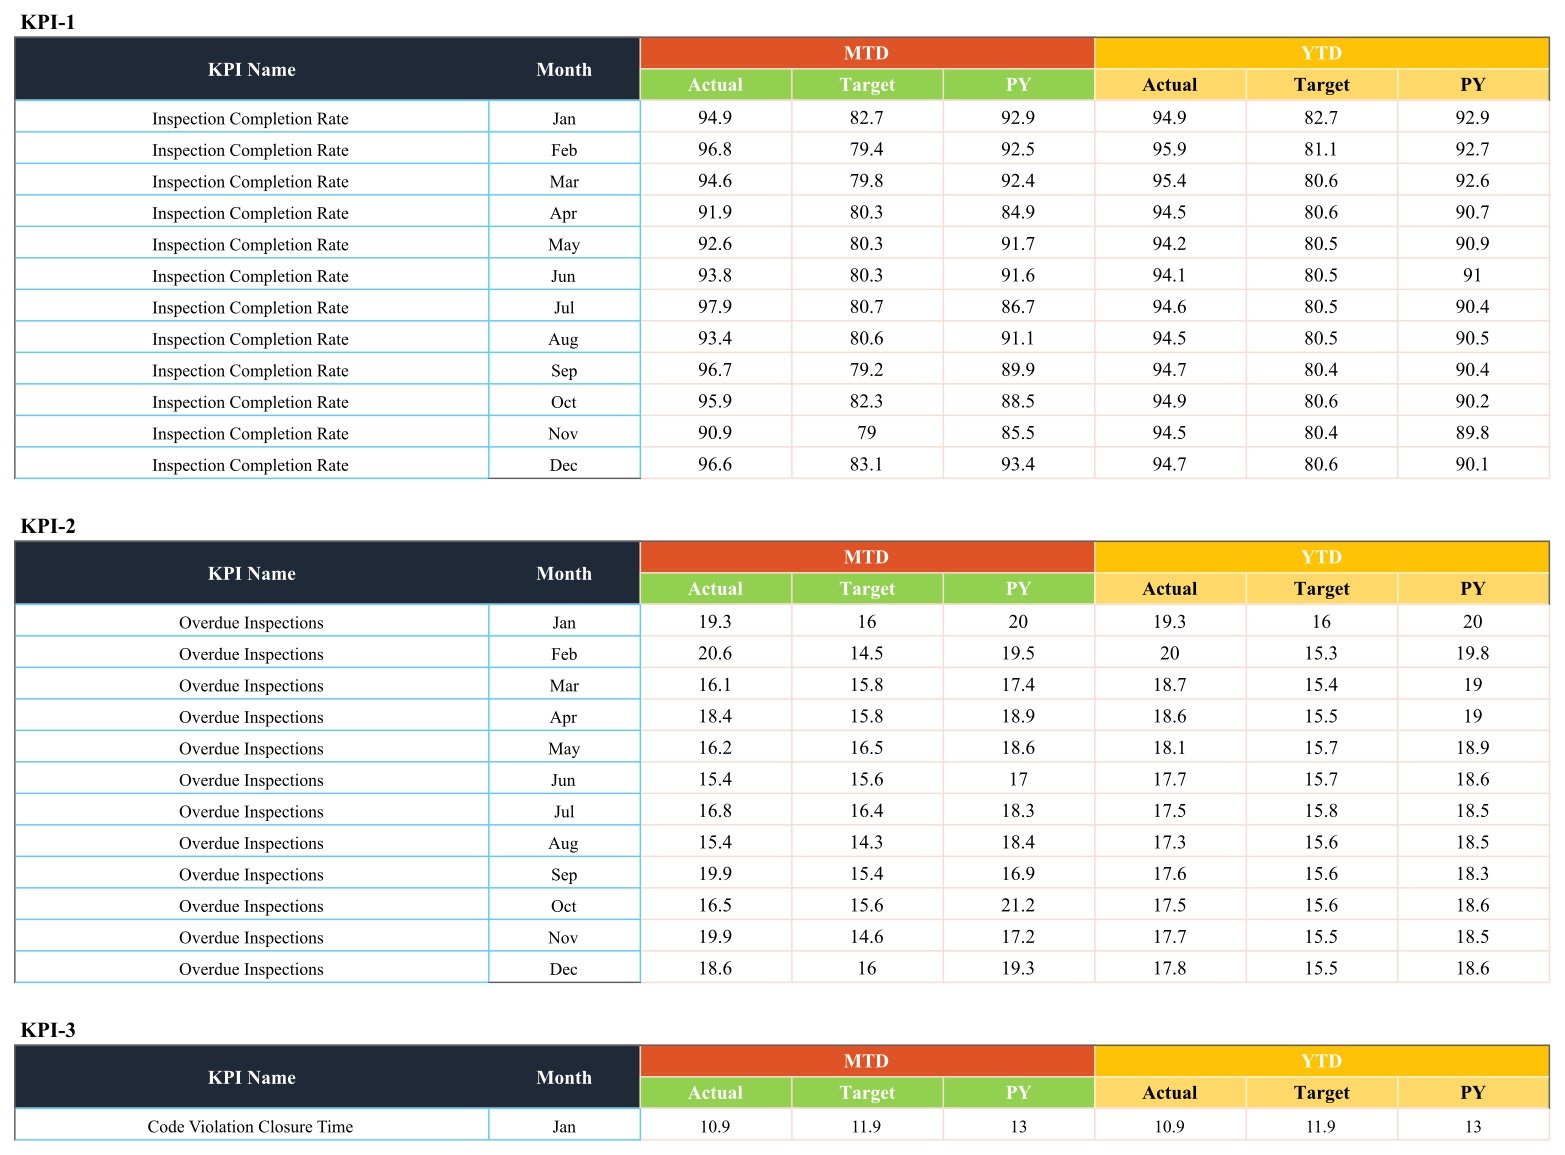
Ten stacked blocks, KPI-1 through KPI-10, twelve rows each. Six typed columns per row: MTD Actual, MTD Target, MTD PY, then YTD Actual, YTD Target, YTD PY. One hundred and twenty rows in total, and this is the only tab where you type anything.
Color Settings, Support, Trend_Support and Read Me
Color Settings holds the RAG variance table, with separate bands for upper-the-better and lower-the-better KPIs – that is where you change what counts as amber. Support and Trend_Support are the lookup engine behind the cards and the charts; leave them alone unless you enjoy that sort of thing. Read Me is, in this build, empty – see below.
What We Found When We Checked This Build
Two defects. Both real, both fixable in a couple of minutes, neither of them touching a calculation.Fire Safety Services KPI Scorecard in Google Sheets
1. The month dropdown does not match the data, and it blanks the scorecard. The Select Month list on the Scorecard tab offers Jan, Feb, Mar, Apr, May, June, July, Aug, Sep, Oct, Nov, Dec. The Input Data tab stores those two months as Jun and Jul. The scorecard looks the month up as exact text, so choosing June or July finds no matching row and all ten KPI cards go blank at once. The other ten months are fine.
The fix: click cell N1 on the Scorecard tab, open Data > Data validation, and change the two long names in the list to Jun and Jul. Nothing else needs touching. Do this before you show the sheet to anyone, because a blank scorecard looks like a broken template rather than a two-character typo.
2. The Read Me tab is empty. Not thin – completely blank, with no cells and no content at all. Everything a Read Me would tell you is in this post and on the KPI Definition tab, but if you hand the file to a colleague expecting a starting page, there is not one.
Everything else held up. We checked the traffic light against the variance on all ten cards, confirmed the five UTB and five LTB flags match the KPIs they are attached to, and confirmed the KPI Definition tab lists exactly ten KPIs with no stray eleventh row. The KPI Trend page is unaffected by the month bug because it reads all twelve months at once rather than looking one up.
What This Scorecard Is Not
Fire safety is a licensed, inspected trade, so it is worth being blunt about the boundary. This is a management reporting sheet. It reports ten monthly numbers that you type in.
- It does not check anything against NFPA, BS or any other code or standard.
- It does not issue, store or evidence inspection certificates.
- It holds no record of an individual inspection, device, premises, engineer or job.
- It is not an asset register, a dispatch system or a scheduling tool.
- It will not satisfy an insurer, a regulator or a certifying body on its own.
Keep whatever system your jurisdiction and your insurer expect. This sits alongside it and answers a different question: how did the business perform last month, and against what.
Fire Safety Services KPI Scorecard in Google Sheets vs. Excel vs. Paid Field-Service Software
| This Google Sheets scorecard | An Excel KPI scorecard | Paid field-service software | |
|---|---|---|---|
| Price model | One-time, under $15 | One-time, plus an Office licence | Per technician per month |
| Time to first useful screen | Minutes | Minutes | Days to weeks |
| Phone and tablet | Any browser | Mobile Excel app only | Native app |
| Rename KPIs, move thresholds | Fully | Fully | Only what the vendor exposes |
| Shared by link | Yes | No, you send a file | Per-seat invitations |
| Job, inspection and asset records | No | No | Yes |
| Certificates and code evidence | No | No | On some platforms |
| Number of KPIs | 10, fixed, named for the trade | Depends on the build | Dozens |
How the Google Sheets and Excel Editions Differ
NextGenTemplates ships this scorecard engine on both platforms, and the two lines are built independently rather than converted from each other. The Google Sheets edition runs in a browser, shares by link, and carries its “Make a copy” link inside the download PDF. The Excel edition is a workbook file you send around. Their KPI lists are set separately per trade, so a Google Sheets scorecard and its Excel namesake are not guaranteed to hold the same ten KPIs.
At the time of writing there is no Excel edition of the fire safety services scorecard. If you need Excel specifically, the closest published equivalents are the trade-service scorecards already on the Excel line.
Who Should Use This Template
It fits a fire-safety servicing business of roughly two to twenty-five technicians that already has its monthly totals somewhere and wants a monthly review page rather than another spreadsheet nobody opens. Owner-operators use it for their own trend line; small multi-van operations use it as the one shared page for a monthly meeting.
It does not fit anyone who wants live job tracking, dispatch, an asset register or automatic sync from a service platform, and it does not fit a daily or weekly cadence – the grain is one row per KPI per month.
Real-World Use Cases
The scheduling problem hiding behind good servicing. A six-technician firm sees Extinguisher Servicing Compliance green at 89.3% while Overdue Inspections sits red at 18.6 against a 16.0 target. The work gets done well; it gets scheduled late. Two cards next to each other made that visible in a way two separate reports never did.
Back-filling a year you never measured. A new owner fills the PY columns from the accountant’s monthly summaries, sets this year’s targets, and reviews the page on the last Friday of every month. False Alarm Rate gets the most attention, because it is lower-the-better and it drives callout cost directly.
Using half of it on purpose. A two-van operation fills only the Inspection & Compliance and Response & Emergency groups and leaves the other five KPIs on sample data. Nothing breaks – the unused cards keep showing demo numbers until they are overwritten.
Advantages of This Scorecard
- Ten KPIs named for fire-safety servicing, not generic business metrics retitled.
- Direction-aware traffic lights, correct on all five lower-the-better KPIs.
- Editable RAG bands rather than hard-coded thresholds.
- Every formula written out and auditable on one tab.
- Twelve months of sample data, so the sheet demonstrates itself.
- No macros, no add-ons, no install, no subscription.
Opportunities for Improvement
- The month dropdown mismatch described above needs fixing on first open.
- The Read Me tab ships empty.
- The grain is monthly only – there is no weekly or per-job view.
- Ten KPIs is a fixed structure; you can rename them but you cannot add an eleventh without rebuilding the Input Data blocks and the card wall.
- Nothing imports – every figure is typed.
Best Practices
- Fix the month list before anything else, then set your own targets before you set your own actuals – a scorecard against a target nobody agreed to is theatre.
- Agree the ten formula definitions with whoever produces the numbers, and write the agreed wording into the KPI Definition tab.
- Set the RAG bands once, at the start of a year, and leave them alone. Moving a threshold to turn a card green is the fastest way to make the whole page worthless.
- Review Vs. Target first, then flip to Vs. PY. A red against target that is green against last year is a different conversation from a red against both.
- Keep client names, site addresses and device records out of the file, and use named-person sharing rather than a public link if you ever add anything identifying.
Explore Relevant Templates
Other walkthroughs on the same scorecard engine: the Locksmith Business KPI Scorecard in Google Sheets, the Pest Control Business KPI Scorecard in Google Sheets, the Garage Door Service KPI Scorecard in Google Sheets, the Septic Tank Service KPI Scorecard in Google Sheets and the Fencing Contractor KPI Scorecard in Google Sheets.
If you want the operational detail this scorecard deliberately leaves out, the Office Safety Inspection Tracker in Google Sheets logs individual inspections and the Office Fire Drill Log Tracker in Google Sheets records drills one by one. For the dashboard-family alternative to this scorecard, see the Warehouse Safety KPI Dashboard in Google Sheets, and for a broader operational view the Public Safety Dashboard in Google Sheets.
Interested in how reporting pages like this are built? The Excel Pivot Tables & Dashboards course on NextGenTemplates Academy covers it step by step, with practice files.
Get the Fire Safety Services KPI Scorecard in Google Sheets
Frequently Asked Questions
What exactly do I download?
A PDF. It contains a “Make a copy” link that creates your own editable Google Sheet in your own Drive. There is no spreadsheet file to manage and nothing to install.
Do I need a paid Google account?
No. A free personal Google account is enough.
Will selecting June really blank the whole scorecard?
Yes, until you edit the dropdown. The list offers “June” and “July” while the data stores “Jun” and “Jul”, and the lookup is an exact text match, so nothing is found and every card returns empty. Change the two entries in the data validation list on cell N1 and it is fixed permanently.
Can I change the KPIs?
Yes – the name, group, unit, formula text and UTB/LTB flag all live on the KPI Definition tab, and the Scorecard and KPI Trend pages follow. The count is fixed at ten; the names are not.
Why do five KPIs go red when the number rises?
Overdue Inspections, Code Violation Closure Time, Mean Emergency Response Time, False Alarm Rate and Service Callback Rate are lower-the-better. A rise in any of them is a worse result, and the traffic light reflects that.
How is this different from your KPI Dashboard templates?
The KPI Scorecard family is a fixed grid of ten target-versus-actual cards plus a per-KPI trend page, fed by typed monthly input. The KPI Dashboard line is a separate build with a month picker over a traffic-light grid plus KPI Trend and KPI Analysis pages. Different products with similar names – pick the scorecard for a monthly review page, the dashboard for more analysis surface.
Can I use it for compliance or insurance paperwork?
No. It reports monthly performance numbers and nothing else. It does not check code conformance, it issues no certificates, and it stores no inspection or device records. Use it alongside your compliance system, never instead of one.
About the Author
Built by PK – a Microsoft Certified Professional with over fifteen years in Excel, Google Sheets and Power BI, and the founder of NextGenTemplates, whose YouTube channels reach more than 300,000 subscribers. Every template is hand-built and checked before release, which is why this post names two defects instead of pretending there are none.
Conclusion
The Fire Safety Services KPI Scorecard in Google Sheets does one thing: it turns ten monthly numbers into a page a management meeting can read in ten seconds, with the direction of each KPI handled correctly. Fix the two-month dropdown on first open, accept that the Read Me tab is blank, and you have a monthly review page for the price of lunch.
Get it here: Fire Safety Services KPI Scorecard in Google Sheets – one-time price, instant download, lifetime access to your own copy.