In today’s fast-paced data-driven world, businesses need efficient tools to analyze and visualize information quickly. Google Sheets is one such tool that offers both flexibility and functionality when it comes to data management and visualization. One of its powerful features is the ability to create dynamic dashboards, which help decision-makers track performance, trends, and other […]
Tag: Performance Tracking
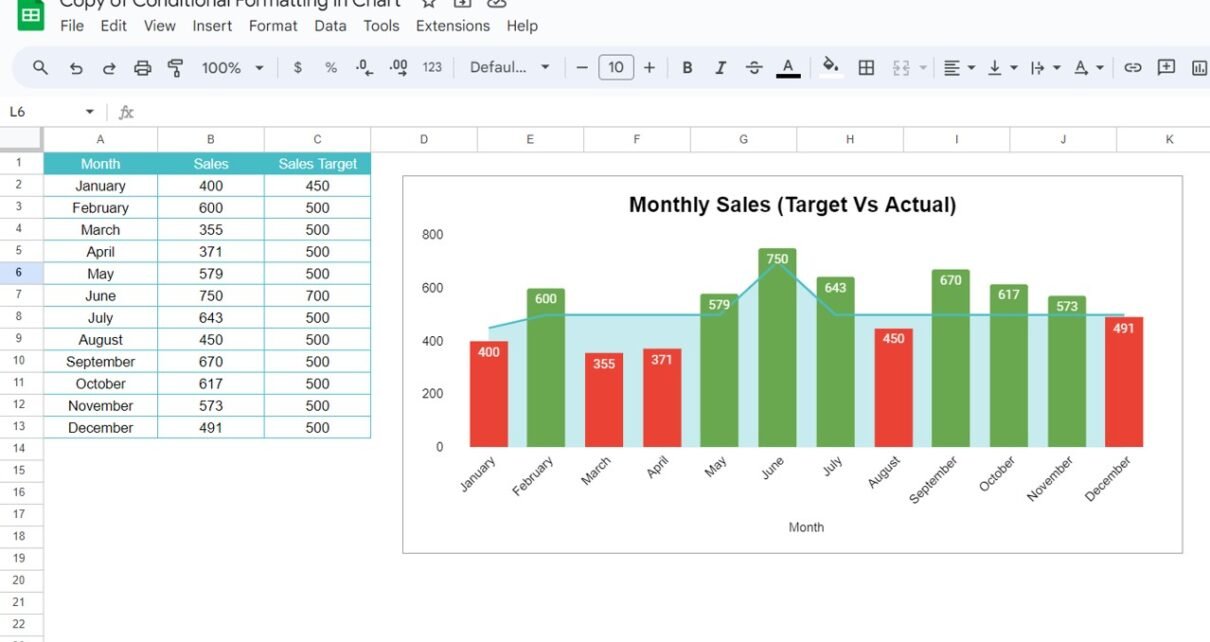
Conditional Formatting in a Google Sheets Chart (Target vs Actual)
Make Google Sheets chart bars turn red when sales miss the target and green when they meet it, using two IF/NA() helper columns and a stacked combo chart. Free practice file included.
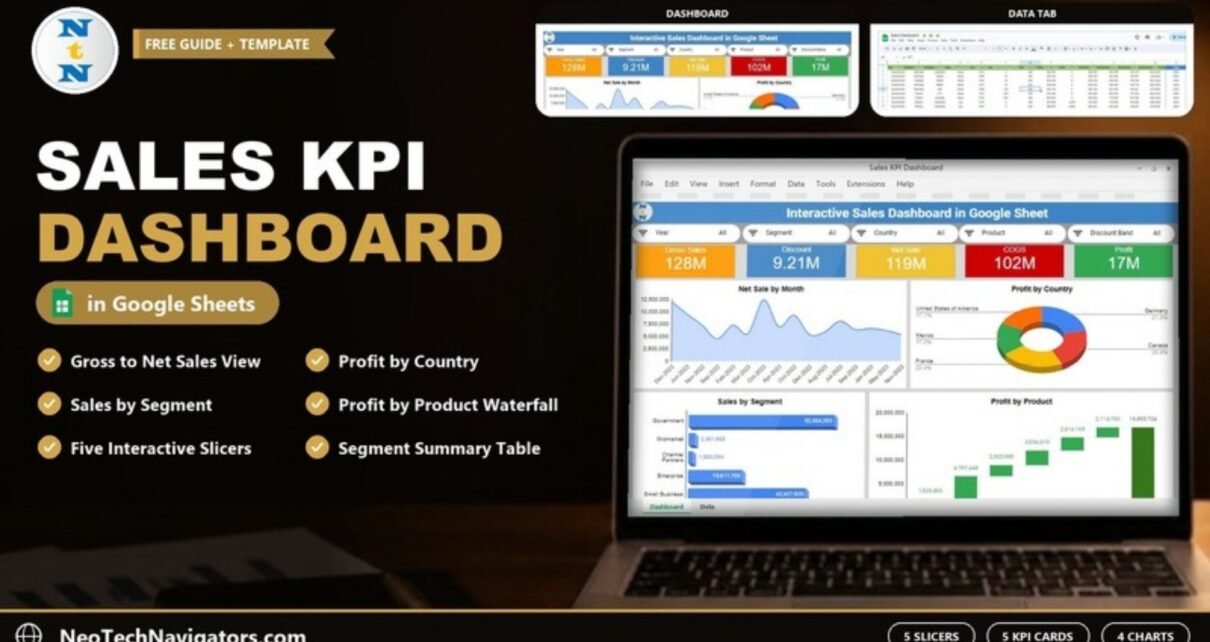
Sales KPI Dashboard in Google Sheets
A ready-made Sales KPI Dashboard in Google Sheets with five slicers, Gross Sales, Discount, Net Sale, COGS and Profit cards, and charts by month, country, segment and product. See how each part works and how to load your own data.